[ZBX-25609] TimescaleDB: aggregated compressed column not found Created: 2024 Nov 26  Updated: 2025 Jun 17  Resolved: 2025 Apr 01

Status: Closed
Project: ZABBIX BUGS AND ISSUES
Component/s: Frontend (F)
Affects Version/s: 7.0.6
Fix Version/s: None

Type: Problem report Priority: Trivial
Reporter: Kai Kimera Assignee: Armands Arseniuss Skolmeisters
Resolution: Workaround proposed Votes: 2
Labels: None
Remaining Estimate: Not Specified
Time Spent: Not Specified
Original Estimate: Not Specified
Environment:

Debian v12.8, TimescaleDB v2.17.2, Postgresql v16.6, Zabbix 7.0.6.


Attachments: PNG File 2024-11-26 15.08.32 status.k.x 73b539ecc707.png     PNG File image-2025-03-14-19-51-16-850.png     PNG File image-2025-03-14-19-51-57-503.png     PNG File image-2025-03-14-19-52-56-181.png     PNG File image-2025-03-14-19-53-29-767.png     PNG File image-2025-03-14-19-53-52-328.png     PNG File zabbix.png    
Issue Links:
Duplicate
duplicates ZBX-26181 TimescaleDB 2.18.2 aggregated compres... Closed
is duplicated by ZBX-25644 Trend data corrupted after upgrade to... Closed
is duplicated by ZBX-26250 Enabling TimescaleDB compression caus... Closed
Sprint: S25-W14/15

 Description   

Steps to reproduce:

  1. Go to graphs.
  2. Select "Last 30 Days".
  3. See the error on the screenshot.


Result:

  1. See screenshot.
  2. Log error:
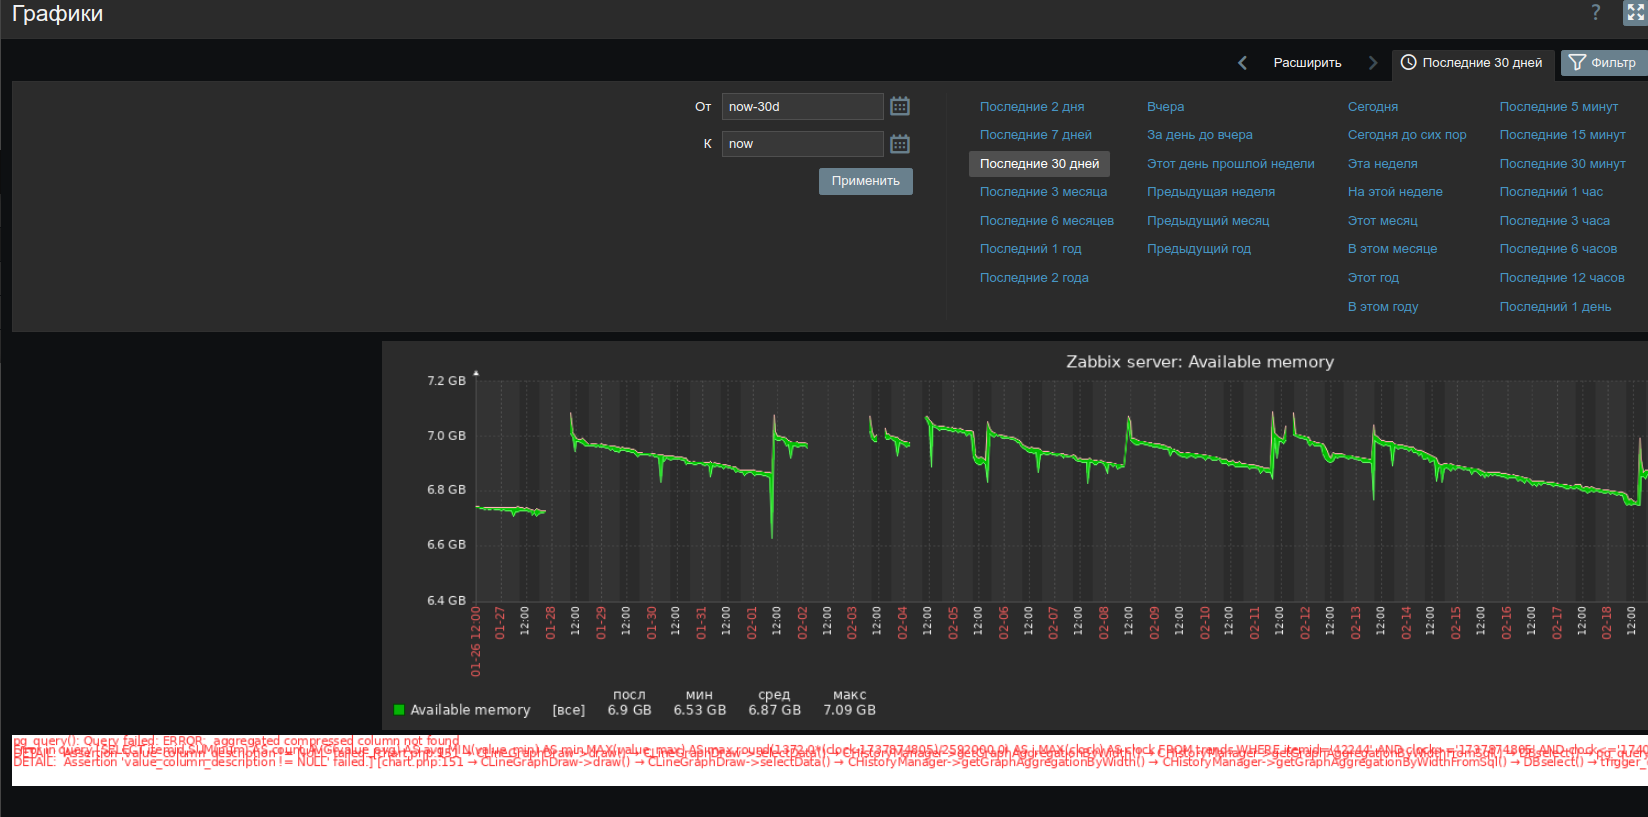
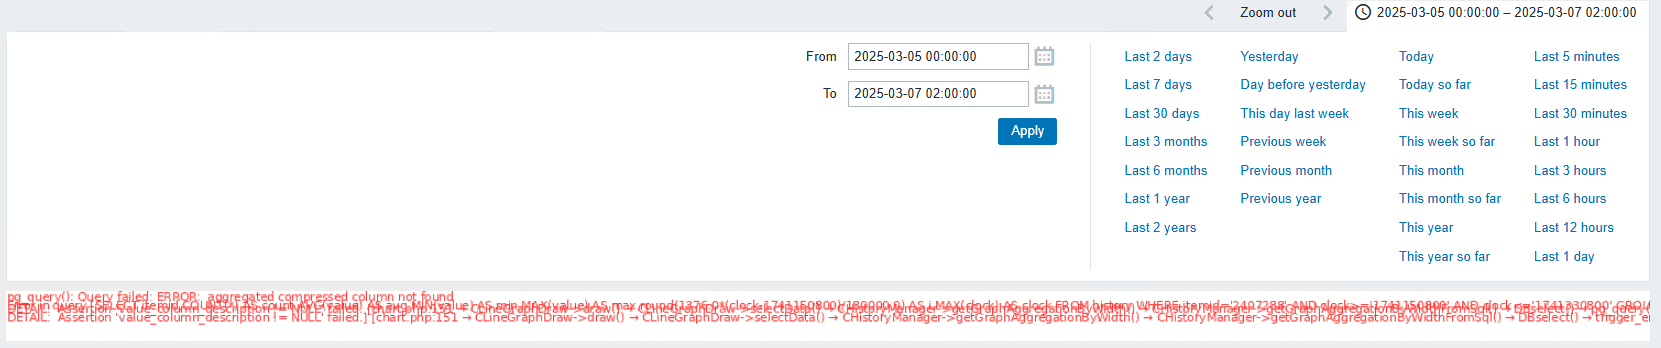
2024-11-26 10:50:10.777 UTC [127989] zabbix@zabbix ERROR:  aggregated compressed column not found
2024-11-26 10:50:10.777 UTC [127989] zabbix@zabbix DETAIL:  Assertion 'value_column_description != NULL' failed.
2024-11-26 10:50:10.777 UTC [127989] zabbix@zabbix STATEMENT:  SELECT itemid,COUNT(*) AS count,AVG(value) AS avg,MIN(value) AS min,MAX(value) AS max,round(1607.0*(clock-1731963600)/86399,0) AS i,MAX(clock) AS clock FROM history WHERE itemid='50441' AND clock>='1731963600' AND clock<='1732049999' GROUP BY itemid,round(1607.0*(clock-1731963600)/86399,0)


Additionally:

I found out that the problem is in TimescaleDB. I found an issue:

  1. https://github.com/timescale/timescaledb/issues/7410
  2. https://github.com/timescale/timescaledb/pull/7415#issuecomment-2500314015

The developers will fix the problem in TimescaleDB v2.18. But Zabbix v7.0.6 supports maximum TimescaleDB v2.17. Please increase the supported TimescaleDB version in the next version of Zabbix.


 Comments   
Comment by Alexander Vladishev [ 2024 Nov 26 ]

TimescaleDB 2.18.0 has not been released yet. Once it becomes available, we will add support for this version in Zabbix.

Comment by Armands Arseniuss Skolmeisters [ 2024 Dec 04 ]

As written in the first link https://github.com/timescale/timescaledb/issues/7410 problem is due to TimescaleDB internal bug. The fix is going to be released in TimescaleDB version 2.18.
Meanwhile setting timescaledb.enable_vectorized_aggregation = off can be used as workaround.

Comment by Raimond Kollman [ 2024 Dec 05 ]

What askolmeisters writes, is right. I also implemented this at some installations for clients using PostgreSQL 16 together with TimescaleDB 2.17.x..

We'll just have to wait for TimescaleDB 2.18 and in the meanwhile have the setting timescaledb.enable_vectorized_aggregation = off  set in the postgresql-config file (don't forget to restart PostgreSQL for this to become active!).

For the dutch speaking Zabbix users I wrote a little article on this to help them: https://www.xifeo.nl/zabbix/blog/problemen-zabbix-grafieken-met-timescaledb-2-17-x/

Comment by Adrian Cunnelly [ 2025 Feb 07 ]

I can confirm that adding timescaledb.enable_vectorized_aggregation = off in the prostgresql configuration file fixes the issue, also you do not need to restart the postgresql service a simple reload of the configuration using SELECT pg_reload_conf(); will suffice.

Comment by Yuri [ 2025 Feb 25 ]

Today i upgraded zabbix-server to 7.0.10  and timescaledb to 2.18.2 and problem still exist

Comment by Edwin Patiño [ 2025 Mar 15 ]

I have the same problem

Comment by Alexander Vladishev [ 2025 Mar 15 ]

Based on user comments, I am reopening this issue for further investigation.

Comment by Edwin Patiño [ 2025 Mar 15 ]

Thanks


Comment by Artjoms Rimdjonoks [ 2025 Mar 17 ]

FYI
Zabbix added support for Timescaledb 2.18 in ZBXNEXT-9771 in versions:
pre-6.0.39rc1
pre-7.0.10rc1
pre-7.2.4rc1
pre-7.4.0alpha1

Comment by Yuri [ 2025 Mar 18 ]

today I tried to open the charts for the last 30 days again
I don't see any problems. although they were. see my screenshot above.
but if I switch charts for the last 3 months or older - I get errors

Comment by Ihor Romanyshyn [ 2025 Mar 25 ]

Guys, just letting you know, in my case, I managed to resolve it by upgrading the TimescaleDB extension to 2.18.2, and even before that, I had initiated reindexing, like ChatGPT informed me.

REINDEX TABLE history;
REINDEX TABLE trends;
ANALYZE history;
ANALYZE trends; 

Don't know if it was necessary, but now it works like expected.

Comment by Yuri [ 2025 Mar 26 ]

Do this commands on already upgraded to 2.18.2 installation. Not worked for me.

Also notice errors on 30-day history again. 

Try to get problem date.

from now-13d - no errors

from now-14d - errors


Comment by Raimond Kollman [ 2025 Mar 26 ]

I recently upgraded to TimescaleDB 2.19 (and have PostgreSQL 16). I resetted the"timescaledb.enable_vectorized_aggregation" to the default and restarted PostgreSQL. 
Everything works for me right now, so it looks like the 2.19 TimescaleDB version fixes this issue finally!

Comment by Yuri [ 2025 Mar 26 ]

Upgrading TimescaleDB to 2.19 not work for me. Problem still exist.

Comment by Raimond Kollman [ 2025 Mar 26 ]

Did you also update the extension in the database itself?

Comment by Yuri [ 2025 Mar 26 ]

I did full apt-get update && apt-get dist-upgrade and restarted the server.

Comment by Raimond Kollman [ 2025 Mar 26 ]

No, that doesn't do the trick.

First shutdown zabbix-server (to be safe and sure)
You have to logon as postgresql-user:
`psql -X zabbix`

zabbix=# \dx

(check which extension is used)

zabbxix=# quit

connect again (psql -X zabbix)
zabbix=# ALTER EXTENSION timescaledb UPDATE;


Then you can check the version and it should state something like this:

{{                                                List of installed extensions
    Name     | Version |   Schema   |                                      Description                                      
-----------------------------+--------------------------------------------------------------------------------------
 plpgsql     | 1.0     | pg_catalog | PL/pgSQL procedural language
 timescaledb | 2.19.0  | public     | Enables scalable inserts and complex queries for time-series data (Community Edition)
(2 rows)
}}

Comment by Yuri [ 2025 Mar 27 ]

Many thanks, Raimond.

I rolled back a snapshot Zabbix VM from yesterday test upgrade to 2.19

Despite the installed TimescaleDB version is 2.18.2

\dx shows:

    Name     | Version |   Schema   |

------------------------------+

 plpgsql     | 1.0     | pg_catalog |

 timescaledb | 2.17.2  | public     |

after i execute command  

ALTER EXTENSION timescaledb UPDATE;

\dx shows 2.18.2 and problem is gone.

I'll stay on 2.18.2 as supported version for now.

Comment by Raimond Kollman [ 2025 Mar 27 ]

Great that it worked! That's a step which people forget to do quite a lot. The binaries are upgraded, but your extension in the database has to be done manually .

Comment by Gabriele Armao [ 2025 Mar 27 ]

upgrading timescaledb extension from 2.17 to 2.18.2 fixed the problem also for me on Postgres 17

Comment by Romain [ 2025 Mar 31 ]

Hi Same as above. After upgrading to 2.18.2 on my PG 17 instance, everything is back to normal. Thanks for your help !

Generated at Sat Jul 05 09:11:30 EEST 2025 using Jira 9.12.4#9120004-sha1:625303b708afdb767e17cb2838290c41888e9ff0.