[ZBX-26185] High Memory utilization on Proxy Created: 2025 Mar 16 Updated: 2025 Apr 15 Resolved: 2025 Apr 15 |
|
| Status: | Closed |
| Project: | ZABBIX BUGS AND ISSUES |
| Component/s: | Proxy (P) |
| Affects Version/s: | None |
| Fix Version/s: | None |
| Type: | Problem report | Priority: | Trivial |
| Reporter: | Dileep B | Assignee: | Zabbix Support Team |
| Resolution: | False Positive | Votes: | 0 |
| Labels: | bug, memoryleak, performance, proxy | ||
| Remaining Estimate: | Not Specified | ||
| Time Spent: | Not Specified | ||
| Original Estimate: | Not Specified | ||
| Attachments: |
|
| Description |
|
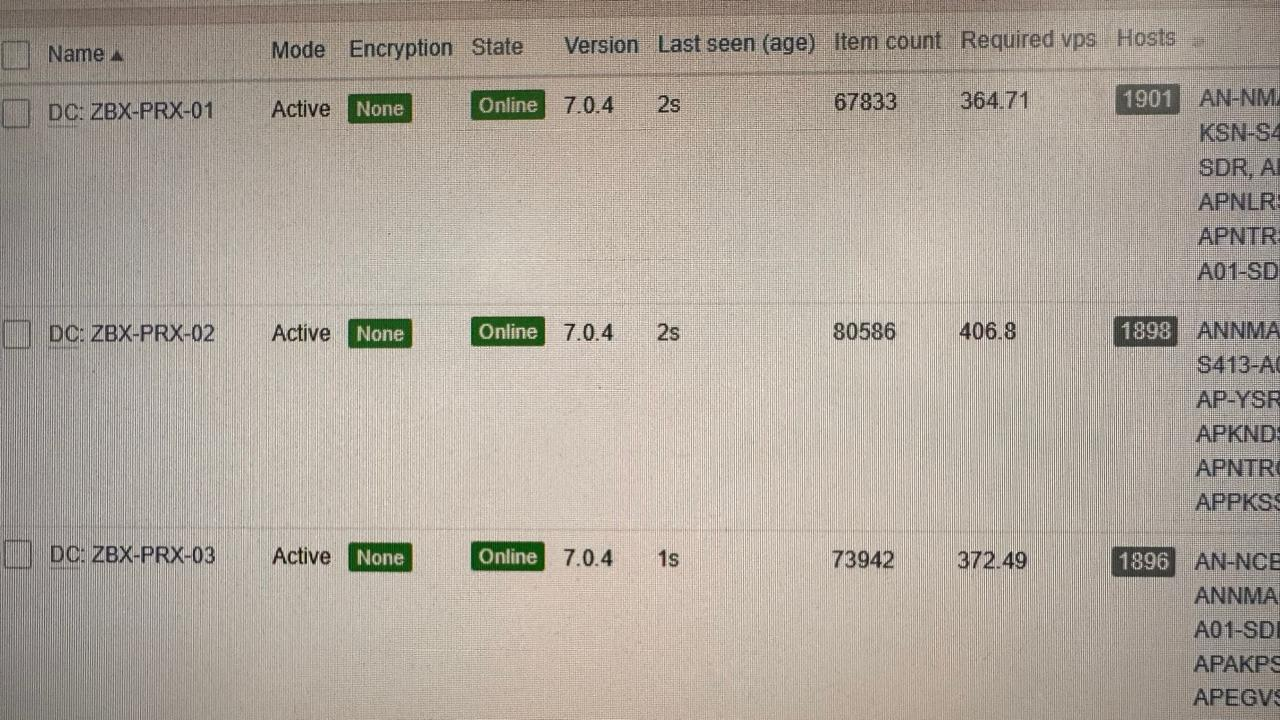
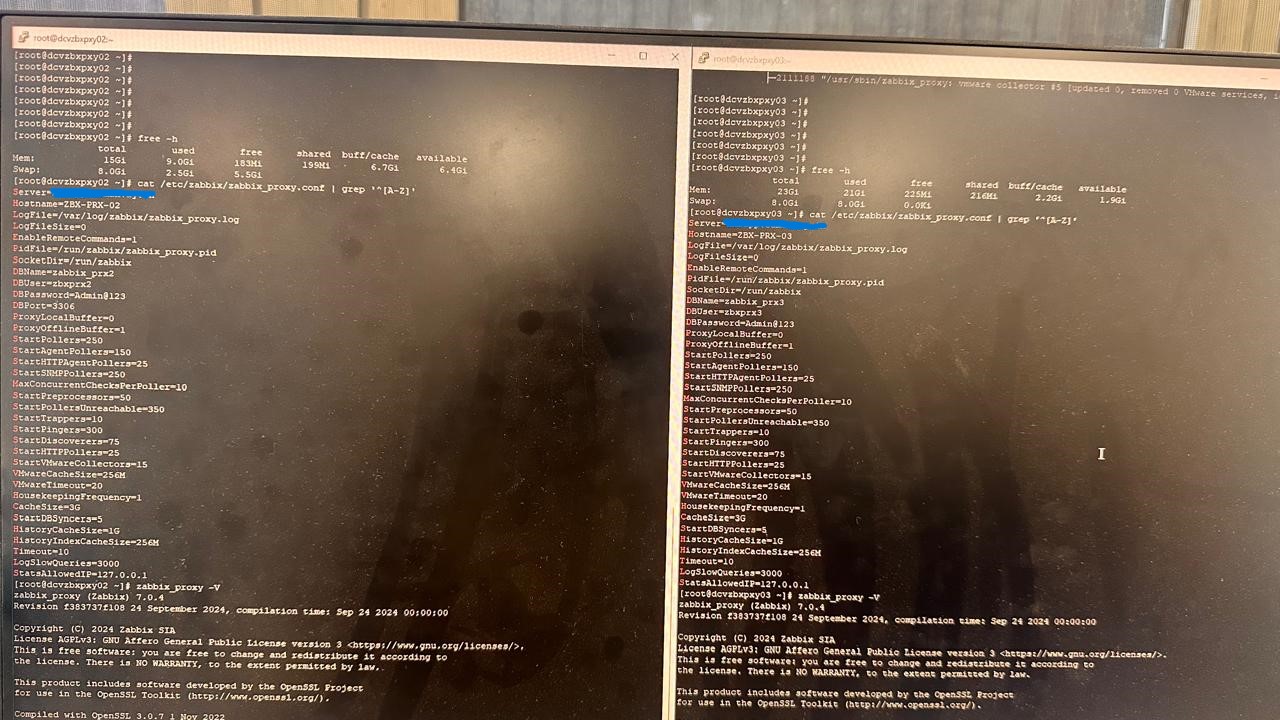
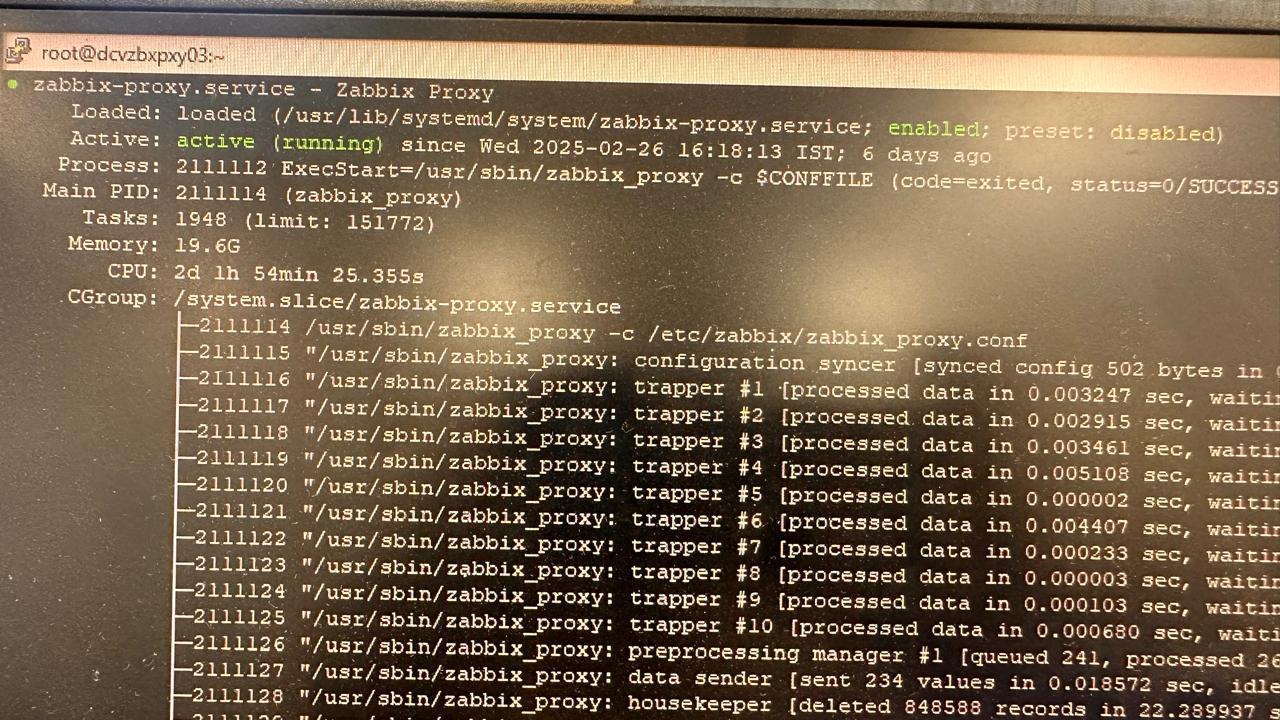
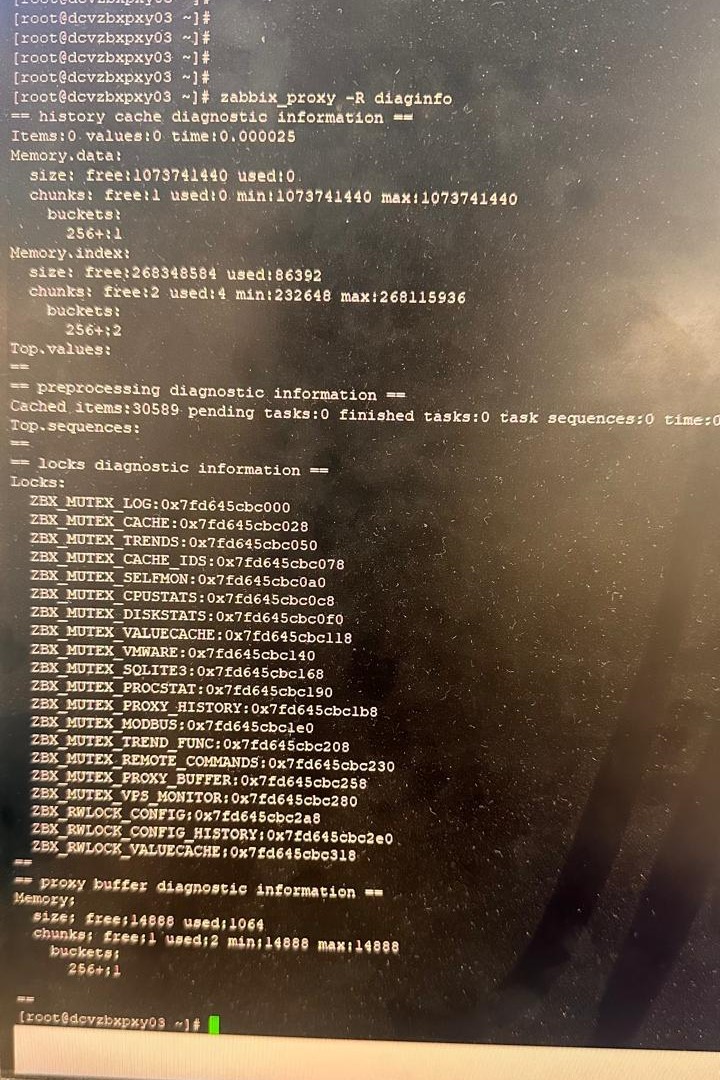
We are using 3 proxies in ONE proxy group where all 3 proxies have balanced load. Can see below snap which says equal load load is distributed and all 3 proxies of same version 7.0.4. Please find the parameter configuration which is same for both the proxies and the memory free also: Please find the memory util of prx-03 : please find the diaginfo of prx-03: I have checked and found this https://support.zabbix.com/browse/ZBX-24712 ticket where it says it will be fixed in 7.0.1 but we are using 7.0.4 where we are still facing this issue. Thought of might be an VM issue so I have cloned the vm of prx-02 which is working fine and have edited the DB and proxy config file and made it as Proxy-03 but still no use so as an interim solution we have increased the RAM of the Proxy-03 for now. Also tried https://support.zabbix.com/browse/ZBXNEXT-9625 but still no effect on that memory leak issue.. Still same.. |
| Comments |
| Comment by Dileep B [ 2025 Mar 16 ] |
|
Sorry for the images missing in the above description. Please find the correct one below Please find the parameter configuration which is same for both the proxies and the memory free also: Please find the memory util of prx-03 : please find the diaginfo of prx-03: |
| Comment by Vladislavs Sokurenko [ 2025 Mar 18 ] |
|
Could you please be so kind and identify exact process that is consuming memory ? |
| Comment by Dileep B [ 2025 Mar 19 ] |
|
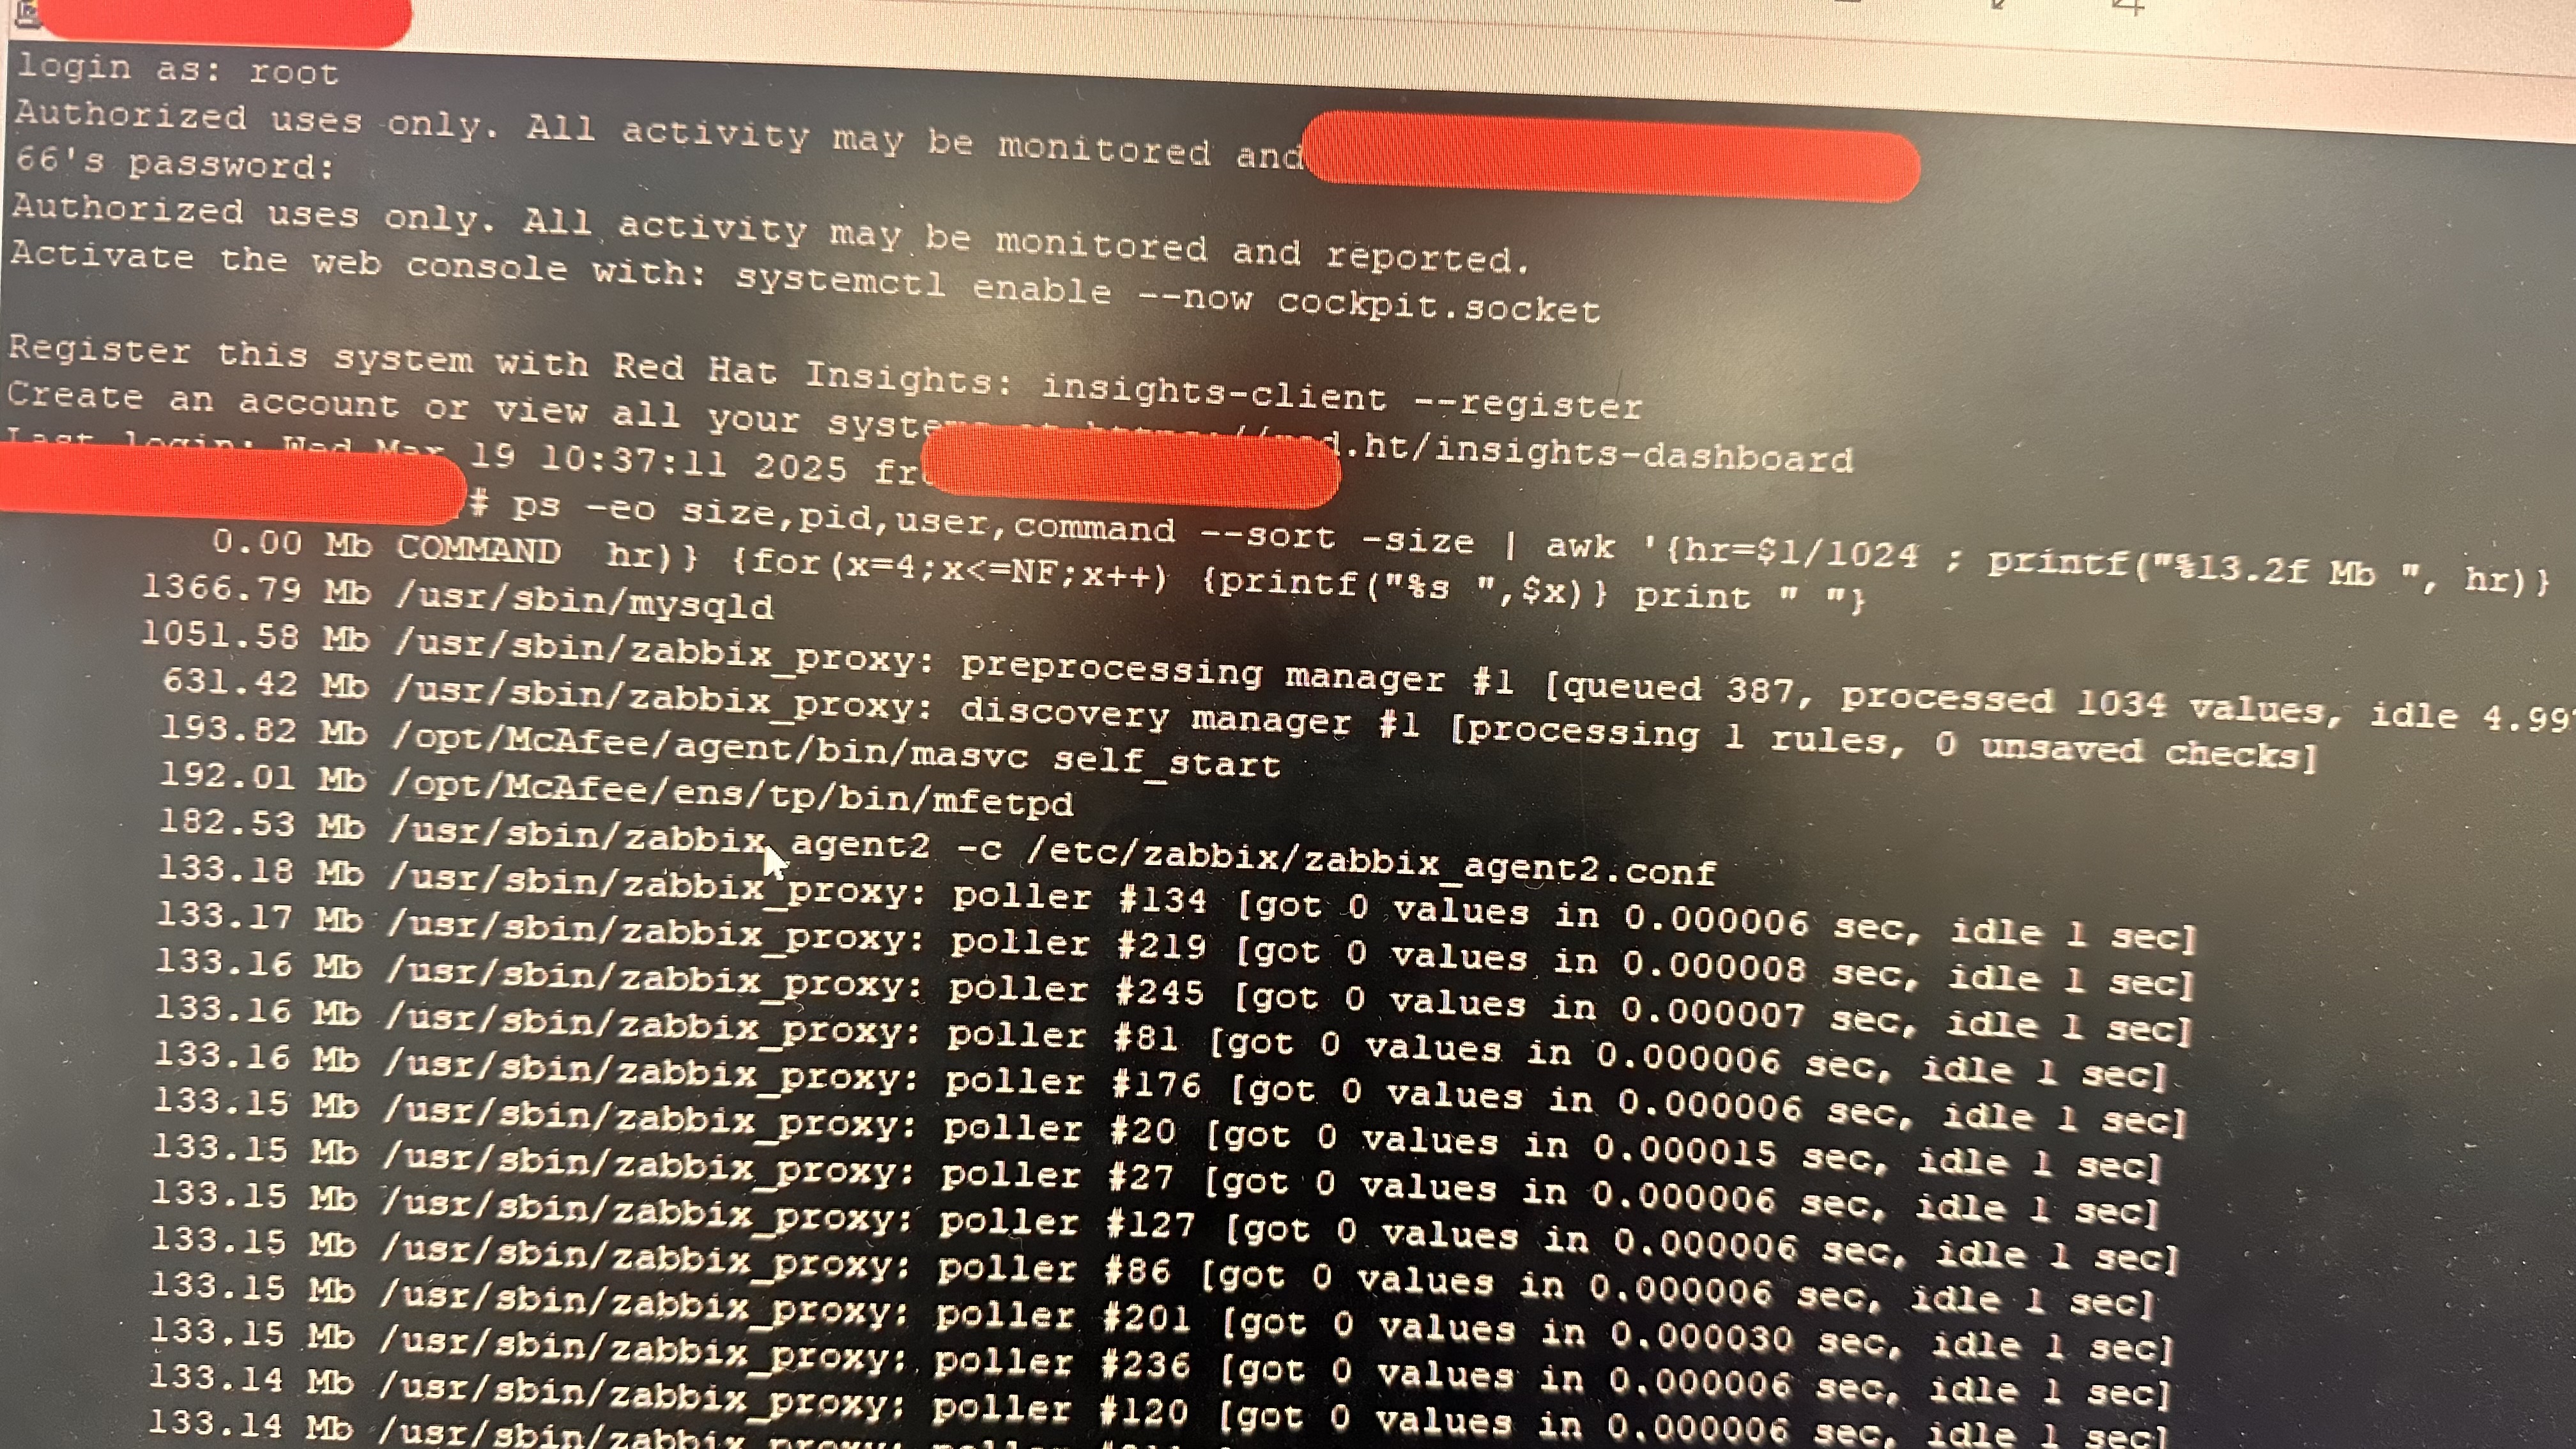
Hello please find the snapshot of list of processes with memory util |
| Comment by Dileep B [ 2025 Mar 23 ] |
|
Hello vso have attached the list of processes with their memory utils. Can you please check and help me out? Please let me know if any additional information is required. |
| Comment by Vladislavs Sokurenko [ 2025 Mar 26 ] |
|
Please try setting environment variable for Zabbix proxy service and restart export MALLOC_TRIM_THRESHOLD_=134217728 |
| Comment by Dileep B [ 2025 Mar 29 ] |
|
Hi vso, have tried the command you shared. And checked for 48hrs there is no change. The memory util went high to 95% gradually. Have restarted the VM as well and entered the command you shared. But still same behaviour. |
| Comment by Dileep B [ 2025 Apr 02 ] |
|
Hi vso, tried using the libjemalloc module in "LoadModule" parameter in proxy config file. When restarted have got this error : 'cannot load module "/usr/lib64/libjemalloc.so.2" : /usr/lib64/libjemalloc.so.2 : cannot allocate memory in static TLS block' in zabbix_proxy.log |
| Comment by Vladislavs Sokurenko [ 2025 Apr 07 ] |
|
It should have been loaded with LD_PRELOAD such as: Or just: |
| Comment by Vladislavs Sokurenko [ 2025 Apr 09 ] |
|
Current suspicion is that there are event log keys that send too much data, is VMware used ? |
| Comment by Dileep B [ 2025 Apr 09 ] |
|
Yes we are monitoring VmWare, but vmware logs monitoring is disabled. |
| Comment by Vladislavs Sokurenko [ 2025 Apr 09 ] |
|
There seem to be similar issue but with higher consumption: |
| Comment by Vladislavs Sokurenko [ 2025 Apr 09 ] |
|
Could you please be so kind and double check with following query ?
select key_,status from items where key_ like 'vmware.eventlog%' and status=0;
|
| Comment by Dileep B [ 2025 Apr 10 ] |
|
Hello vso, have checked on the vmware eventlog items. Those are not present as I have removed them from the template itself. Also, I suspected network discovery. I have 18 network discovery rules with /22 subnet and thier respective discovery actions. I have disabled all these network discovery rules for 24hrs, but still the memory utilization is reaching 98% and crashing. |
| Comment by Dileep B [ 2025 Apr 10 ] |
|
Have tried LD_PRELOAD command that you shared, which is making the proxy in activating stage but never coming to active state. |
| Comment by Dileep B [ 2025 Apr 10 ] |
|
Then i have restarted the VM then the proxy started and acting same reaching 98% memory util in 24hrs. |
| Comment by Vladislavs Sokurenko [ 2025 Apr 10 ] |
|
There seems to be no issue with preprocessing manager, please lower poller count (it looks like there are hundreds in latest screenshot), since most of the checks can be done by async pollers you probably just need few StartPollers and increase only if you start to see queue increasing or poller utilized too much. |
| Comment by Dileep B [ 2025 Apr 10 ] |
|
Ok sure, will reduce to the necessary and will monitor for 24hrs. |
| Comment by Dileep B [ 2025 Apr 15 ] |
|
Hi vso, have reduced the number of all pollers and could see there is decrease in the memory utilization. Now it seems to be constant util at 70% since 48 hrs. Now I have further decreased the pollers and will monitor further. |
| Comment by Vladislavs Sokurenko [ 2025 Apr 15 ] |
|
Thank you, closing for now |