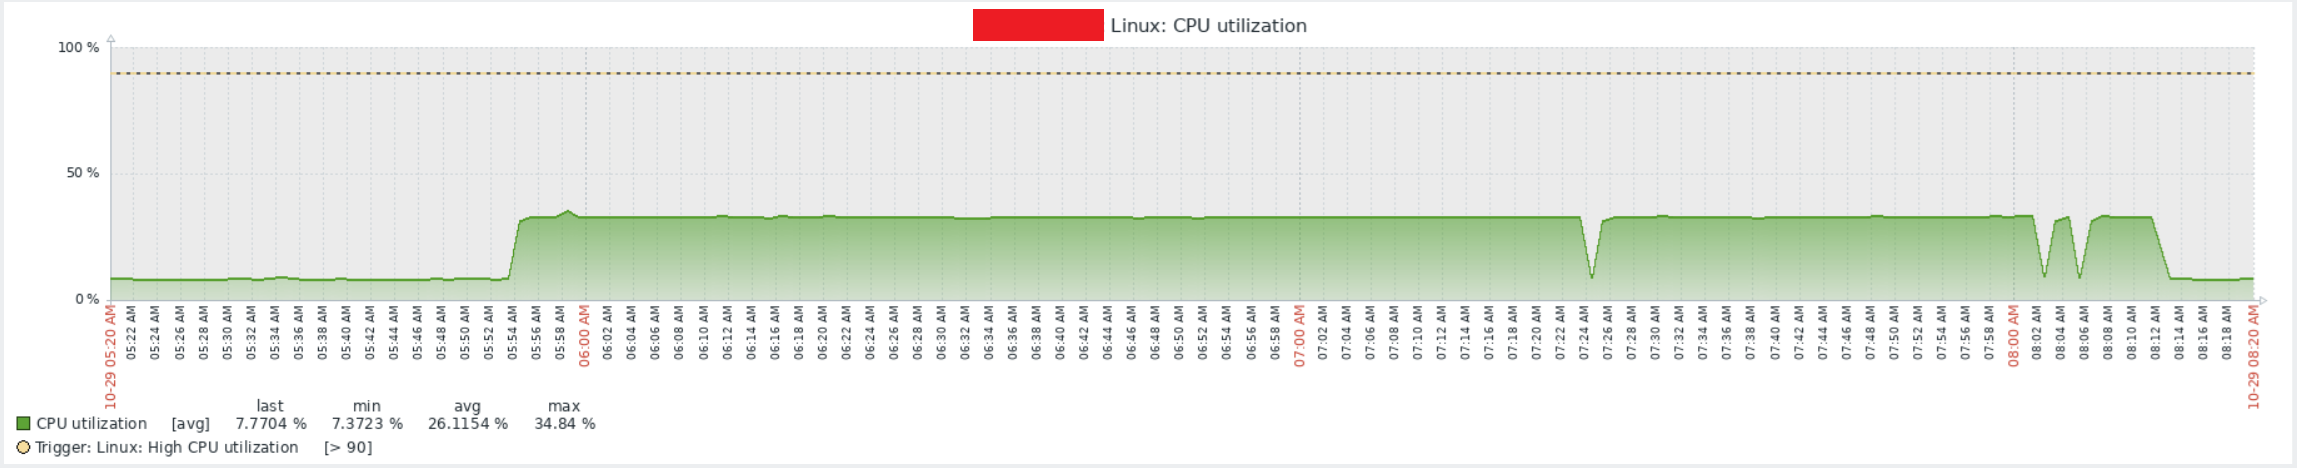
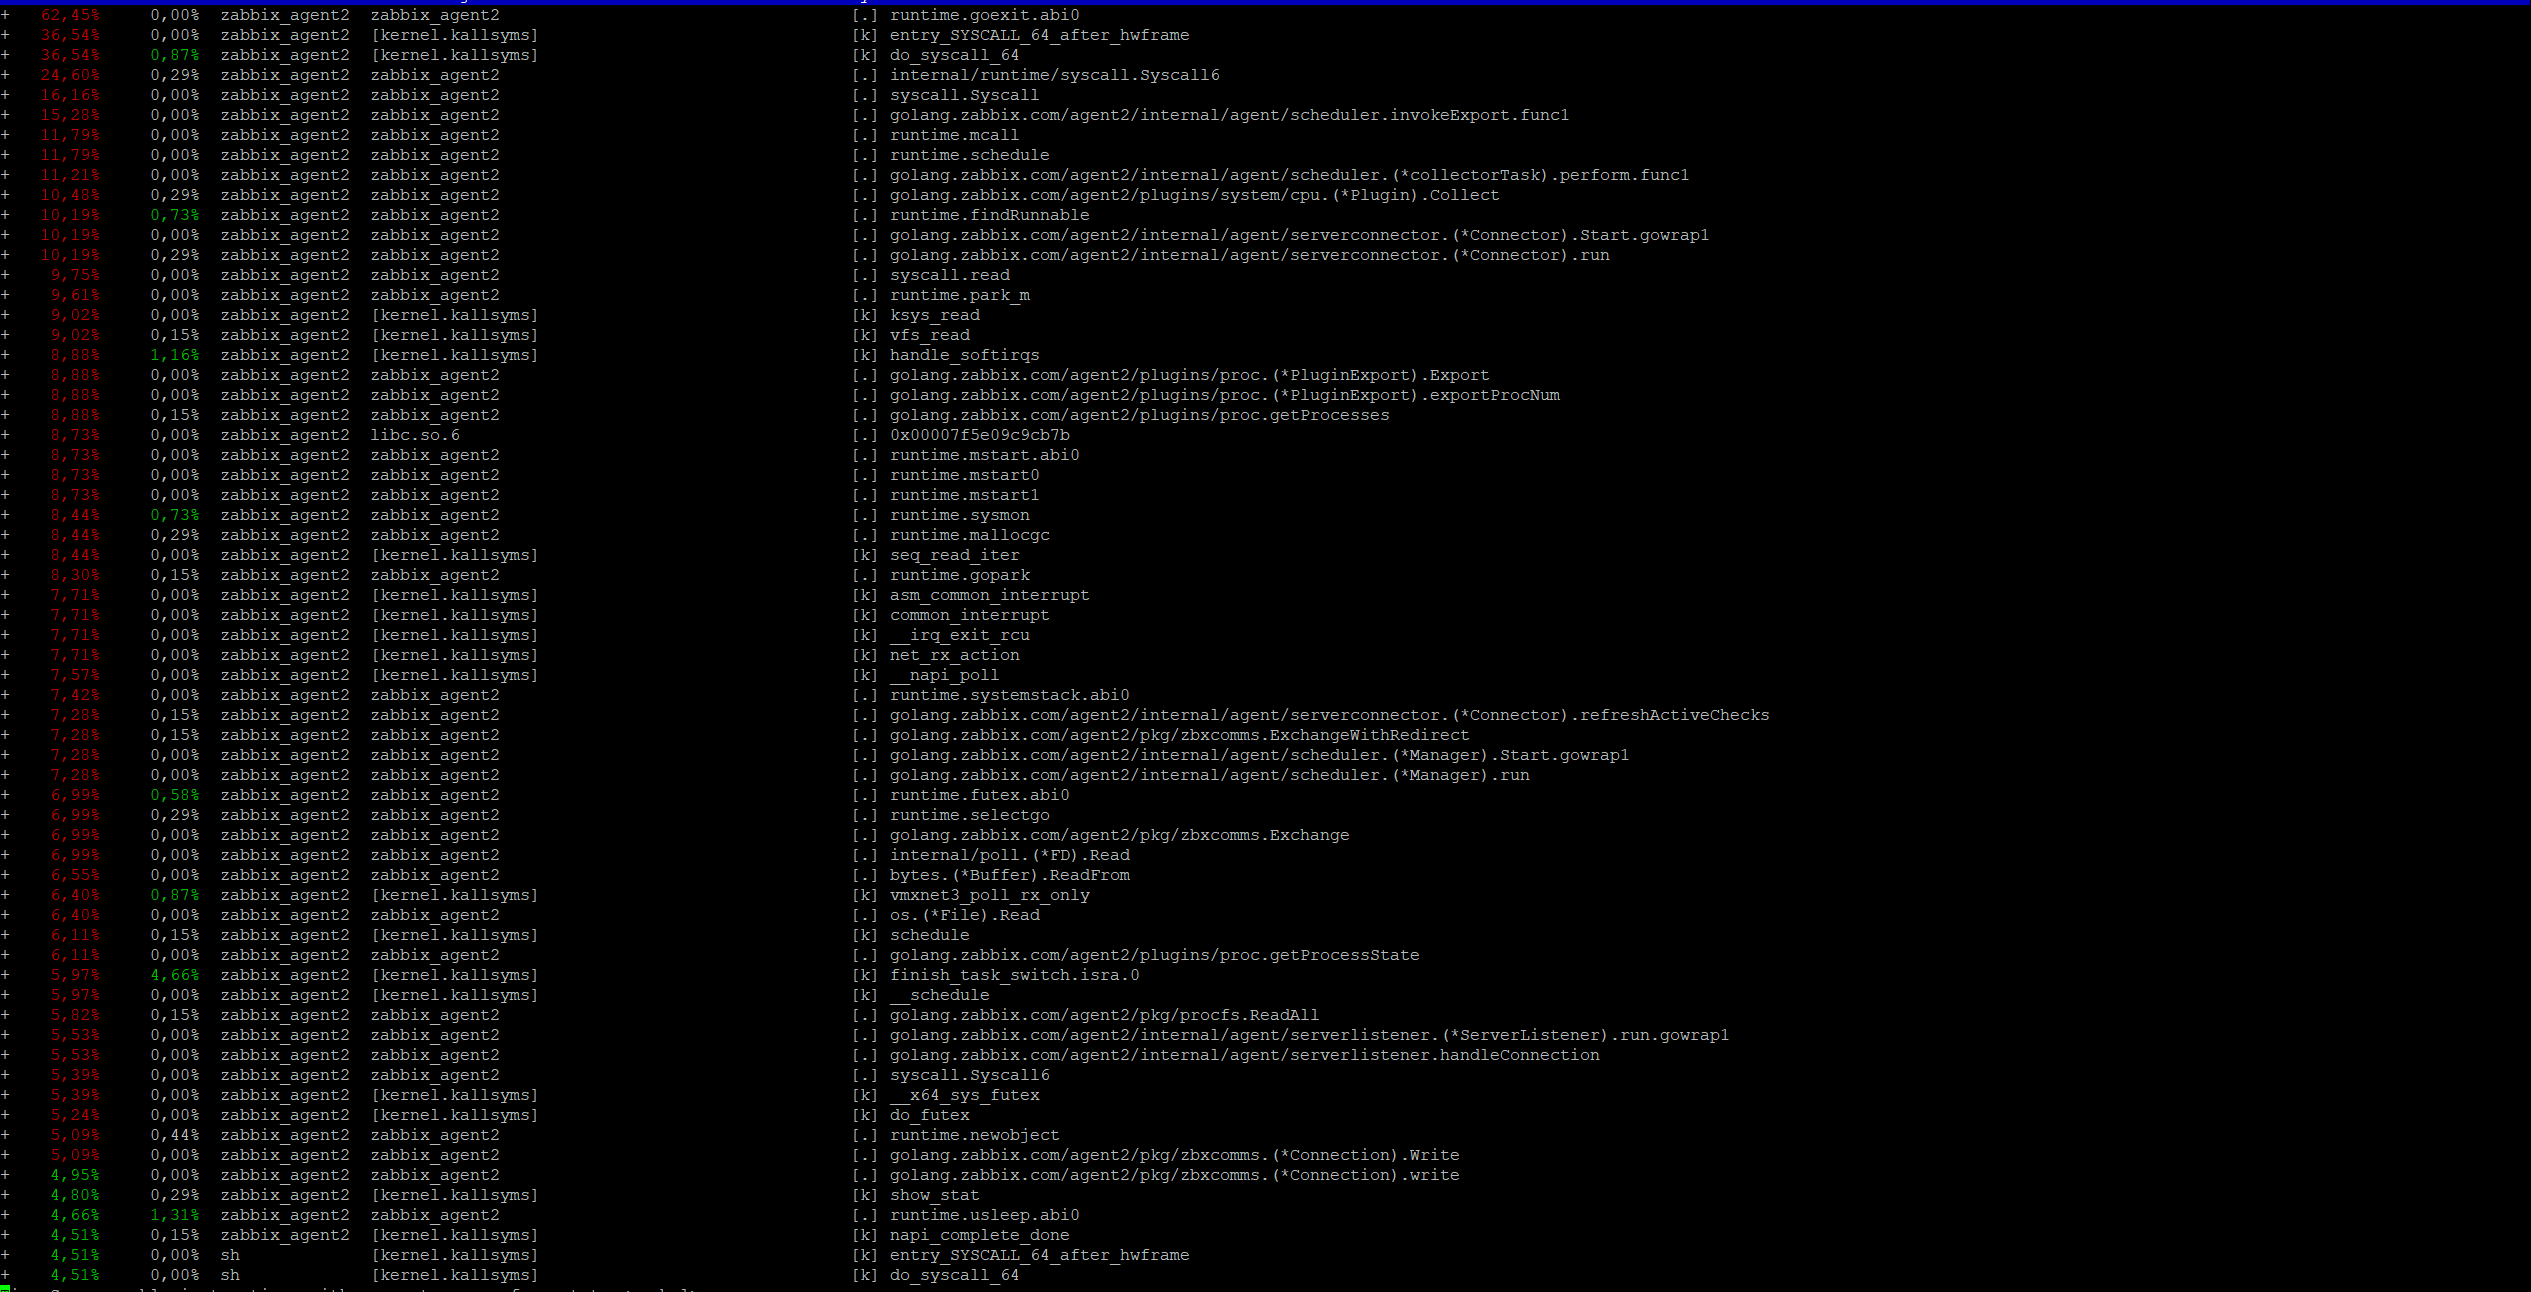
- Update — findings from live tracing (Agent 2 pegged at ~100% CPU on 7.0.20)
*Environment recap*
- Zabbix Agent 2: *7.0.20* (upgrade from 7.0.19 via APT)
- OS: Debian 12 (bookworm), x86_64
- Mode: active + passive
- Server port: 10051 (confirmed connections)
*Symptom*
- `zabbix_agent2` process holds ~100% of a CPU core continuously (seen in `top`).
- Restarting the service reproduces the issue within minutes.
*What we traced (strace on hot process / threads)*
- The traced thread shows frequent cycles of `epoll_pwait(..., timeout≈0/999ms)`, `futex(...WAIT/WAKE...)`, intermittent MySQL reads, and periodic sends to the Zabbix server socket:
```
read(9, "...information_schema...performance_schema...Innodb_checkpoint_max_age...", 4096) = 4096
write(10, "ZBXD\1
{...\"version\":\"7.0.20\"...}
", 18756) = 18756
connect(10,
{sin_port=htons(10051), sin_addr=...}
, ...) = EINPROGRESS
```
- Repeated `futex(..., FUTEX_WAIT_PRIVATE, ...)` with immediate `EAGAIN` bursts suggest a *busy scheduling/lock contention loop* in one or more threads.
- The agent is clearly *querying MySQL metadata* (`information_schema`, `performance_schema`) and then *sending relatively large payloads* (~18 KB) to the Zabbix server very frequently.
- We also observed `tgkill(..., SIGURG)` among threads (Go runtime async preemption signals), which aligns with a Go program under heavy scheduler pressure.
*Interpretation / hypothesis*
- CPU burn appears to be *in another agent thread* (the one we didn’t initially attach to) while the traced thread coordinates epoll/futex and MySQL I/O.
- The behavior points to a potential *regression or tight loop in Agent 2 (7.0.20)* related to:
- scheduling of *active checks*, and/or
- the *MySQL plugin* (continuous/over-frequent scraping of `performance_schema` / `information_schema`), and/or
- a *busy-wait / lock contention* path between worker and scheduler threads.
- The high frequency of connects/writes to the server and repeated MySQL reads suggests the agent may be *re-evaluating/refreshing items too aggressively* in 7.0.20.
*What we already tried*
- Restarting agent → issue returns.
- Switching to passive-only (commenting `ServerActive`) → CPU still spikes.
- Disabling custom user parameters → no change.
- Network is healthy (no retransmit/timeout loops observed).
*Next diagnostics we can attach on request*
- `journalctl -u zabbix-agent2 -b -n 1000`
- `top -H -p <PID>` / `pidstat -p <PID> -t 1` showing the exact *TID* burning CPU
- `strace -f -tt -s 200 -p <PID>` sample (already captured; includes the MySQL/epoll/futex activity above)
- `strace -c -p <hot TID>` syscall histogram
- `perf record -g -p <PID> – sleep 10` + `perf report` (to pinpoint hot symbols)
- Go runtime goroutine dump via `kill -QUIT <PID>` (if useful for Agent 2 maintainers)
*Impact*
- Continuous 100% core utilization by `zabbix_agent2`; unnecessary resource consumption and risk to check latency.
*Request*
- Can you confirm if there’s a *known issue* in *7.0.20* affecting active check scheduling and/or the *MySQL plugin* causing a busy loop?
- Any temporary *workarounds* you recommend (e.g., disabling specific MySQL items, adjusting agent2 plugin settings, or temporarily pinning to 7.0.19) until a fixed build is available?
- If you have a debug build or flags you want enabled, we’re happy to rerun with those and supply full traces.
*Representative strace snippets*
```
read(9, "...information_schema...performance_schema...Innodb_checkpoint_max_age...", 4096) = 4096
write(10, "ZBXD\001...
{\"version\":\"7.0.20\"...}
", 18756) = 18756
epoll_pwait(4, [
{events=EPOLLIN|EPOLLOUT, ...}
], 128, 999, NULL, 0) = 1
futex(0x..., FUTEX_WAIT_PRIVATE, 0, NULL) = -1 EAGAIN (Resource temporarily unavailable)
tgkill(441339, 441342, SIGURG) = 0
```
|
|
The issue appears when using Zabbix Agent 2 together with the “MySQL by Zabbix agent 2” template.
As a workaround, removing the template from the affected host brings CPU usage back to normal.
Environment (where the issue reproduces on both machines):
• mysql -V on server: mysql from 11.8.3-MariaDB, client 15.2 for debian-linux-gnu (x86_64) using EditLine wrapper
• mysql -V on RPI: mysql Ver 15.1 Distrib 10.11.14-MariaDB, for debian-linux-gnu (aarch64) using EditLine wrapper 
|
|
Another workaround confirmed — downgrade fixes the issue
Reverting Zabbix Agent 2 to 7.0.19 immediately resolves the high CPU problem.
Example command we used:
apt-get install zabbix-agent2=1:7.0.19-1+debian13
(The exact package suffix may vary by distro/architecture, e.g. …+debian12 or …arm64.)
After the downgrade, CPU usage returns to normal. We’ve put the package on hold to prevent re-upgrades.
|
|
How is the issue resolved? We cannot stay forever on 7.0.19 as a workaround. Someone needs to fix the bug for an upcoming version of the agent
|
|
Hi Frank Brandt!
I understand your confusion, and can tell you "Resolved" means:
The issue if found and fixed internally and is moving forward to be implemented in a release.
|
|
OK thanks for the info.
|
|
Just to confirm my understanding: the fix has been merged internally and is planned for Agent 2 v7.0.21.
Does that mean we’ll need to wait until late November 2025 for the public release?
|
|
This is a high priority issue so 7.0.21 will be released ahead of the usual schedule. ETA early next week.
|
|
Came here from the forums, this is also happening for v7.4.4 which I see is not mentioned - my Fedora Server started giving my Proxmox host some CPU stress after I upgraded from v7.4.3, so I downgraded.
|
|
Taomyn But they know about this issue in 7.4.x too look:
Fix Version/s: 7.0.21rc1, 7.4.5rc1, 8.0.0alpha1 (master)
|
|
Fixed in Zabbix agent 2
|
|
esneiders
I’ve just tested the fix on both *Debian 12* and *Debian 13* and unfortunately the problem is still present — the agent stays at 100% CPU.
Tested packages:
root@taken:~# dpkg -l | grep zabbix
ii  zabbix-agent2   1:7.0.21-1+debian13   amd64   Zabbix network monitoring solution - agent
ii  zabbix-release  1:7.0-2+debian13      all     Zabbix official repository configuration
Agent version:
root@taken:~# /usr/sbin/zabbix_agent2 -V
zabbix_agent2 (Zabbix) 7.0.21
Process list:
root@taken:~# ps aux | grep zabbix
zabbix  1837639 100.0  2.4 1921072 47852 ?  Ssl  12:26  2:52 /usr/sbin/zabbix_agent2 -c /etc/zabbix/zabbix_agent2.conf
So even with *7.0.21* installed from the official repo on Debian, the agent still consumes 100% CPU in our setup. It looks like the issue is not fully resolved yet.
|
|
Sorry guys, but the bug is still there but this time it has nothing to do with mysql..
I see a lot of
futex(0x164bc20, FUTEX_WAIT_PRIVATE, 0, NULL) = -1 EAGAIN (Resource temporarily unavailable)
I've attache our strace.. after ~17seconds the high load starts
strace_zabbix
|
|
Thanks for confirming this, shad0w — I was starting to worry it was something specific to my setup only. Good to see you’re seeing the same futex loop pattern.
|
|
Thank you for your input!
We will keep investigating.
shad0w based on the stack trace I see you do log monitoring, is there any additional information you could provide, if as you mention this is not connected to mysql?
TaKeN does the issue also persist for you regardless of mysql monitoring?
|
|
Yes esneiders, it still persists for me on the hosts where I monitor MySQL.
To be precise:
- on the hosts that had *MySQL monitoring enabled* and I upgraded from *7.0.19 → 7.0.21*, the high CPU problem is still there;
- on other hosts (same Zabbix setup) where I upgraded *7.0.20 → 7.0.21, the upgrade went fine and there is **no* CPU issue;
- just like before, rolling back the affected hosts to *7.0.19* immediately fixes the problem.
So it’s not happening everywhere — only on the machines that previously had the MySQL-related monitoring and were upgraded from 7.0.19.
|
|
esneiders sorry, I was on two servers at the same time..
it looks like mysql related, because on servers where we don't monitor mysql everything is fine, this CPU usage is only where we monitor mysql..
In our case it doesn't matter if we jump from 7.0.19 to .21 or from .20 to .21
|
|
*Observed behavior*
After upgrading to *Zabbix agent 2 7.0.21* the agent stays idle until the first *passive* MySQL check is requested by the server. At the moment the server sends a passive request for a MySQL item, the `zabbix_agent2` process jumps to *100% CPU* and stays there.
*Log excerpt from the agent*
2025/11/03 14:11:41.772059 received passive check request from "{\"request\":\"passive checks\",\"data\":[{\"key\":\"mysql.get_status_variables[\\\"tcp:,\\\"zabbix\\\",\\\"XXXXXXXXXXXXXXXXXXXXXXXXXXXX\\\"]\",\"timeout\":30}]}": "1.1.1.1"
2025/11/03 14:11:41.772545 [1] created direct exporter task for plugin 'Mysql' ...
2025/11/03 14:11:41.772594 plugin Mysql: executing configurator task
2025/11/03 14:11:41.772912 plugin Mysql: executing starter task
2025/11/03 14:11:41.773132 [Mysql] creating new connection for host: 127.0.0.1
2025/11/03 14:11:41.773157 [Mysql] Created new connection: 127.0.0.1:3306
Right *after* this MySQL plugin initialization the agent process goes to 100% CPU.
*Important notes*
- This happens on hosts that have the template *“MySQL by Zabbix agent 2”* linked.
- On other hosts (same Zabbix agent 2 version, but *without* MySQL monitoring) the upgrade to *7.0.21* succeeds and there is *no* CPU issue.
- Downgrading the agent back to *7.0.19* on the same host makes the problem disappear again.
*So in short*
- 7.0.21 + MySQL by Zabbix agent 2 → CPU 100% right after first passive MySQL item
- 7.0.21 on host without MySQL items → OK
- 7.0.19 on the same MySQL host → OK
This looks consistent with the recent changes in the MySQL plugin and connection manager.
debug.log
|
|
I've just upgraded to 7.4.5 and I'm still seeing this very high CPU usage.
Was the fix deployed to 7.4.5?
I've rolled this back to 7.4.3 to stop the CPU burn
|
|
7.4.5 without MySQL without problems, with MySQL the same problem occurs, I reverted to 7.4.3 without problems without and with MySQL, the problem only occurs in 7.4.4 and 7.4.5.
OS: Ubuntu, 22.04, 24.04 and 25.04
|
|
Unfortunately the issue persists with 7.0.21 on Rocky Linux 9.6
|
|
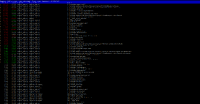
I tested 7.0.21 again and the high CPU is still there.
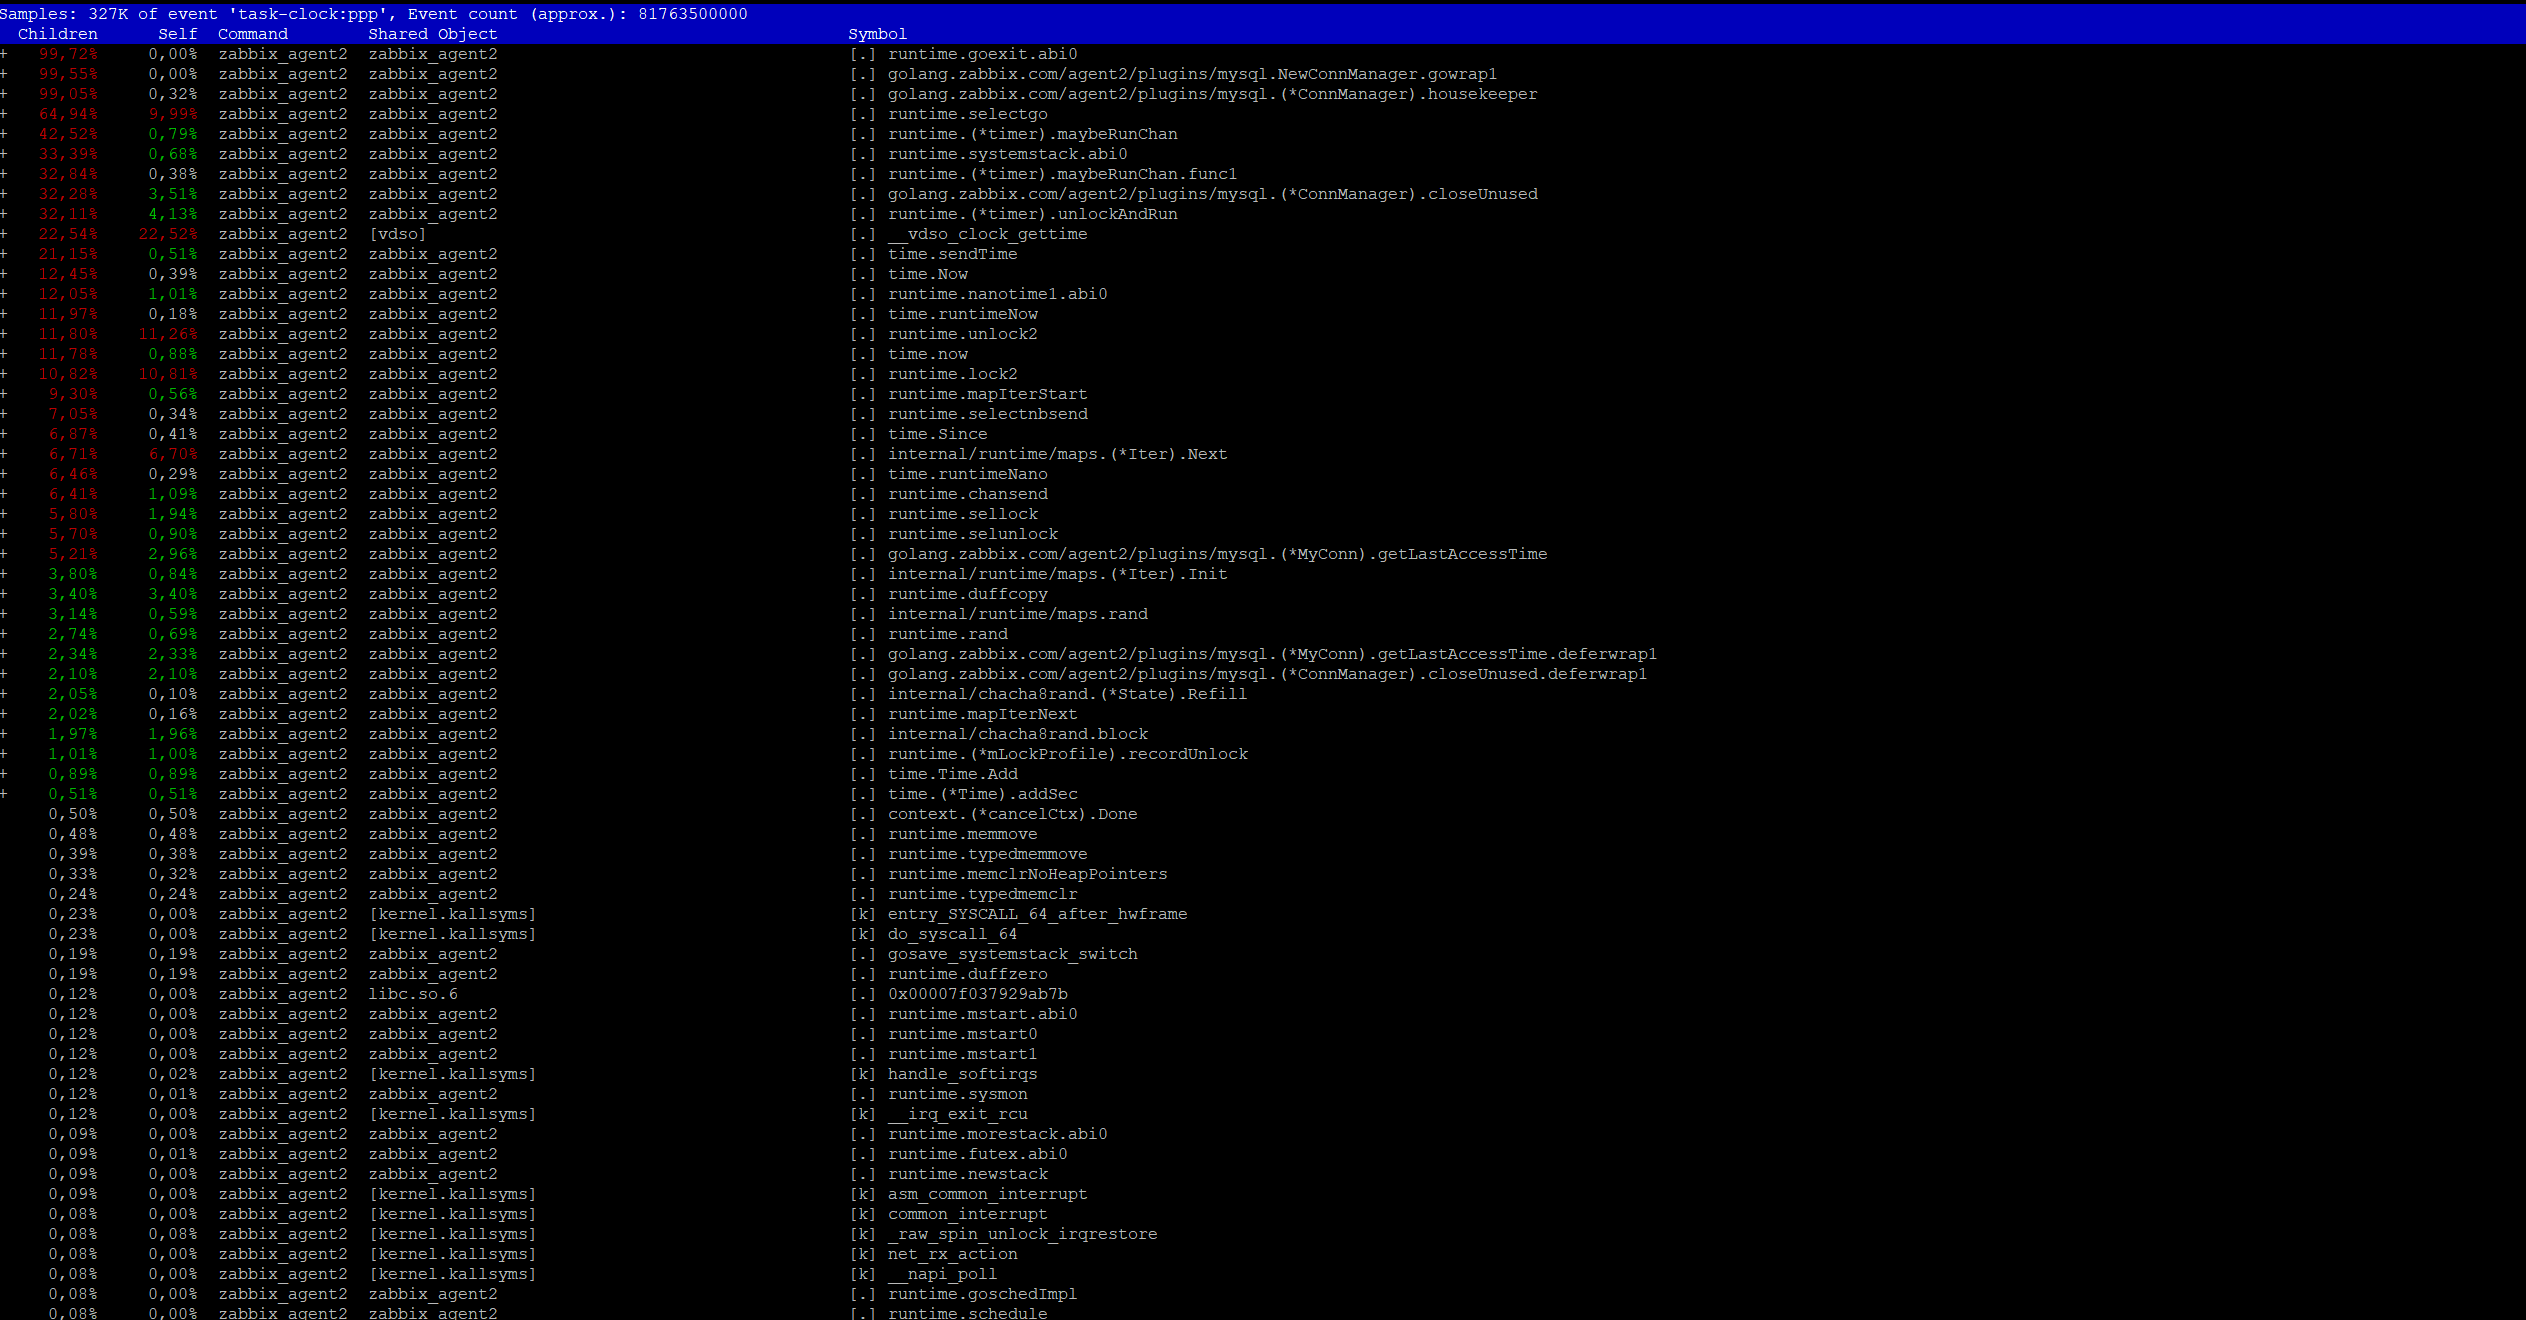
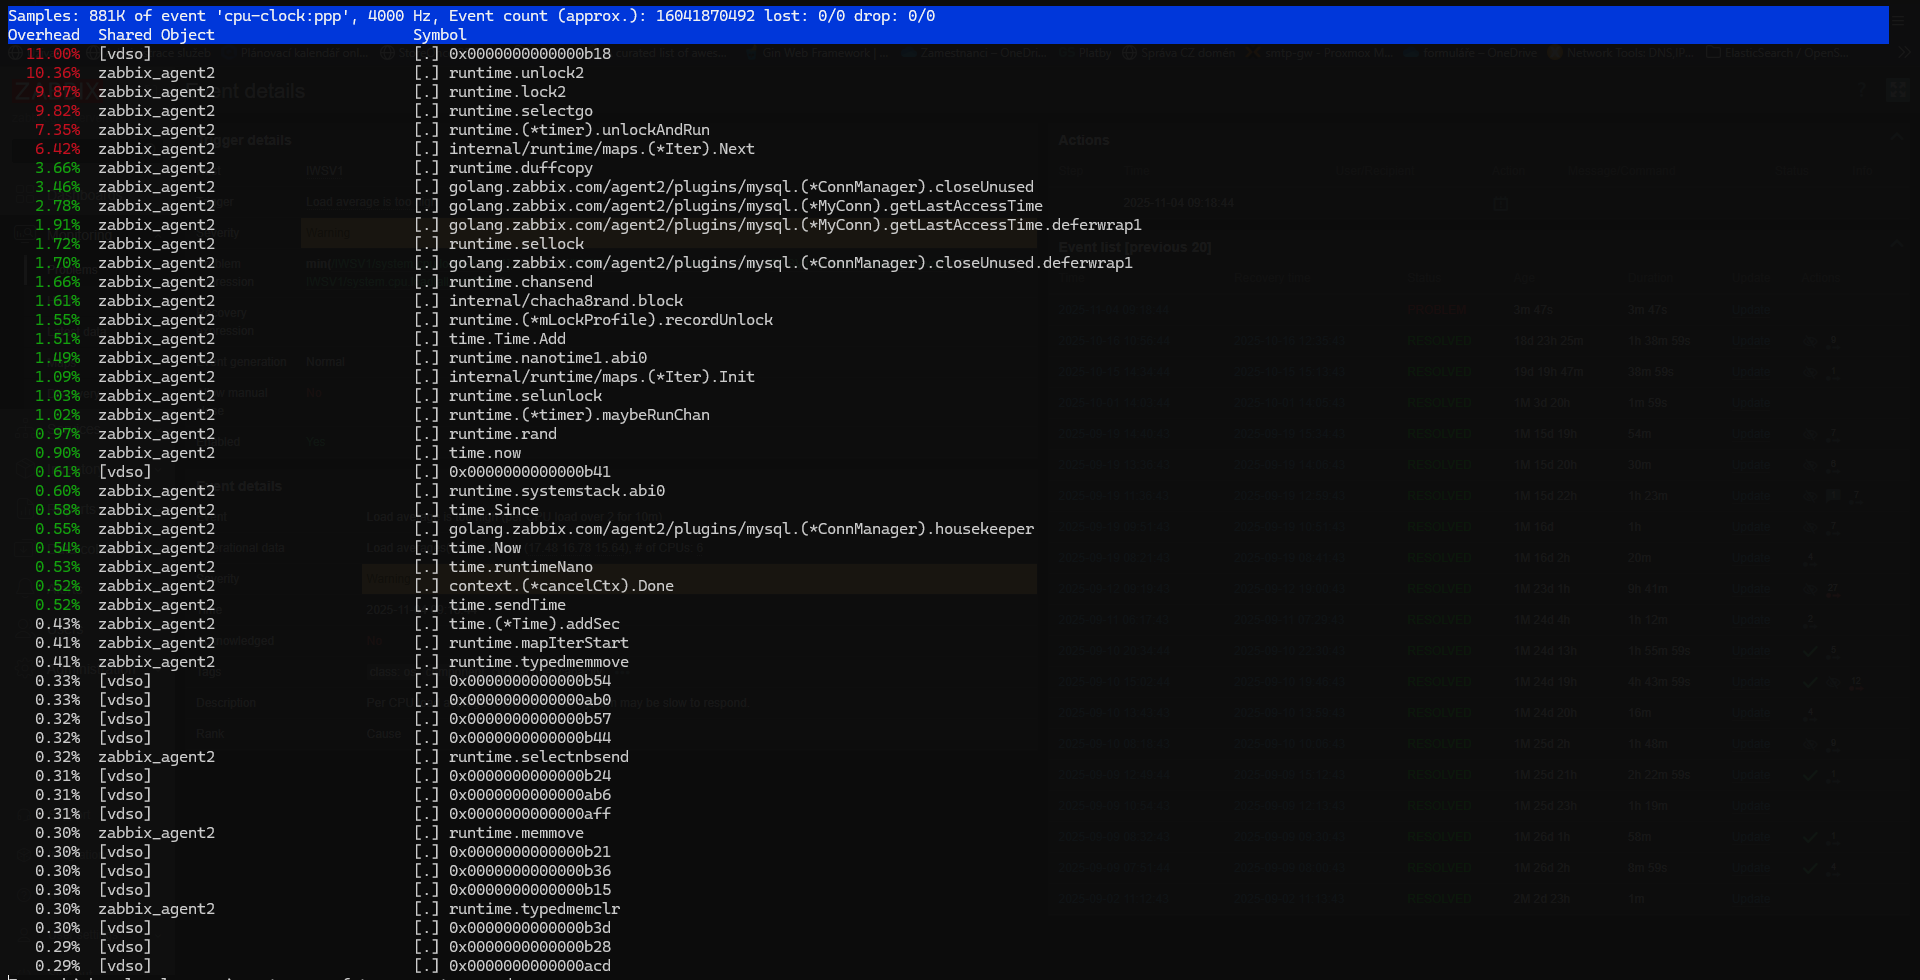
This time I profiled the agent with perf and it clearly shows that the CPU is burned inside the MySQL plugin housekeeping loop, not in the actual MySQL queries.
Top frames from perf report:
golang.zabbix.com/agent2/plugins/mysql.NewConnManager.gowrap1
golang.zabbix.com/agent2/plugins/mysql.(*ConnManager).housekeeper
golang.zabbix.com/agent2/plugins/mysql.(*ConnManager).closeUnused
a lot of time in Go timers / map iteration (runtime.selectgo, runtime.(*timer).maybeRunChan, etc.)
So the agent is basically spinning in the MySQL connection manager housekeeper goroutine and that’s what keeps one CPU at 100%.
It still happens only on the hosts where I monitor MySQL (when I remove the “MySQL by Zabbix agent 2” template or when I downgrade the agent back to 7.0.19, the problem goes away).
So it looks like the regression is in the MySQL plugin housekeeping logic introduced after 7.0.19, not in MySQL itself.
|
|
I retested with 7.0.19 and the high CPU disappears.
With 7.0.21 perf report shows that almost all CPU time is spent in:
golang.zabbix.com/agent2/plugins/mysql.(*ConnManager).housekeeper
golang.zabbix.com/agent2/plugins/mysql.(*ConnManager).closeUnused
so the agent is busy iterating over MySQL connections.
In 7.0.19 this goroutine is not on top at all – the agent only spends time on normal metric collection.
It looks like after the MySQL plugin changes (new connection key / TLS handling) the agent keeps creating many distinct connections and then the housekeeper loops over them every 10s.
Removing the “MySQL by Zabbix agent 2” template or downgrading to 7.0.19 fixes it.

|
|
I re-checked on my side and with 7.0.21 the CPU burn is happening inside the MySQL plugin’s connection housekeeper.
Details from `perf` (7.0.21):
- top frame: `golang.zabbix.com/agent2/plugins/mysql.(*ConnManager).housekeeper`
- called from: `golang.zabbix.com/agent2/plugins/mysql.NewConnManager.gowrap1`
- inside it spends time in `closeUnused()` iterating over all MySQL connections every 10 seconds
- a lot of time is spent in Go runtime map iteration and `time.Now`/`time.Since`, so it’s basically walking the whole connection map on every run
When I downgrade the same host (same MySQL, same template) to:
apt-get install zabbix-agent2=1:7.0.19-1+debian13
the problem disappears immediately and CPU goes back to normal.
So it looks like the new MySQL connection manager introduced in 7.0.20/7.0.21 creates/keeps more distinct connection entries, and the periodic cleanup (`housekeeper()`) becomes expensive and keeps the agent thread busy all the time.
In short:
- 7.0.19 → OK
- 7.0.21 + MySQL template → 100% CPU in `ConnManager.housekeeper`
- removing MySQL template or rolling back to 7.0.19 → OK again
Please check `src/go/plugins/mysql/conn.go` around `ConnManager.housekeeper()` / `closeUnused()` and how the connection key is constructed — it’s likely iterating over too many connections every 10 seconds.
|
|
Hello,
just upgraded from 7.0.19 to 7.0.21 and I can confirm we have this issue too in our environment on Rocky Linux 9.6
[root@zabbix-proxy-88 ~]# ps aux | grep zabbix_agent
zabbix   2504612 95.9  1.6 1696636 30680 ?       Ssl  10:09  24:35 /usr/sbin/zabbix_agent2 -c /etc/zabbix/zabbix_agent2.conf
Downgrading back to 7.0.19 helped
|
|
Hello!
New 7.0.21 and 7.4.5 versions with fixes were released today. (Fixed in 7.0.21-2, 7.4.5-2.)
|
|
Hello smaklakovs
Confirmed, thanks.
I’ve just upgraded to the new build and can confirm the fix works.
*Tested on:*
- Debian 12
- Debian 13
- Raspbian 12 (aarch64)
Packages now show e.g.:
zabbix-agent2 1:7.0.21-2+debian13
MySQL template is still attached to the host and the agent process no longer sticks at 100% CPU — it stays low and stable after several minutes of uptime.
So the issue is resolved for 7.0.21-2 on these systems.
|
|
yep resolved
|
|
Hello!
The new version 74.5-2 resolved the problem.
|
|
Also can confirm the new version 7.0.21-2 solved the problem in our RL9 environment.
|
|
Also confirmed - problem appears resolved in 7.4.5-2 (on Amazon Linux 2023)
|
|
Confirmed for Fedora 42 once the release2 version was available
|
|
7.0.21-2 confirmed to fix with rhel9 and mariadb 10.11.
|
Generated at Fri May 29 20:24:35 EEST 2026 using Jira 10.3.18#10030018-sha1:5642e4ad348b6c2a83ebdba689d04763a2393cab.
 debug.log
 image-2025-11-04-08-38-17-869.png
 strace_zabbix
 Team INT