[ZBX-27208] CPU utilization monitoring is different Created: 2025 Nov 07 Updated: 2025 Nov 11 Resolved: 2025 Nov 11 |
|
| Status: | Closed |
| Project: | ZABBIX BUGS AND ISSUES |
| Component/s: | Agent2 (G) |
| Affects Version/s: | 6.0.41 |
| Fix Version/s: | None |
| Type: | Problem report | Priority: | Trivial |
| Reporter: | Pablo Alejandro Barron Diaz | Assignee: | Unassigned |
| Resolution: | Commercial support required | Votes: | 0 |
| Labels: | None | ||
| Remaining Estimate: | Not Specified | ||
| Time Spent: | Not Specified | ||
| Original Estimate: | Not Specified | ||
| Environment: |
Zabbix 6.0.40 |
||
| Attachments: |
|
| Description |
|
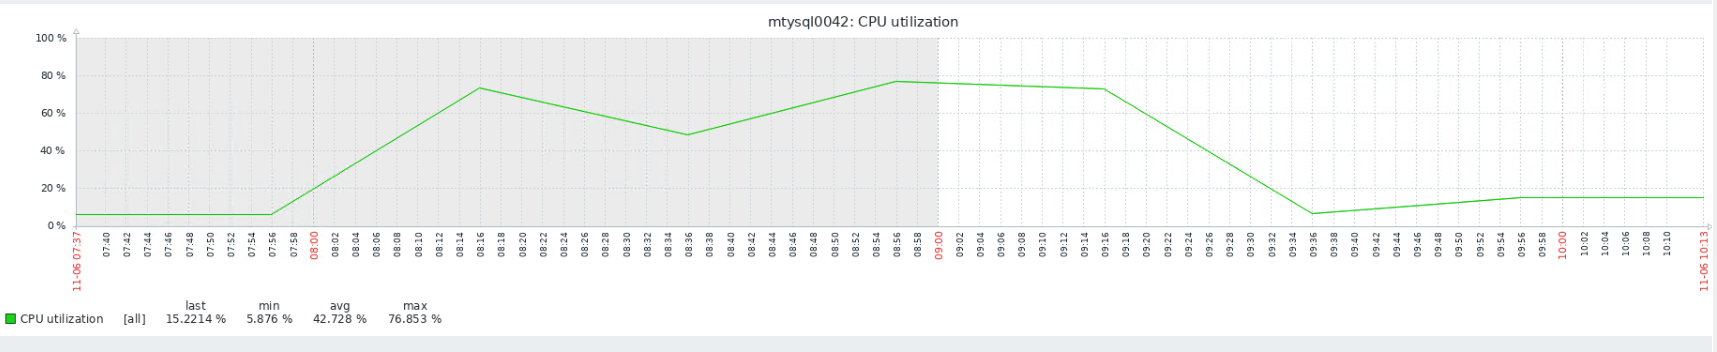
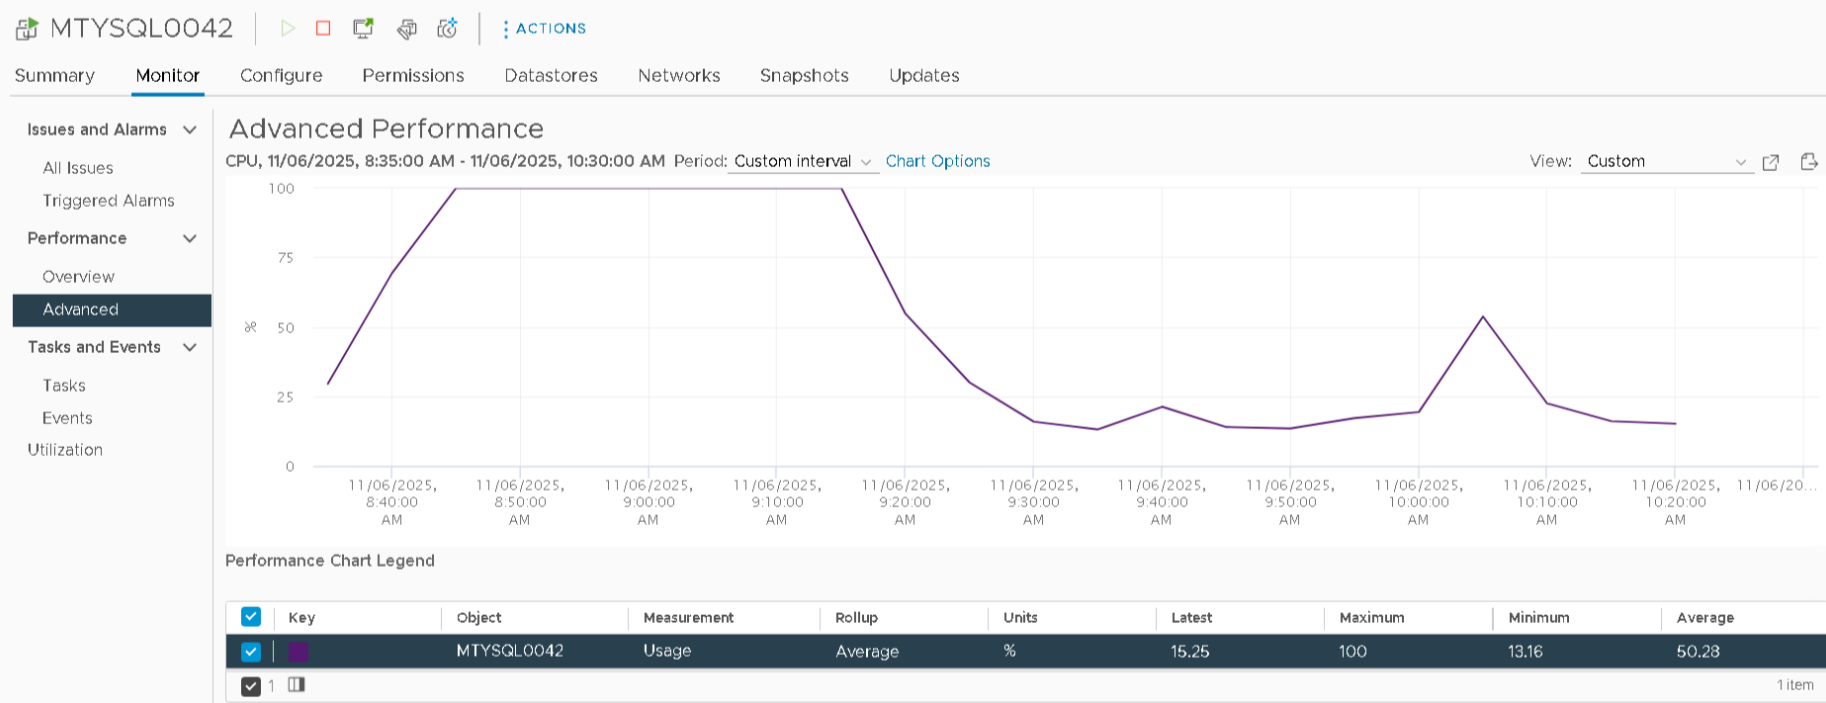
Hello team, I'm having a problem with my Zabbix. Today, a problem arose where the CPU usage of one machine was at 100%, as seen in the vCenter. However, when checking the CPU usage in the Zabbix tool, I see that the behavior and values are different. In vCenter, it was at 100% for about 35 minutes, but in Zabbix, I only see it reaching 76% CPU utilization. Why are the CPU values different? Shouldn't they be the same? How can I make the values and behavior consistent? Could you help me? Thanks!
|
| Comments |
| Comment by Alexey Pustovalov [ 2025 Nov 10 ] |
|
Hello! What item key do you use for CPU utilization on Zabbix side? |
| Comment by Pablo Alejandro Barron Diaz [ 2025 Nov 10 ] |
|
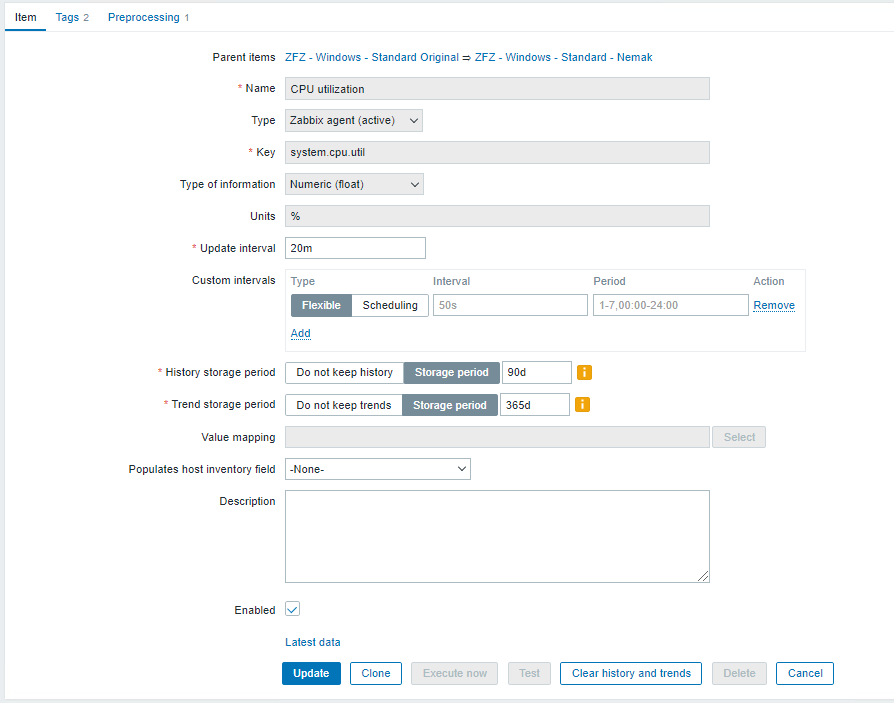
Hi Alexey I share you the item configuration:
Regards! |
| Comment by Alexey Pustovalov [ 2025 Nov 11 ] |
|
Item key system.cpu.util is information from OS, with update interval 20 minutes... While VMware information can be completely different. I recommend you to monitor VCenter using standard Zabbix templates for VMware. Anyway, Zabbix 6.0 currently has limited support only. |