|
Duplicate |
[ZBX-4195] Windows zabbix_agentd Working Set size steadily growing on Windows Server 2008 64-bit boxes Created: 2011 Oct 03 Updated: 2017 May 30 Resolved: 2012 Mar 30 |
|
| Status: | Closed |
| Project: | ZABBIX BUGS AND ISSUES |
| Component/s: | Agent (G) |
| Affects Version/s: | 1.8.8 |
| Fix Version/s: | 1.8.12rc1, 2.0.0rc3 |
| Type: | Incident report | Priority: | Blocker |
| Reporter: | Kam Lane | Assignee: | Unassigned |
| Resolution: | Fixed | Votes: | 0 |
| Labels: | agent, memoryleak, windows | ||
| Remaining Estimate: | Not Specified | ||
| Time Spent: | Not Specified | ||
| Original Estimate: | Not Specified | ||
| Environment: |
Windows Server 2008 64-bit |
||
| Attachments: |
|
||||
| Issue Links: |
|
||||
| Description |
|
I'm noticing the working set size for the zabbix_agentd windows process grow and not garbage collect/cleanup. I started running the agent on all these boxes on 2011.09.30. Here is the 4-day weekend view. I am doing a lot of active checks calling perf_counters. I've been building a new windows template to share but am still trying to get a few things to add up before I do. Also note that the "Template_Windows" which is listed as a template in my selected group was pulled into the graph...is it supposed to do that? 'Scale' & 'Average by' are both set to 'Daily' for the graph. |
| Comments |
| Comment by richlv [ 2011 Oct 03 ] |
|
template included in a bar report seems to be a bug, could you please create a new ZBX report ? |
| Comment by Kam Lane [ 2011 Oct 03 ] |
|
Are you referring to a new ZBX screenshot report for this issue or new ZBX bug report? |
| Comment by Kam Lane [ 2011 Oct 04 ] |
|
Something else I noticed is of the hosts in the screenshot above, the ones that have a larger memory footprint are actually the hosts that have 12 unsupported active performance checks a piece for where the template is looking for a drive [D:] that doesn't exist. |
| Comment by Kam Lane [ 2011 Oct 04 ] |
|
I opened |
| Comment by Kam Lane [ 2011 Nov 07 ] |
|
You can see where I've restarted the agent everyday of the business week, but on the weekend the process runs away. This attached screenshot is for a 32-bit Windows Server 2003 host. The memory leak appears to be more evident on this host than the 2008 hosts. |
| Comment by Kam Lane [ 2011 Nov 07 ] |
|
This is my default Windows Template that works across all windows hosts from xp to 2008. |
| Comment by Kam Lane [ 2011 Nov 07 ] |
|
This is the add-on template for Windows Server 2008 hosts that links to Template_Windows_Server.zbx.xml |
| Comment by Kam Lane [ 2011 Nov 07 ] |
|
This is the default "Include=" for all windows hosts in my main configuration file. |
| Comment by Kam Lane [ 2011 Nov 07 ] |
|
This is only included on windows server 2008 hosts where the 2008 template is linked. |
| Comment by Kam Lane [ 2011 Nov 07 ] |
|
I thought attaching these might make tracking down this leak easier. They're also pretty detailed as far as the statistics they pull, so the rest of the community may benefit from them. I dumped the `typeperf -qx` of a bunch of different hosts and cross-referenced them via joins in a mysql table to generate the "common" Template_Windows_Server. |
| Comment by Kam Lane [ 2011 Nov 07 ] |
|
My suspicion is the leak has something to do with de-referencing of the non-existent checks for example on a host that has no D drive: "Active check [perf.logicaldisk._D.counter[avg_disk_queue_length]] is not supported. Disabled." |
| Comment by Oleksii Zagorskyi [ 2012 Jan 31 ] |
|
I have maybe similar memleak in the agent v1.9.8 r23548 on the WinXP32 32bit. After restarting agent, rebooting host, changing DebugLevel from 4 to 3 the memleak still reproducible. Speed of memory eating - 0,6MB/hours and and noticeable immediately after the agent start. In the same time v1.9.8 r23548 works on 4 hosts Server2003 32bit without any problems. <zalex> Note: at the Server2003 hosts above only present perf counters are monitored. This explains next my comment. |
| Comment by Oleksii Zagorskyi [ 2012 Feb 02 ] |
|
Huh, problem reproduced. Tested two available revisions of zabbix_agentd from 1.8 SVN branch - 19048 and 19318 ( Note that before implementing Count of missing monitored counters has direct impact on memleak speed ! Additionally you can see at "agent1.9.8_memleak4.png". I hope all is clear. |
| Comment by Kam Lane [ 2012 Feb 02 ] |
|
I also see the memory leak with 32-bit boxes, it just consumes at a slower rate. As a workaround, I've created a scheduled job/task that executes the following batch script everyday at noon to restart the agent and reduce the working set size: @echo off IF /I "%PROCESSOR_ARCHITECTURE%"=="x86" GOTO WIN32 :WIN32 :WIN64 |
| Comment by Oleksii Zagorskyi [ 2012 Feb 03 ] |
|
I have important additions: Note second item key parameter: 60 second (avg value calculated at the zabbix agent side) I've just tested these keys without 2nd parameter - and I do NOT see memory leaks. I decided to perform clear experiment. So seems, memory continue leaking even WITHOUT requests from the zabbix server. Here is corresponding part of the windows zabbix_agentd.log (r19318): |
| Comment by Oleksii Zagorskyi [ 2012 Feb 06 ] |
|
As additional proof see attached "agent_memleak_with_pause_r19318.png" |
| Comment by dimir [ 2012 Mar 28 ] |
|
So this is not reproducible in trunk? <zalex> hmm, why do you think so? |
| Comment by Alexander Vladishev [ 2012 Mar 30 ] |
|
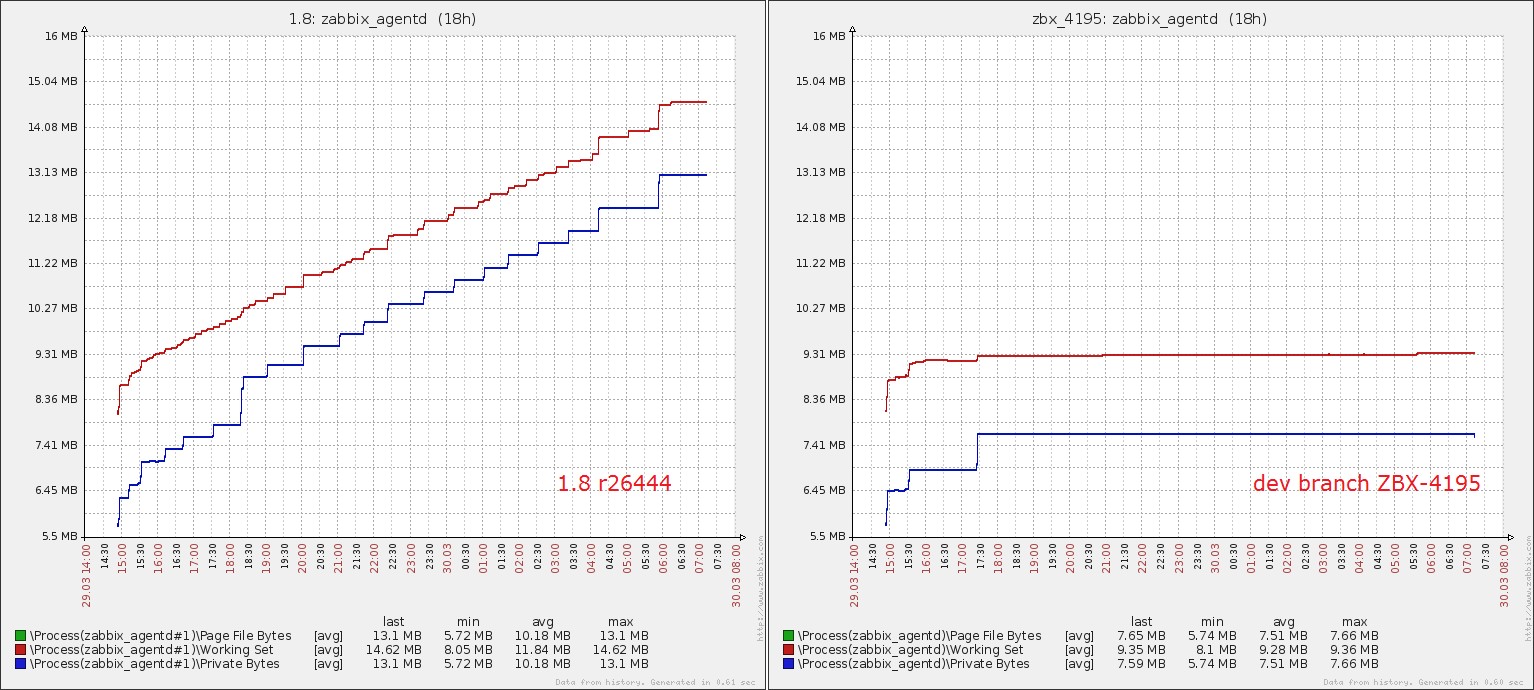
Fixed in the development branch svn://svn.zabbix.com/branches/dev/ZBX-4195 Test results: https://support.zabbix.com/secure/attachment/18486/after_fix.jpg <zalex> Thanks, I'll retest it too, just to give additional confirmation. |
| Comment by dimir [ 2012 Apr 03 ] |
|
Successfully tested. |
| Comment by Alexander Vladishev [ 2012 Apr 03 ] |
|
Fixed in version pre-1.8.12 r26593 and pre-2.0.0rc3 r26594. |