|
Duplicate |
[ZBX-6531] Possibly a memory leak in zabbix_agentd on AIX Created: 2013 Apr 19 Updated: 2017 May 30 Resolved: 2014 May 29 |
|
| Status: | Closed |
| Project: | ZABBIX BUGS AND ISSUES |
| Component/s: | Agent (G) |
| Affects Version/s: | 2.0.4 |
| Fix Version/s: | 2.0.13rc1, 2.2.4rc1, 2.3.1 |
| Type: | Incident report | Priority: | Minor |
| Reporter: | Marc | Assignee: | Unassigned |
| Resolution: | Fixed | Votes: | 0 |
| Labels: | aix, memoryleak | ||
| Remaining Estimate: | Not Specified | ||
| Time Spent: | Not Specified | ||
| Original Estimate: | Not Specified | ||
| Environment: |
AIX 6.1.0.0, Zabbix-Server/-Proxy 2.0.5, Zabbix-Agent 2.0.4 |
||
| Attachments: |
|
||||
| Issue Links: |
|
||||
| Description |
|
There is possibly a (very small) memory leak in zabbix_agentd. |
| Comments |
| Comment by Marc [ 2013 Apr 19 ] | ||||||||||||||||||||||||||||||||||||||||||||||||||||||||||||||||||||||||||||||
|
I've failed to mention that every line represents an Agent on a dedicated AIX server. | ||||||||||||||||||||||||||||||||||||||||||||||||||||||||||||||||||||||||||||||
| Comment by Marc [ 2013 Apr 30 ] | ||||||||||||||||||||||||||||||||||||||||||||||||||||||||||||||||||||||||||||||
|
After updating the agent to 2.0.6 the memory consumption appears to be constant. At least for one AIX server. | ||||||||||||||||||||||||||||||||||||||||||||||||||||||||||||||||||||||||||||||
| Comment by Marc [ 2013 May 07 ] | ||||||||||||||||||||||||||||||||||||||||||||||||||||||||||||||||||||||||||||||
|
Issue still exists in 2.0.6. BTW: | ||||||||||||||||||||||||||||||||||||||||||||||||||||||||||||||||||||||||||||||
| Comment by Oleg Ivanivskyi [ 2014 May 27 ] | ||||||||||||||||||||||||||||||||||||||||||||||||||||||||||||||||||||||||||||||
|
How to about try to reproduce this issue with a latest Zabbix agent versions (2.0.12 and 2.2.3)? | ||||||||||||||||||||||||||||||||||||||||||||||||||||||||||||||||||||||||||||||
| Comment by Marc [ 2014 May 28 ] | ||||||||||||||||||||||||||||||||||||||||||||||||||||||||||||||||||||||||||||||
|
I do. For now I attached another graph for several hosts running 2.2.0 agents. | ||||||||||||||||||||||||||||||||||||||||||||||||||||||||||||||||||||||||||||||
| Comment by Oleg Ivanivskyi [ 2014 May 28 ] | ||||||||||||||||||||||||||||||||||||||||||||||||||||||||||||||||||||||||||||||
|
Thank you for your help. We have | ||||||||||||||||||||||||||||||||||||||||||||||||||||||||||||||||||||||||||||||
| Comment by Marc [ 2014 May 28 ] | ||||||||||||||||||||||||||||||||||||||||||||||||||||||||||||||||||||||||||||||
|
Right after my previous comment I upgraded the hosts seen in the last uploaded graph to 2.2.3.
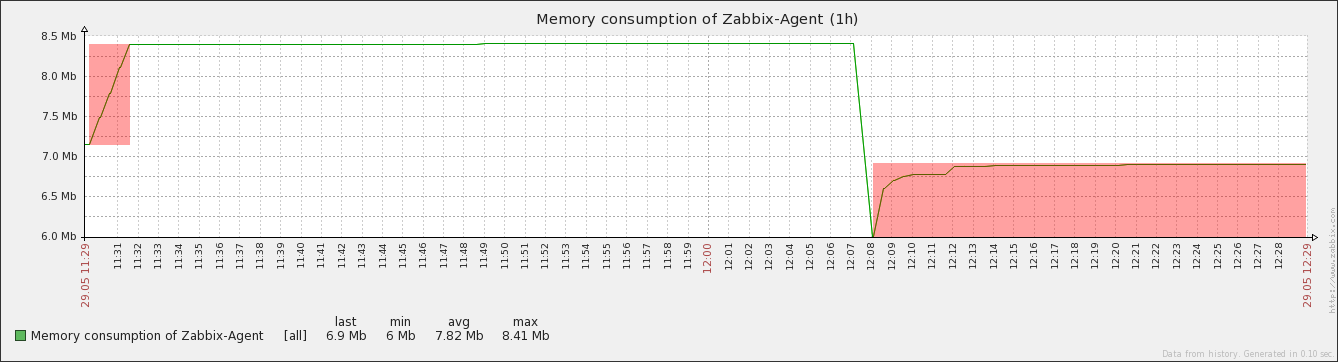
Edit: Memory utilization with 2.2.3 agent measured every second:
| ||||||||||||||||||||||||||||||||||||||||||||||||||||||||||||||||||||||||||||||
| Comment by Juris Miščenko (Inactive) [ 2014 May 29 ] | ||||||||||||||||||||||||||||||||||||||||||||||||||||||||||||||||||||||||||||||
|
Fix for 2.0 implemented in svn://svn.zabbix.com/branches/dev/ZBX-6531 | ||||||||||||||||||||||||||||||||||||||||||||||||||||||||||||||||||||||||||||||
| Comment by Marc [ 2014 May 29 ] | ||||||||||||||||||||||||||||||||||||||||||||||||||||||||||||||||||||||||||||||
|
File system discovery is set to every second in colorized areas.
| ||||||||||||||||||||||||||||||||||||||||||||||||||||||||||||||||||||||||||||||
| Comment by Juris Miščenko (Inactive) [ 2014 May 29 ] | ||||||||||||||||||||||||||||||||||||||||||||||||||||||||||||||||||||||||||||||
|
Fixed merged in 2.0.13rc1 r46035, 2.2.4rc1 r46036, 2.3.1 (trunk) r460357 |