|
First of all some excerpts from RFC3414:
2.2. Replay Protection
Each SNMP engine maintains three objects:
- snmpEngineID, which (at least within an administrative domain)
uniquely and unambiguously identifies an SNMP engine.
- snmpEngineBoots, which is a count of the number of times the SNMP
engine has re-booted/re-initialized since snmpEngineID was last
configured; and,
- snmpEngineTime, which is the number of seconds since the
snmpEngineBoots counter was last incremented.
Each SNMP engine is always authoritative with respect to these
objects in its own SNMP entity. It is the responsibility of a non-
authoritative SNMP engine to synchronize with the authoritative SNMP
engine, as appropriate.
An authoritative SNMP engine is required to maintain the values of
its snmpEngineID and snmpEngineBoots in non-volatile storage.
...
2.2.2. msgAuthoritativeEngineBoots and msgAuthoritativeEngineTime
The msgAuthoritativeEngineBoots and msgAuthoritativeEngineTime values
contained in an authenticated message are used to defeat attacks in
which messages are replayed when they are no longer valid. They
represent the snmpEngineBoots and snmpEngineTime values at the
authoritative SNMP engine involved in the exchange of the message.
Through use of snmpEngineBoots and snmpEngineTime, there is no
requirement for an SNMP engine to have a non-volatile clock which
ticks (i.e., increases with the passage of time) even when the
SNMP engine is powered off. Rather, each time an SNMP engine
re-boots, it retrieves, increments, and then stores snmpEngineBoots
in non-volatile storage, and resets snmpEngineTime to zero.
When an SNMP engine is first installed, it sets its local values of
snmpEngineBoots and snmpEngineTime to zero. If snmpEngineTime ever
reaches its maximum value (2147483647), then snmpEngineBoots is
incremented as if the SNMP engine has re-booted and snmpEngineTime is
reset to zero and starts incrementing again.
3.2. Processing an Incoming SNMP Message
This section describes the procedure followed by an SNMP engine
whenever it receives a message containing a management operation on
behalf of a user, with a particular securityLevel.
...
7) If the securityLevel indicates an authenticated message, then the
local values of snmpEngineBoots, snmpEngineTime and
latestReceivedEngineTime corresponding to the value of the
msgAuthoritativeEngineID field are extracted from the Local
Configuration Datastore.
a) If the extracted value of msgAuthoritativeEngineID is the same
as the value of snmpEngineID of the processing SNMP engine
(meaning this is the authoritative SNMP engine), then if any
of the following conditions is true, then the message is
considered to be outside of the Time Window:
- the local value of snmpEngineBoots is 2147483647;
- the value of the msgAuthoritativeEngineBoots field differs
from the local value of snmpEngineBoots; or,
- the value of the msgAuthoritativeEngineTime field differs
from the local notion of snmpEngineTime by more than +/- 150
seconds.
If the message is considered to be outside of the Time Window
then the usmStatsNotInTimeWindows counter is incremented and
an error indication (notInTimeWindow) together with the OID,
the value of the incremented counter, and an indication that
the error must be reported with a securityLevel of authNoPriv,
is returned to the calling module
b) If the extracted value of msgAuthoritativeEngineID is not the
same as the value snmpEngineID of the processing SNMP engine
(meaning this is not the authoritative SNMP engine), then:
1) if at least one of the following conditions is true:
- the extracted value of the msgAuthoritativeEngineBoots
field is greater than the local notion of the value of
snmpEngineBoots; or,
- the extracted value of the msgAuthoritativeEngineBoots
field is equal to the local notion of the value of
snmpEngineBoots, and the extracted value of
msgAuthoritativeEngineTime field is greater than the
value of latestReceivedEngineTime,
then the LCD entry corresponding to the extracted value of
the msgAuthoritativeEngineID field is updated, by setting:
- the local notion of the value of snmpEngineBoots to the
value of the msgAuthoritativeEngineBoots field,
- the local notion of the value of snmpEngineTime to the
value of the msgAuthoritativeEngineTime field, and
- the latestReceivedEngineTime to the value of the value of
the msgAuthoritativeEngineTime field.
2) if any of the following conditions is true, then the
message is considered to be outside of the Time Window:
- the local notion of the value of snmpEngineBoots is
2147483647;
- the value of the msgAuthoritativeEngineBoots field is
less than the local notion of the value of
snmpEngineBoots; or,
- the value of the msgAuthoritativeEngineBoots field is
equal to the local notion of the value of snmpEngineBoots
and the value of the msgAuthoritativeEngineTime field is
more than 150 seconds less than the local notion of the
value of snmpEngineTime.
If the message is considered to be outside of the Time
Window then an error indication (notInTimeWindow) is
returned to the calling module.
Note that this means that a too old (possibly replayed)
message has been detected and is deemed unauthentic.
Note that this procedure allows for the value of
msgAuthoritativeEngineBoots in the message to be greater
than the local notion of the value of snmpEngineBoots to
allow for received messages to be accepted as authentic
when received from an authoritative SNMP engine that has
re-booted since the receiving SNMP engine last
(re-)synchronized.
We can split the "usmStatsNotInTimeWindows" case to two possible reasons:
a) there indeed are monitored snmpV3 devices which have identical msgAuthoritativeEngineID
b) some of devices have incorrect behavior and don't follow RFC3414. For example I know device which always use engineBoot=1, even after reboot.
If consider both cases we can see that actually devices (agent) do respond to zabbix (manager) w/o delays with report "SNMP-USER-BASED-SM-MIB::usmStatsNotInTimeWindows.0 (1.3.6.1.6.3.15.1.1.2.0)", but zabbix after its Timeout threads it as a network error.
Main point in my complain is that the device is ALIVE actually, but server shows it is NOT.
And this misleads end users a lot!
I believe it should be reviewed.
Usually this report returned with authNoPriv level (as defined by the RFC3414) so these packets can bee seen in Wiresharc w/o decryption (confirmed for net-snmp daemon).
(Although my D-link switch I have returns it as AuthPriv, so these reports not visible w/o decryption.)
Here is example of a device (case b)):
Snmp-session (SNMP Enterprise OID .1.3.6.1.4.1.2396):
Corresponding log line (server with Timeout=30):
Here I want to explain one thing which were not discussed at all (or just was mentioned briefly - in asaveljevs' quote in ZBXNEXT-1789).
Fact is that Zabbix uses libnetsnmp and zabbix is daemon, so everything what libnetsnmp keeps in its internal in-RAM cache - we can say "it being reused" by zabbix.
Zabbix server|proxy is a multi-process application. Every poller|unreachable_poller|and_some_other_process_type when starts - it loads libnetsnmp. To make sure try for example add two parameters doDebugging 1, debugTokens lcd to /etc/snmp/snmp.conf and restart zabbix server - you will see how many blocks of STDERR lines - how many times the library loaded by zabbix processes.
Every such process keeps its own libsnmp's in-RAM cache.What we want to consider is "etimelist" (see ldc_time.c)
Its structure is:
    typedef struct enginetime_struct {
        u_char         *engineID;
        u_int           engineID_len;

        u_int           engineTime;
        u_int           engineBoot;
        /*
         * Time & boots values received from last authenticated
         * *   message within the previous time window.
         */

        time_t          lastReceivedEngineTime;
        /*
         * Timestamp made when engineTime/engineBoots was last
         * *   updated.  Measured in seconds.
         */
I checked it many times and with different ways and I'm sure that every zabbix process keeps its own independent sample of "etimelist" structure.
And it's persistent and reused until zabbix daemon will be restarted!
What it means - for example one/several zabbix poller successfully monitored a snmp device. Such process already keeps device's values of engineID, engineBoot, engineTime.
At this point the device is rebooted (this device has behavior described in my b) case) and its engineTime reset to zero 0, and engineBoot stayed the same =1.
According to the RFC zabbix (as a manager) will ignore device's engineTime because engineBoot was not increased by 1, and zabbix will keep to use its engineBoot, engineTime from "etimelist" cache (recalculated with time shift after last pool, as it should). Of course the device (agent) will respond with "usmStatsNotInTimeWindows" report.
In general the same picture will be if we add to zabbix another snmp device with the same engineID. But here possible two variants:
- if added device has engineBoot bigger that existing device, then stored engineID in "etimelist" structure will be updated with new engineBoot, engineTime. After that new device will continue to work, but previously existing device will start to fail.
- if added device has engineBoot less that existing device this added device will start to fail from very beginning.
And ... at this point unreachable_pollers will come into play 
And as they did not pool the failed device previously, their "etimelist" cache is empty, and they will "learn" by suggested (working) engineBoot, engineTime and will successfully receive a value from OID.
As result in zabbix log we can seen endless flapped events:
"SNMP agent item ... failed: first network error",
"resuming SNMP agent checks ... connection restored"
generated by poller and unreachable_poller respectively.
Imagine that items pooling is distributed between all available pollers|unreachable_pollers randomly - and it becomes even more unpredictable.
This issue in not possible to reproduce using single snmpget command, because every time when we run the command, it creates its own similar cache and populates it by correct engineBoot, engineTime values, initially received from snmp device. This cache is destroyed after the command is finished.
Here is two debug lines of two different snmp checks:
added: see my comment dated 2015 Jan 16 01:24 for such lines in recent zabbix versions.
We see that zabbix definitely sees some difference in "status", which is taken from libsnmp.
What I suggest - zabbix should differentiate such cases and do not thread device result pooling as NETWORK_ERROR if there were report packets from it.
Zabbix should print more info into log and mark an item as not supported instead of mark a host as unreachable.
What should be printed in to log: engineID, engineBoot, engineTime and OID from "report". If MIBs used then will be good if OID from "report" will be in textual form "Object Name: 1.3.6.1.6.3.15.1.1.2.0 (SNMP-USER-BASED-SM-MIB::usmStatsNotInTimeWindows.0)"
If composed error can be exposed to frontend to item error status - it will be also very nice.
Well, you can say that if zabbix faced with usmStatsNotInTimeWindows case, then logically any snmpV3 checks will not work on the device at all, so marking snmp-host as unreachable is a logical consequence.
You might be right, but, what if I have several interfaces for the device? and/or some checks are snmpV1 + some are snmpV3? In this case snmpV1 mostly will not be monitored because of snmpV3 failure.
So I still suggest to mark failed items as not supported.
Such approach will also help to avoid to unreachable_pollers usage, which most likely do not store engineID in cache before the issue appears.
|
|
Oleksiy,
This almost seems you were sitting in a bath and had a EUREKA moment today!  This explains a lot, and you know our v3 environment and the tickets that came with it... This explains a lot, and you know our v3 environment and the tickets that came with it...
Fully has my vote, it's a big issue. Thank you for diving into it.
|
|
ohh, forgot to describe how most likely easy emulate usmStatsNotInTimeWindows error.
Of course you can configure 2 snmp devices in network with identical engineIDs (case a)).
But more easy is to generate case b)
Configure snmpd daemon on a Linux host. Make sure that snmpV3 is working and zabbix is monitoring it (configure single poller and single unreachable poller).
Stop snmpd, edit /var/lib/snmp/snmpd.conf and set engineBoots value less by 1 than current, save it, start snmpd again.
At this point (depending on how long snmpd was stopped and was the item pooled with timeout during this period or not) one of pollers will check the Linux host.
One of pollers definitely start to fail with the usmStatsNotInTimeWindows error.
The /var/lib/snmp/snmpd.conf file is not a general config file, it's a "persistent data" file where snmpd daemon stores run-time values which should be preserved between restarts.
My Linux is Debian/testing, in your Linux the path might be different.
You can find this specific conf file mentioned on `man snmpd.conf`.
|
|
Just FYI:
Today I reported also ZBXNEXT-2352 where I mentioned libsnmp's functions:
- free_enginetime(unsigned char *engineID, size_t engineID_len) - to remove particular engineID entry from the cache
- free_etimelist() - to clean out etimelist cache completely.
They could be considered to be used to cardinally resolve current issue (for example we could monitor even duplicated engineIDs), but after 2 days of thinking on this I tend to think it will not very good.
|
|
I don't think we can rely on the status code returned by snmp_synch_response(), because 2 is timeout code (STAT_TIMEOUT) and 1 is error code (STAT_ERROR).
If the device is down during connection snmp_synch_response will return STAT_ERROR (because snmpv3_engineID_probe() fails with "unable to determine remote engine ID" error). But in the case of real timeout snmp_synch_response() should return STAT_TIMEOUT (haven't tested it though) and there are no easy way to tell if it was timeout or usmStatsNotInTimeWindows error. At least not on higher level - we might get something when using lower level functionality (basically reimplementing snmp_synch_response()) or providing custom security model which would store the error code.
I took a look at net-snmp code - the usmStatsNotInTimeWindows simply causes snmp_parse() to fail with SNMPERR_USM_NOTINTIMEWINDOW which is not stored/returned anywhere.
So maybe dropping the engine from cache is the right way. Though on a quick test I had no luck with free_enginetime(). free_etimelist() was working as expected, but that might be an overkill.
wiper I found out that I was using wrong engineid with enginetime(), so that explains why I could not reset the time stats with it.
zalex_ua fixed two typos in comment above: :->", snmp_sync_response->snmp_synch_response
It's unclear what is the difference between your "device is down during connection" and "in the case of real timeout". for me both such cases are identical.
And 2nd case is just your assumption. My tests below show that your assumption is wrong.
|
|
One interesting point which is not very noticeable is "swapped" values of status for zabbix's and library's point of view.
I already mentioned that:
*** Zabbix: ***
-- Real timeot:
 28452:20140619:173453.200 zbx_snmp_get_values() snmp_synch_response() status:1 errstat:-1 mapping_num:1

-- usmStatsNotInTimeWindows report:
 27661:20140619:172253.954 zbx_snmp_get_values() snmp_synch_response() status:2 errstat:-1 mapping_num:1
added: see my comment dated 2015 Jan 16 01:24 for such lines in recent zabbix versions.
wiper has mentioned above:
*** library ***
snmp_client.h:
    struct synch_state {
        int             waiting;
        int             status;
        /*
         * status codes
         */
#define STAT_SUCCESS	0
#define STAT_ERROR	1
#define STAT_TIMEOUT	2
By "swapped" values I mean this resulting matches:
#define STAT_ERROR   1 = zabbix Real timeot:
#define STAT_TIMEOUT 2 = zabbix usmStatsNotInTimeWindows report
Just need to be carefull, to be not confused.
I'm not so power in linetsnmp internals, so I want to explaine.
When I created this issie in summary I used "report" term.
Why? -> when I see such snmp sessions in Wireshark, these packets are classified as "report".
See:
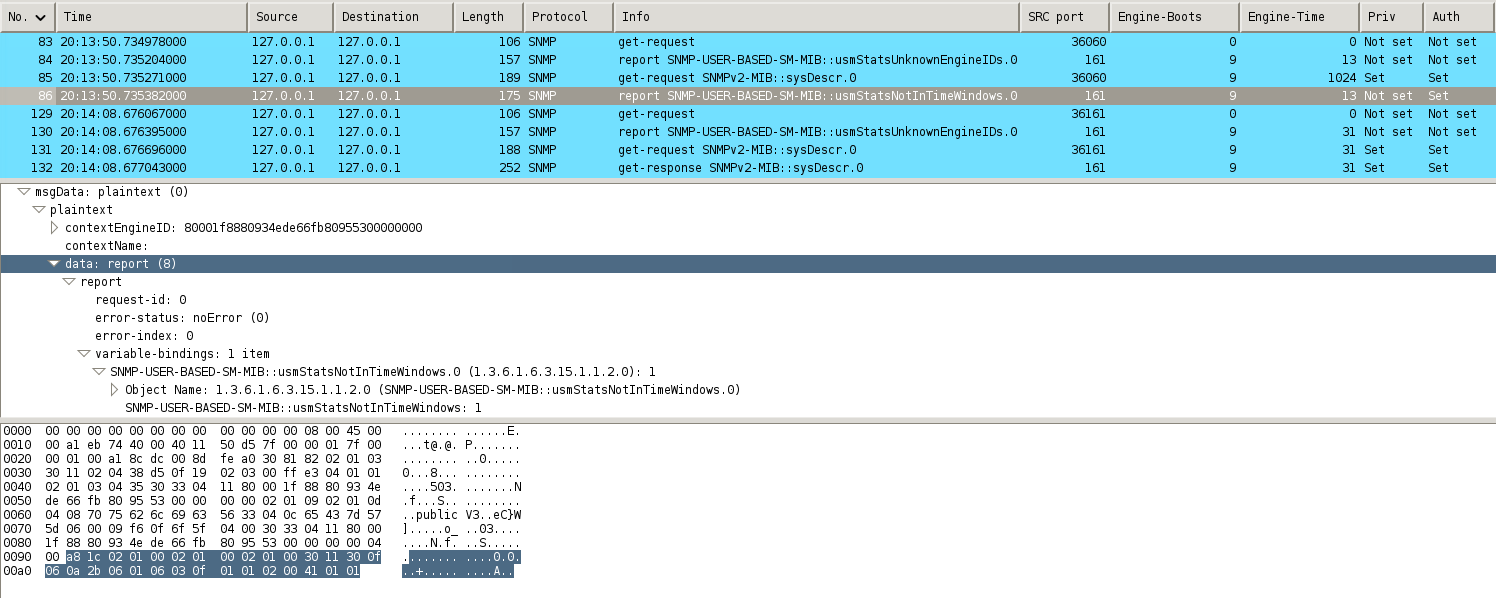
I couldn't find references in RFCs how they identified as "report", but in snmp sources I was able to find this:
snmp.h:
/*
* PDU types in SNMPv2u, SNMPv2*, and SNMPv3
*/
#define SNMP_MSG_REPORT (ASN_CONTEXT | ASN_CONSTRUCTOR | 0x8)
and in my screenshot above we see that "data" started from 0xa8, so I suppose it's how it detected.
So, I think zabbix should detect that these actually was "report" responce from snmp agent, parse and print to zabbix server log (as I suggested with engineID, engineBoot, engineTime and OID from report).
Other details:
Also in snmp_api.c: I noticed "snmp_pdu_type(int type)" functin could be concidered to be used.
In net-snmp source code I see this:
snmpv3_make_report(netsnmp_pdu *pdu, int error)
{

    long            ltmp;
    static oid      unknownSecurityLevel[] =
        { 1, 3, 6, 1, 6, 3, 15, 1, 1, 1, 0 };
    static oid      notInTimeWindow[] =
        { 1, 3, 6, 1, 6, 3, 15, 1, 1, 2, 0 };
    static oid      unknownUserName[] =
        { 1, 3, 6, 1, 6, 3, 15, 1, 1, 3, 0 };
    static oid      unknownEngineID[] =
        { 1, 3, 6, 1, 6, 3, 15, 1, 1, 4, 0 };
    static oid      wrongDigest[] = { 1, 3, 6, 1, 6, 3, 15, 1, 1, 5, 0 };
    static oid      decryptionError[] =
        { 1, 3, 6, 1, 6, 3, 15, 1, 1, 6, 0 };
    oid            *err_var;
    int             err_var_len;
    int             stat_ind;
    struct snmp_secmod_def *sptr;
...
I guess these are OIDs which net-snmp (as agent) can use in reports.
It means that if snmp agent responds with "report", then we should not suppose it's notInTimeWindow error only.
About "dropping the engine from cache" approach - currently I would not want that we will use it for all cases.
Yeah, it will be pretty nice and cool solution for case b) (incorrect agent behavior after reboot), because all pollers which store "outdated/wrong" snmp cache entries after some period will use only correct ones, and that's cool.
But for case a) (duplicate engineIDs) it will produce almost the same picture, depending when and on what conditions we will free_enginetime() on failed session.
Will we free_enginetime() after "report" and retry to get value in the same session so we don't allow to NETWORK_ERROR appearing?
If we do it in this way, yes, we can say that "zabbix supports duplicated engineIDs", but that looks for me as dirty solution. It also leads to decreased snmp security, IMO.
free_etimelist() approach should not be considered because it will breack up ZBXNEXT-2352 idea
|
|
As I said we will have to use lower level API. The snmp_synch_response() function we are using considers usmStatsNotInTimeWindows response as a parsing error and keeps waiting for the right packet. Then it timeouts and returns NULL pdu - so there is nothing for us examine.
I think dropping engine from cache would be fine in usmStatsNotInTimeWindows situation. Otherwise the buggy devices would be unaccessible until server/proxy restart anyway. But if we would decide to simply drop engine from cache in the case of STAT_TIMEOUT, then we would need engine caching you were talking in ZBXNEXT-2352 (otherwise we would not know engine id to drop) .
|
|
Monitoring of buggy devices (case b) ) is NOT a goal of current issue report.
Main goal is - to don't treat usmStatsNotInTimeWindows report as zabbix NETWORK_ERROR and provide some additional information to zabbix_server.log at DebugLevel=3
hmm, I cannot imagine why we need ZBXNEXT-2352 to drop particular engineID when we already got usmStatsNotInTimeWindows report/response.
I don't know of course what library can provide by API, but logically engineID is already known by library on this stage from previous, working device.
That's why library used wrong engineBoot/engineTime which leads to usmStatsNotInTimeWindows error.
just in case - here is example with debug by "lcd*" token:
# snmpget -v 3 -a MD5 -A publicV3 -l authPriv -u publicV3 -X publicV3 localhost .1.3.6.1.2.1.1.1.0 -Dlcd
registered debug token lcd, 1
registered debug token lcd, 1
-- next line is related to manager (running snmpget command, ignore it)
lcd_set_enginetime: engineID    80 00 1F 88 80 CB 3E 29 01 05 12 A3 53 00 00 00 00 : boots=1, time=0
lcd_set_enginetime: engineID    80 00 1F 88 80 93 4E DE 66 FB 80 95 53 00 00 00 00 : boots=0, time=0
lcd_set_enginetime: engineID    80 00 1F 88 80 93 4E DE 66 FB 80 95 53 00 00 00 00 : boots=22, time=8152
lcd_get_enginetime: engineID    80 00 1F 88 80 93 4E DE 66 FB 80 95 53 00 00 00 00 : boots=22, time=8152
lcd_set_enginetime: engineID    80 00 1F 88 80 93 4E DE 66 FB 80 95 53 00 00 00 00 : boots=0, time=0
lcd_get_enginetime_ex: engineID 80 00 1F 88 80 93 4E DE 66 FB 80 95 53 00 00 00 00 : boots=0, time=0
lcd_set_enginetime: engineID    80 00 1F 88 80 93 4E DE 66 FB 80 95 53 00 00 00 00 : boots=22, time=8152

SNMPv2-MIB::sysDescr.0 = STRING: Linux it0 3.14-1-amd64 #1 SMP Debian 3.14.4-1 (2014-05-13) x86_64
|
|
What I meant if we decide to use current request sending/receiving implementation (basically snmp_synch_response function) then we are unable to catch usmStatsNotInTimeWindows response. All we get is timeout error with NULL response. So if we wanted to drop the engine from cache in this situation, then we would have to remember the engine from the last successful response - hence ZBXNEXT-2352 and engineId caching.
|
|
I had a chance to check one production environment and want to share some details, not are directly related to current issue.
I took snmp dump for 10 minutes and there were 5 usmStatsNotInTimeWindows responses.
Investigations them I discovered interesting details.
This details are "not visible" to zabbix, because it's internals on snmp protocol and those snmp sessions were success, but they show that devices (agents) can be reason of different problems.
In this case manager(zabbix) (as it is not the authoritative SNMP engine) according to RFC3414 section "3.2. 7) b) 1) 2nd" updated its values by agent's ones.
In Wireshark I filtered by "(snmp.name == 1.3.6.1.2.1.1.3.0) && (snmp.data == 2)" (responses with sysUpTime OID) and compared EngineTime and sysUpTime which logically should be the same.
The device Fortinet had: EngineTime 33409437, sysUpTime 34377221 - difference in 2%
Another Fortinet device EngineTime 30280445, sysUpTime 33948713 - difference in 12% !
Around ten other Fortinet devices had that difference in 1%-7%
Yet another Fortinet device has EngineBoot = 0. Not sure it's increased after reboot, so it can be issue's case b)
For all Fortinet devices I saw EngineBoot as high as 1370002377, which is unreal. Later I got that this is a unixtime stamp when device was booted, which of course doesn't follow RFC.
Conclusion - Fortinet devices internally store/calculate EngineTime with very poor precision, EngineTime is always less than sysUpTime !
It leads to the periodic usmStatsNotInTimeWindows packets is snmp dump, which although are not visible to zabbix, because snmp session is success.
If for example the difference is 2% then the usmStatsNotInTimeWindows packet may appear every ~2 hours for every zabbix poller.
If compare with Cisco ...
For a Cisco device with 466 days uptime I saw only 26 seconds in difference of sysUpTime OID and EngineTime
Saw another Cisco device with 449 days uptime where the values are identical.
Checked another environment:
D-link device for 25 days uptime the difference is 41 second.
Interesting that after I rebooted the D-link device I see EngineTime=30, sysUpTimeInstance=71, which is the same 41 seconds difference. I.e. we may suppose that snmp daemon started just 41 second later after device's OS.
Returning for the Fortinet behavior - it cannot be the same for Dlink above, because:
1) for two snmp sessions with interval==300 seconds I saw difference in agent's EngineTime in 296, 298 seconds.
2) absolute difference is too big to be the same delay as for D-link device.
|
|
After 2 days (at server's 12:34:57.8) I've checked the Fortinet device which was with EngineTime=30280445, sysUpTime=33948713 (difference in 12% !).
Now (at server's 12:04:17) it's EngineTime=30449278, sysUpTime=34119668
If calculate difference:
EngineTime diff    - 168833
sysUpTime diff     - 170955
server's time diff - 170959
I'd expect the same 12% difference, but it's only 1.2%, heh ...
But it's still is!
|
|
I've seen something recently that results in the same behavior, but may have a different cause. I've noticed Cisco ASA devices function queried via SNMPv3 function well for a while, and then start intermittently failing to be detected as online by Zabbix, even without changes to the configuration (including no new devices being added).
One ASA device started flapping in the logs about 12:16 am on the 4th -
32460:20150104:000730.498 executing housekeeper
32460:20150104:000747.895 housekeeper [deleted 1872 hist/trends, 0 items, 0 events, 0 sessions, 0 alarms, 0 audit items in 17.358250 sec, idle 1 hour(s)]
32440:20150104:001611.197 SNMP agent item [removed] on host "asa" failed: first network error, wait for 15 seconds
32443:20150104:001626.847 resuming SNMP agent checks on host "asa": connection restored
32439:20150104:001711.209 SNMP agent item [removed] on host "asa" failed: first network error, wait for 15 seconds
32443:20150104:001726.993 resuming SNMP agent checks on host "asa": connection restored
32438:20150104:001811.355 SNMP agent item [removed] on host "asa" failed: first network error, wait for 15 seconds
32443:20150104:001826.148 resuming SNMP agent checks on host "asa": connection restored
When I started troubleshooting with packet captures on the 6th, I see get-requests and get-next-requests succeeding with get-responses. These packets from the Zabbix server have the correct snmpEngineBoots and snmpEngineTime . However, occasionally (for a different MIB and presumably a different polling process), the snmpEngineTime is 4294952 seconds ahead of the correct value, and the device will reply with a report of 1.3.6.1.6.3.15.1.1.2.0 (as mentioned above).
Looking at the current reported snmpEngineTime and using date --date='$x seconds ago', I get a value right around 00:15 on 1/4, which is when snmpEngineTime presumably either rolled over or the SNMP engine was reinitialized for some reason. When this happened, it also presumably incremented snmpEngineBoots from 3 to 4, but I can't confirm that. I do see the correct value of 4 for snmpEngineBoots in both the correct and incorrect requests, though.
The Zabbix server then marks them as down rather than not supported, as discussed above, and so I get very little (if any) data back from the device until I go in and restart the Zabbix service, solving the issue temporarily. I've seen this behavior on quite a few ASA devices, but haven't taken the time to dig into it. Hope this helps add another piece to the puzzle. I'd love to see this issue get addressed.
|
|
Kay, thanks for your comment. Not every user wants to deep into such details, so I want to say thank you
Note that after a device has rolled over snmpEngineTime and has increased snmpEngineBoots and zabbix server tries to get snmp value from the device - zabbix server (particular process) will update its own snmpEngineTime and snmpEngineBoots by new, correct values during the same snmp session. And value will be successfully received w/o any errors in zabbix server log.
I've just checked this now to be sure, here is:

So not everything is correct in your assumptions.
Something is wrong in your environment.
You mentioned get-next-requests, so there could be LLD or dynamic indexes snmp items. But that's not so important.
Remember that you have to mention zabbix server version in such tests.
If the issue is critical for you and you cannot figure out what's wrong and how to resolve it, you may consider http://www.zabbix.com/services.php
|
|
Thanks for the response, especially so quickly. Your screenshot makes a lot of sense. In my case, it's like some of the processes rolled around correctly, but others did not, and those (that?) one(s) cause the server to be marked down. Let me show you what I'm seeing:
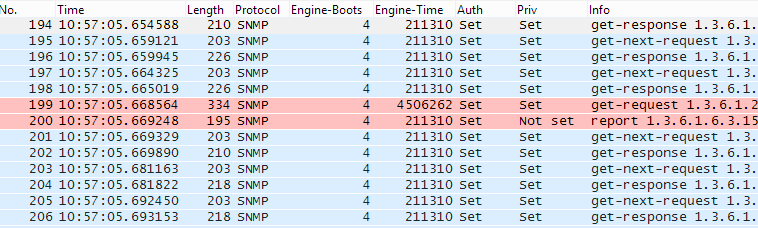
These just loop repeatedly between the queries with the correct engine-time and the ones with the invalid time. And this started at the same time as it rolled over on the Cisco device.
Yes, the get-next-requests are expected, since I'm using a lot of LLD (which I find invaluable, as a side note).
|
|
Try to snmpget that ASA device with "-Dlcd" options (you can search these options on this page);
then soft restart the device, then again snmpget;
then hard restart the device, then again snmpget.
In such a way make sure that ASA's snmpEngineTime and snmpEngineBoots were changed correctly for all "edge" cases.
Don't mix it with manager's (snmpget's) values.
Yes, manager's (snmpget's) such values also appear in the command output.
|
|
Sorry for the slow response on this one.
This is what I see for snmpget. The engineIDs all match, but some show boots/time and some do not:
Both a hard and soft reset result in the boot number incrementing by one and the time starting over at zero. All the engineIDs matched (except the manager one that I removed from the output, of course).
I have noticed that removing the configuration for the snmp server on an ASA will result in setting number of boots and time back to zero. That didn't occur before the failure in this case, however.
|
|
Kay, I cannot help you anymore, sorry.
|
|
After ZBX-9163 improvement I can see this in server log in different cases (-- description):
-- a success get:
10461:20150116:004517.606 zbx_snmp_get_values() snmp_synch_response() status:0 s_snmp_errno:0 errstat:0 mapping_num:1

-- real timeout:
11132:20150116:012123.904 zbx_snmp_get_values() snmp_synch_response() status:1 s_snmp_errno:-24 errstat:-1 mapping_num:1

-- usmStatsNotInTimeWindows report:
10461:20150116:005523.184 zbx_snmp_get_values() snmp_synch_response() status:2 s_snmp_errno:-24 errstat:-1 mapping_num:1
I hoped that newly added "s_snmp_errno:-24 " will provide something interesting.
No luck, according to "include/net-snmp/library/snmp_api.h" it's:
#define SNMPERR_TIMEOUT (-24)
Not sure, maybe it's still could be useful ? ...
|
|
Hi Oleksiy, I'm not looking for tech support. This seems related to the behavior in the bug here and I'm trying to help provide an example. You still think it's a device issue rather than Zabbix?
|
|
Kay, what is "wrong" in zabbix and how it would be better in zabbix - I described initially in this issue.
We still don't know is it possible to improve with reasonable amount of development.
Remember that external libraries also may have bugs or bad design.
It's not possible to answer on your last question - who is bad: zabbix or the device.
You didn't mention 3rd important thing - environment. Reason may be over there!
I don't think we need to continue such discussion here.
See http://www.zabbix.org/wiki/Getting_help#IRC
|
|
Kay, have you solved your problem?
Because I have the same with zabbix 2.4 devices become unavailable and I don't know how to fix this.
|
|
@Oleksiy Zagorskyi,
we use zabbix 2.4.6 with net-snmp-libs-5.7.2 X and we cann't poll data from ARISTA, JUNIPER, EDGECORE over snmp v3.
And I didn't understand from your conversation on which side the proble is, on Zabbix, net-snmp-libs or device.
It is very strange situation if zabbix supports snmp v3 from 1.8 version.
And this problem is not solved yet.
|
|
Vadim, your question sound more like a support request, see http://zabbix.org/wiki/Getting_help
Zabbix works with snmpv3, definitely.
|
|
Oleksiy, how my question can sound like a support request if I have problems with 3 type of network devices?
Have you tested Zabbix with net-snmp-libs-5.7?
So if I say that I have a problem with sbnmp v3 aes128 checks, hosts become unavailable, I think it is a bug.
|
|
net-snmp v5.7 has been mentioned as working with zabbix 3 years ago in ZBX-4393 and I it's still so, for example on my Debian with v 5.7.2.1.
If you are sure zabbix has some bug, please create new bug report, following these rules http://zabbix.org/wiki/Docs/bug_reporting_guidelines.
Current bug report is for a very specific case, don't spam it please with unrelated discussions, thanks.
|
|
Good morning, I noticed the same problem with CheckPoint security equipment.
The problem starts to occur when you apply any procedure on the machine and it is restarted.
I understand that is not a bug Zabbix but a failure in timing or snmp cache, because the problem only occurs with snmp collections.
Analyzing the problem, I realized that the problem only occurs in the automatic collection mode, and if you run the command snmpget directly from Zabbix server the problem does not occur.
So I think the problem is solved when the zabbix-server is restarted since the cache snmp is reset.
You would know me know if it is possible to effectuate cleaning snmp cache without having to restart the zabbix-server service?
I am using Zabbix 2.2.10.
In some research on the Internet I saw some people saying that the problem may be related to a setting on the device where the EngineBoot item is set to 1. I look forward to staff responsible for the equipment to be able to check for this configuration item in CheckPoint and if we can change it to 0, as directed in other forums. If this test works inform you.
Thank you and I'm waiting if they have some guidance on the snmp configuration in zabbix.
|
|
I have a case where Palo Alto Networks PA-7000 series firewall always had snmpEngineBoots=1 after device reboot.
|
|
could ZBX-9123 be the same ?
|
|
Rich, will take a look and reply there.
|
|
In the ZBX-9123 we got a proof that Mikrotik devices behave incorrectly, case b).
It supposed to be fixed by the manufacturer soon.
|
|
As ZBXNEXT-1789 and ZBX-2152 are closed and ZBXNEXT-2352 doesn't explicitly include this improvement request...
Re. ZBXNEXT-1789 improve duplicate snmpv3 engineid detection and documentation
With sufficient criteria met (should the Zabbix hostid also be part of the mix?), disabling the host/hosts and providing a meaningful error message in the (level 3 or less) server/proxy logs - preferably with a list of IP's with conflicting engineID's - and also an appropritate hint in the UI tooltip for the disabled host/hosts in the frontend, would be most helpful and might save a lot of time..
|
|
ZBX-13769 contains possible related discussion.
|
|
Got confirmation that "Cisco UCS server" always returns boots=1.
|
|
Just for a record, as it's a dirty hack. I don't recommend to do that.
Someone decided to patch net-snmp library and disable RFC's security checks regarding EngineBoots and EngineTime.
http://vladimir-stupin.blogspot.com/2016/09/snmpv3-usmtimewindow.html (in Russian)
|
|
The deepest investigation of the issue I have ever found! And still no solution, that's sad. Exeoriencing the same problems with tons of Cisco Nexus devices.
|
|
We found workaround and implemented it in a few minutes:
- Get several zabbix-proxies running (we did it in docker containers)
- Set number of pollers in each proxy = 1
- Assign hosts to proxies (we did 1 data center per proxy)
- Enjoy
After these steps no more graph gaps and "network" failures on logs.
|
|
That sounds more like a fun
|
|
I'd rather say it sounds like sad but true, we have mix of problems:
- vendors aint gonna fix their software (at least in reasonable time)
- zabbix or libsnmp developers aint gonna add tumbler to config to ignore incorrect timestamps (6 years has gone since this issue was created)
But we need proactive monitoring 24x7x365, so any solution is better than nothing, more over proxies offload main server which is nice bonus. Rolling back to SNMPv2 is not a solution due to security conerns.
|
|
Fixing engineID's did it for us, no problems since.
Good luck with getting a support contract for 2480 proxies with that workaround... Zabbix WILL appreciate. 
|
|
Still digging into the problem, looks like devices respond with msgAuthoritativeEngineBoots and msgAuthoritativeEngineTime zeroed due to EngineID discovery:
https://tools.ietf.org/html/rfc5343
3.2. EngineID Discovery
Discovery of the snmpEngineID is done by sending a Read Class
protocol operation (see Section 2.8 of [RFC3411]) to retrieve the
snmpEngineID scalar using the localEngineID defined above as a
contextEngineID value. Implementations SHOULD only perform this
discovery step when it is needed. In particular, if security models
are used that already discover the remote snmpEngineID (such as USM),
then no further discovery is necessary. The same is true in
situations where the application already knows a suitable
snmpEngineID value.
So it means at least that Zabbix should not discover snmpEngineID very often. However I did not find how in this step should respond the device itself in fields msgAuthoritativeEngineBoots and msgAuthoritativeEngineTime. After looking at packet dumps more thoroughly it looks that each time engineID negotiated, device responds with zeroed time fields (not sure whether it should or should not do it). At the same time looking at manual snmpbulkwalk dump shows that only respond to engineID results in zeroed fields, while subsequent sub-queries responded with normal time fields.
|
|
Janne Korkkula, how did you fix engineIDs? If you mean duplicate IDs for different devices - we do not have ones. I also thought about setting engineIDs for each device in Zabbix, but did not find the way to do it.
|
|
Andrei, Zabbix server does not do walk, do not compare with it.
Zabbix server does get bulk, sometimes in a few packets, which is still single session, so EngineID is re-used that time.
Please, don't mix here 2 cases - correct EngineID learning and usmStatsNotInTimeWindows report response - they are different.
|
|
Oleksii, ok, lets look at packet dump:
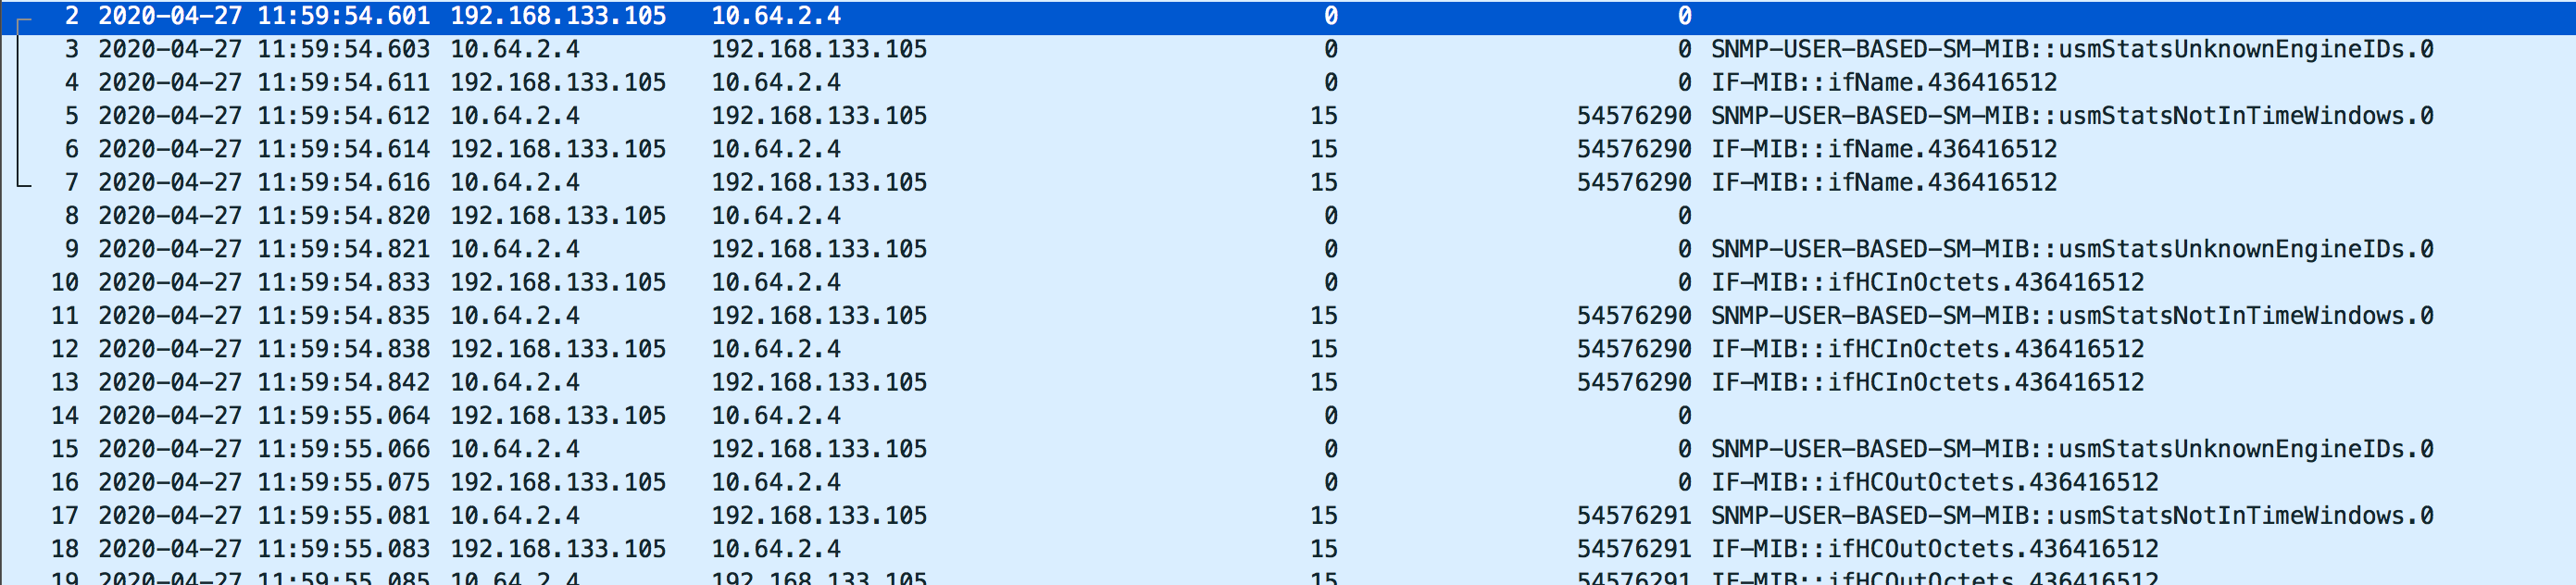
This has been captured on Zabbix server. Bulk requests are turned on for the host, but Zabbix does not seem to do them, also it does not seem that Zabbix cached engineID, otherwise it would reuse it, but it discovers engineID on every request. Again, I am not telling that device sets correct time fields, I am telling that Zabbix should cache engineID, while it does not.
|
|
Don't think that things are so simple. Remember that zabbix is a multi process application.
Zabbix does GetBulk, if it's possible to group OIDs. For LLD it does GetNext with some number of repetitions.
I investigated and analyzed tons of such dumps.
As for caching - I've created ZBXNEXT-2352 quite long time ago.
|
|
I know that Zabbix is multiprocess and that is why we deployed additional proxies and configured snmp pollers to start only 1 on each proxy, which solved the preblem (in fact masked it).
I wo believe in your troublesoohing skills, but I am here not to discuss them - I want to get the truth - who is guilty and what to do? In parallel I am talking with network vendor support.
|
|
Hello Zabbix team ,
For your information, issue is seen on Cisco Nexus 7000 platform after an upgrade. Problem is resolved after rebooting Zabbix server (all-in-one installation).
Any chance to see a different net-snmp library usage in future Zabbix release ?
Best regards,
|
|
Not sure there is any other library which provides snmp support.
But we have already ZBXNEXT-3940 implemented which helps in current cases.
|
|
Thanks a lot Oleksii ! I didn't find ZBXNEXT-3940 when I was investigating my "No SNMP data collection" problem on my N7K.
|
|
In 7.0+ unreachable pollers are not used for new snmp checks (walk[... / get[...), this could help with this issue ZBXNEXT-8460.
|
So I still suggest to mark failed items as not supported.
Such approach will also help to avoid to unreachable_pollers usage, which most likely do not store engineID in cache before the issue appears.
Closing this as unreachable pollers are no longer used with walk and get as per above comment in ZBXNEXT-8460, also please see other improvements in ZBXNEXT-3940 and ZBXNEXT-8823.
|
Generated at Sat May 09 18:25:26 EEST 2026 using Jira 10.3.18#10030018-sha1:5642e4ad348b6c2a83ebdba689d04763a2393cab.
