|
Duplicate |
|||
| duplicates |
|
Count of actions has a significant im... | Closed |
[ZBX-9532] VMware connection issues may apparently cause busy history syncers Created: 2015 May 02 Updated: 2017 May 30 Resolved: 2015 Nov 23 |
|
| Status: | Closed |
| Project: | ZABBIX BUGS AND ISSUES |
| Component/s: | Proxy (P), Server (S) |
| Affects Version/s: | 2.2.9 |
| Fix Version/s: | None |
| Type: | Incident report | Priority: | Major |
| Reporter: | Marc | Assignee: | Unassigned |
| Resolution: | Duplicate | Votes: | 0 |
| Labels: | performance, vmware | ||
| Remaining Estimate: | Not Specified | ||
| Time Spent: | Not Specified | ||
| Original Estimate: | Not Specified | ||
| Attachments: |
|
||||||||
| Issue Links: |
|
||||||||
| Description |
|
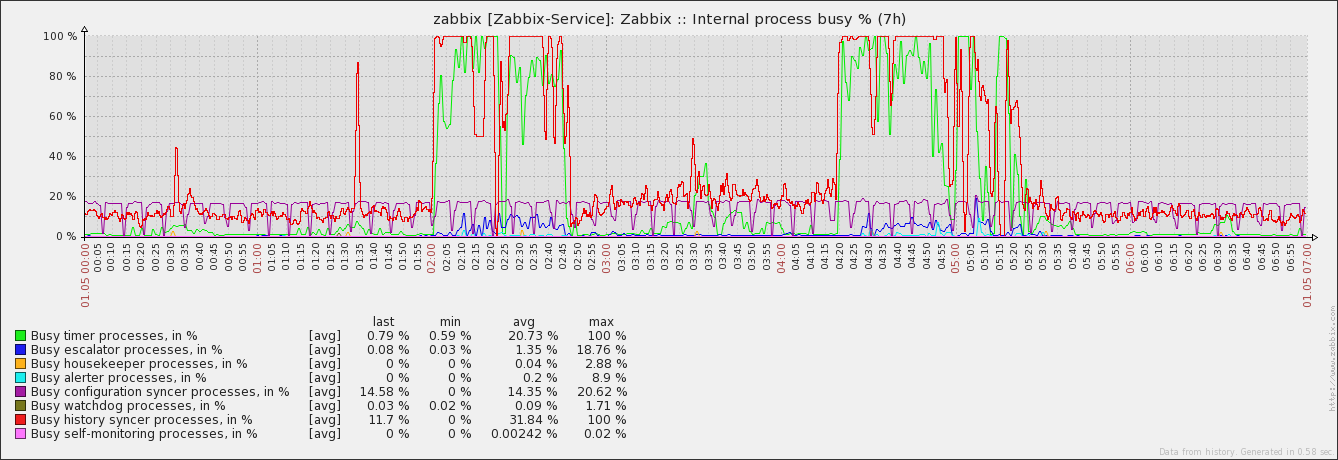
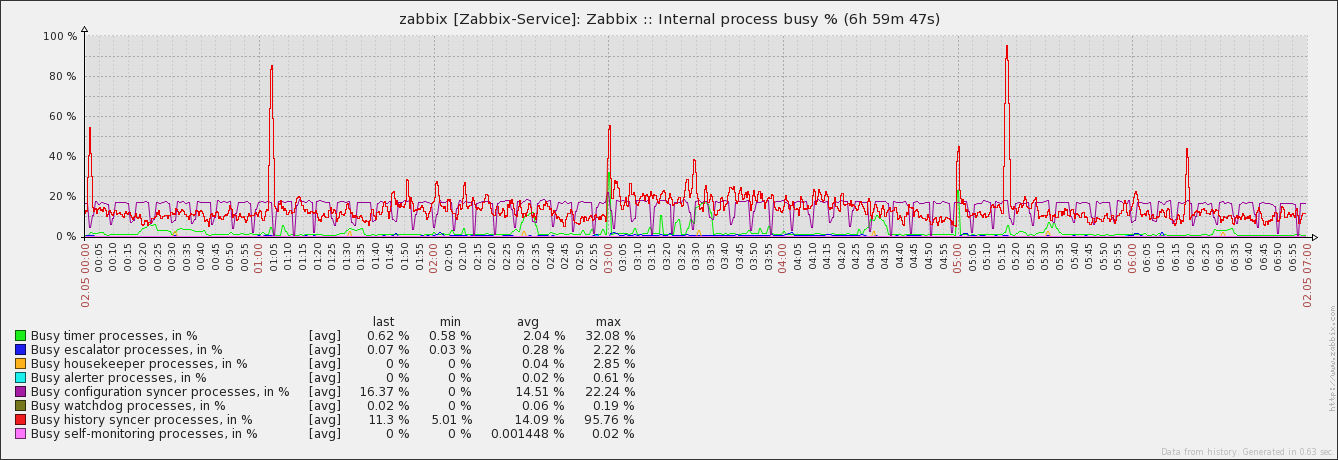
Time based triggers produced false-positive alerts at the same time for a couple of days. While everything seams to be fine on Zabbix server side (resources, database, nvps, ...) there were thousands of suspicious VMware related log messages that matched exactly in time: --- SNIP zabbix_server.log --- 895:20150430:020102.946 item "50196356-038e-d219-ca5b-52460e478ba1:vmware.vm.memory.size.compressed[{$URL},{HOST.HOST}]" became not supported: Couldn't connect to server 895:20150430:020102.946 item "502d13c2-bffe-b0e7-c4a2-2232b8f5d214:vmware.vm.memory.size.compressed[{$URL},{HOST.HOST}]" became not supported: Couldn't connect to server 895:20150430:020102.946 item "502df28b-5daf-e7a4-cb42-f874507238f4:vmware.vm.memory.size[{$URL},{HOST.HOST}]" became not supported: Couldn't connect to server 895:20150430:020102.946 item "5019e168-2dc5-223d-a82c-c857b98698c3:vmware.vm.memory.size.compressed[{$URL},{HOST.HOST}]" became not supported: Couldn't connect to server 895:20150430:020102.946 item "5019e5ed-810f-dfa8-9577-9127c99439b3:vmware.vm.uptime[{$URL},{HOST.HOST}]" became not supported: Couldn't connect to server 895:20150430:020102.946 item "502d8262-815b-8ff3-c7c5-7ef0e61bbdb9:vmware.vm.memory.size.compressed[{$URL},{HOST.HOST}]" became not supported: Couldn't connect to server --- SNAP zabbix_server.log --- After creating a maintenance period with no data collection (1h at 02:00am and 04:00am) for all VMware hosts, the Zabbix server was not suffering from busy history syncer processes anymore.
Environment
|
| Comments |
| Comment by Oleksii Zagorskyi [ 2015 May 03 ] |
|
Original Marc's attachments, just positioned for better view: |
| Comment by Oleksii Zagorskyi [ 2015 May 03 ] |
|
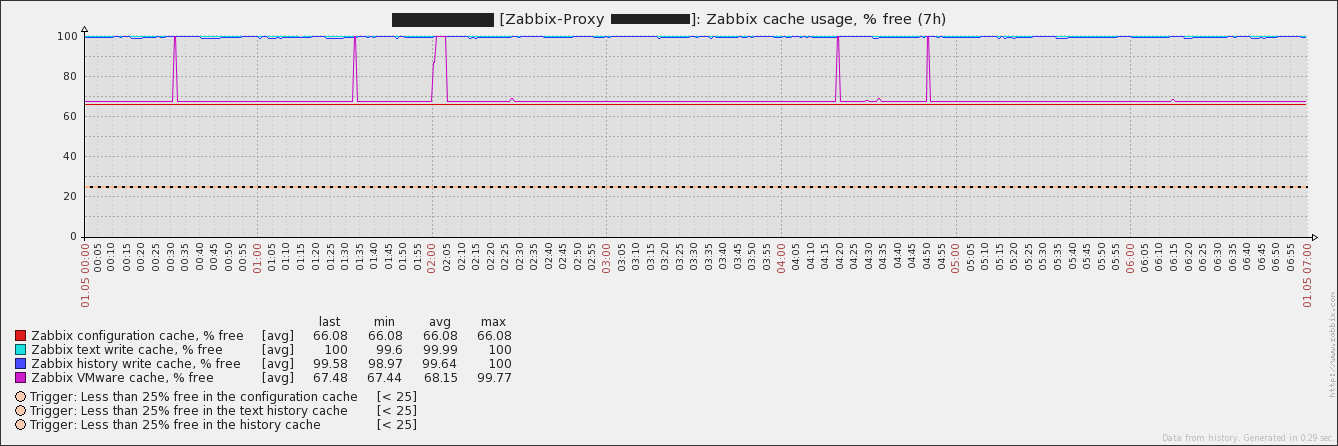
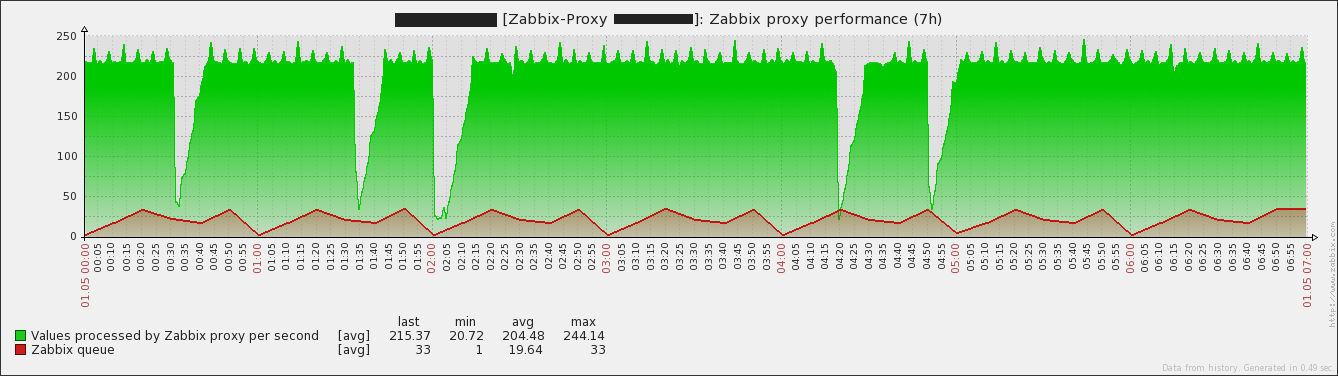
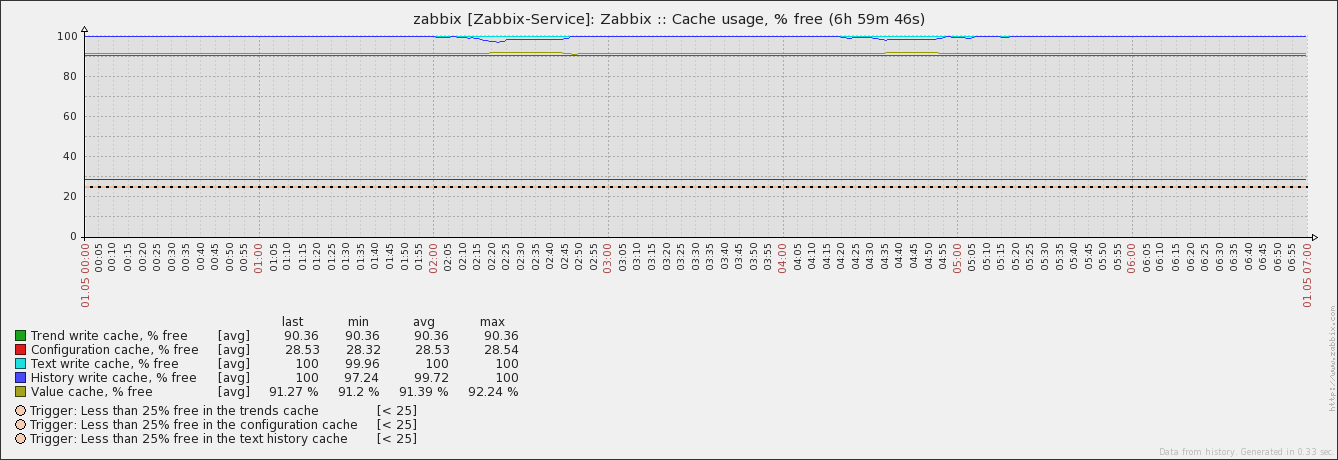
You attached graphs from server and a proxy. Suspicious VMware related log messages are from server log. We see caches behavior on proxy, but would be good to see them for server too. I cannot get where is the original problem - on server or proxy ? |
| Comment by Marc [ 2015 May 03 ] |
|
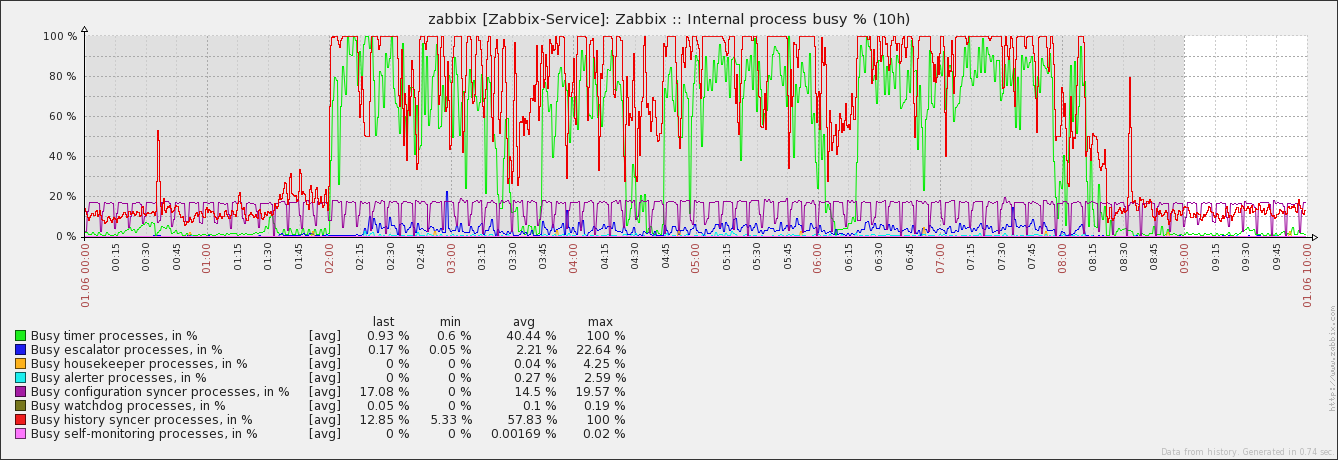
Yes, the messages are indeed from the server's log. We see the NVPS drop on proxy side too, because of not being polled anymore due to connection issues (between Zabbix proxy and vCenter). I already briefly checked the count of history values grouped by item on the server's database for the time in question - nothing suspicious The caches on server side show the expected picture. Since history syncer processes reach their limit or are blocked, data gets not fast enough written out of the caches. thus time based triggers are falsely firing on the longer periods. |
| Comment by Marc [ 2015 May 03 ] |
|
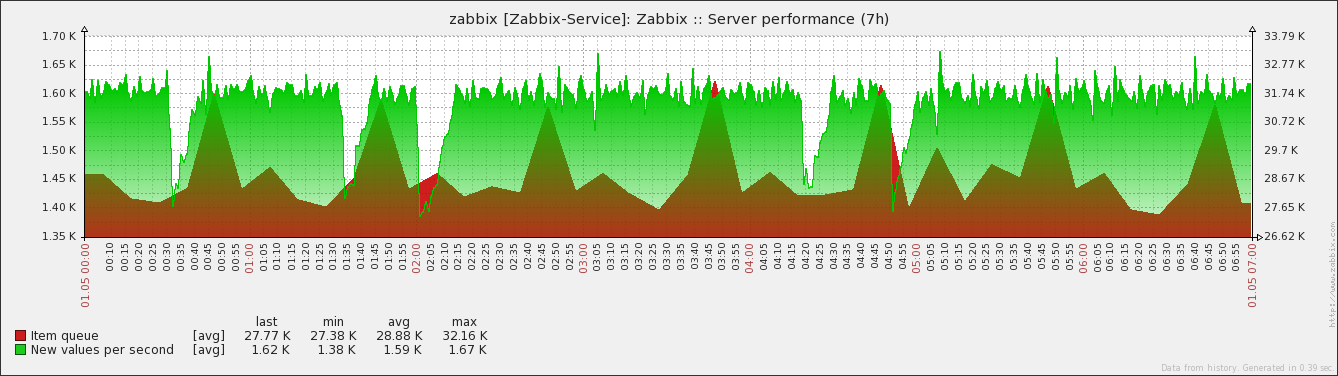
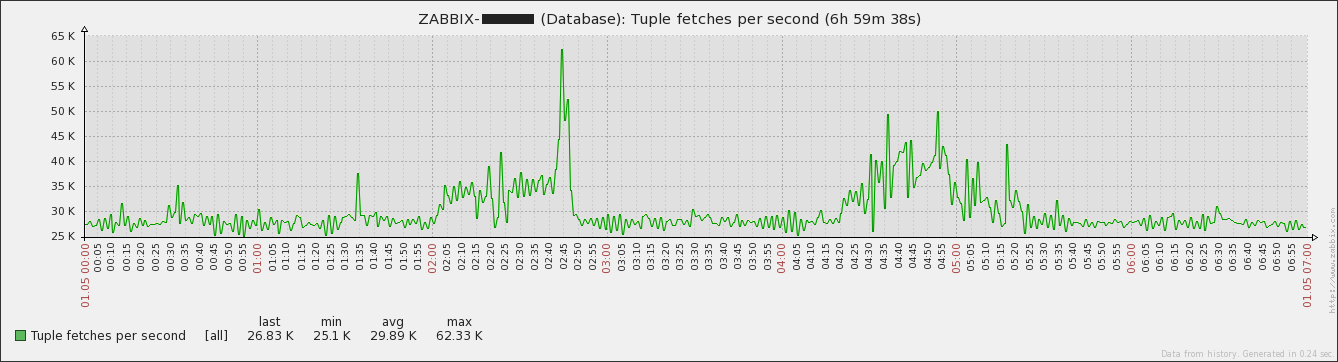
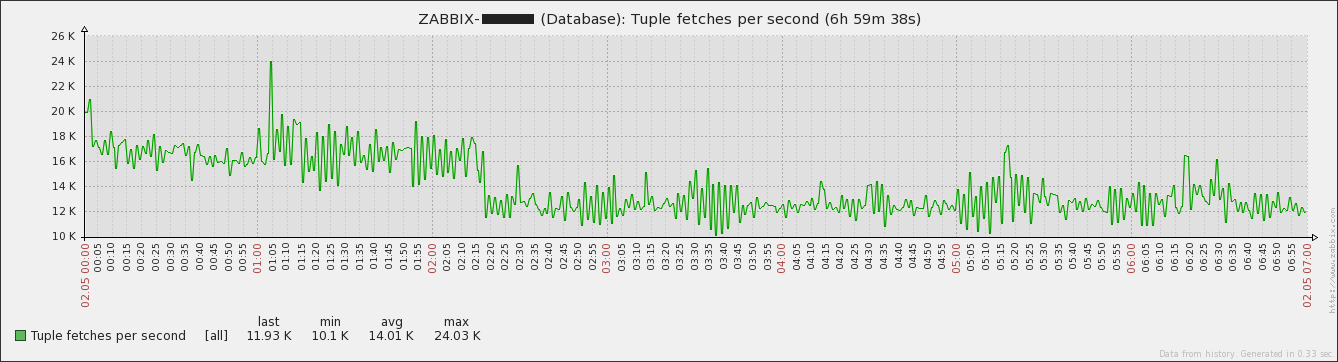
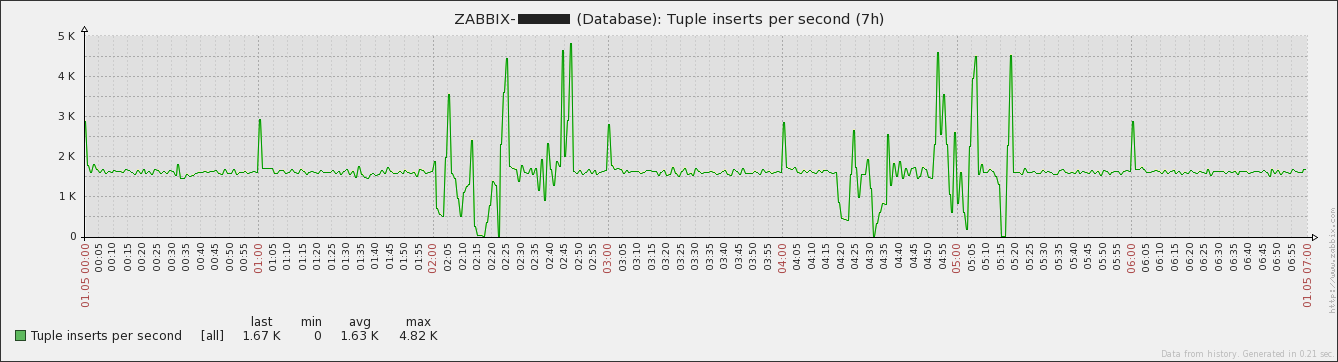
Not sure whether it's relevant or not but there were significant more tuples fetched during the issue. Without having the previously mentioned maintenance period configured Having the maintenance period configured Edit: |
| Comment by Marc [ 2015 May 04 ] |
|
This issue might be a duplicate of |
| Comment by Marc [ 2015 Jun 01 ] |
|
Recently we made some optimizations on the database system used for Zabbix and I thought whether it might be worth to disable the current maintenance created due to this issue. Well, no need to further think about it anymore since the maintenance period ended today (what i completely forgot). Apparently I thought somehow to get it fixed quicker:
Edit: |
| Comment by Oleksii Zagorskyi [ 2015 Jun 26 ] |
|
Lets close current issue in favor of |
| Comment by richlv [ 2015 Jun 26 ] |
|
should we close this as a duplicate of |
| Comment by Marc [ 2015 Nov 23 ] |
|
Reopend to close as duplicate of |