|
Duplicate |
|||
| is duplicated by |
|
graph layout issues | Closed |
[ZBXNEXT-1762] show year on x axis labels Created: 2013 May 28 Updated: 2016 Jan 21 Resolved: 2015 Dec 13 |
|
| Status: | Closed |
| Project: | ZABBIX FEATURE REQUESTS |
| Component/s: | Frontend (F) |
| Affects Version/s: | None |
| Fix Version/s: | 3.0.0alpha4 |
| Type: | Change Request | Priority: | Blocker |
| Reporter: | richlv | Assignee: | Unassigned |
| Resolution: | Fixed | Votes: | 13 |
| Labels: | axis, graphaxislabels, graphs | ||
| Remaining Estimate: | Not Specified | ||
| Time Spent: | Not Specified | ||
| Original Estimate: | Not Specified | ||
| Attachments: |
|
||||||||
| Issue Links: |
|
||||||||
| Description |
|
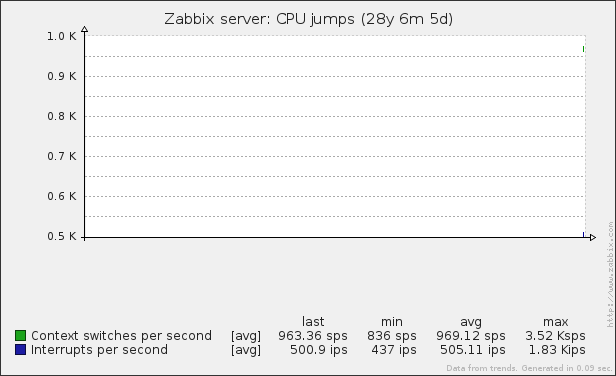
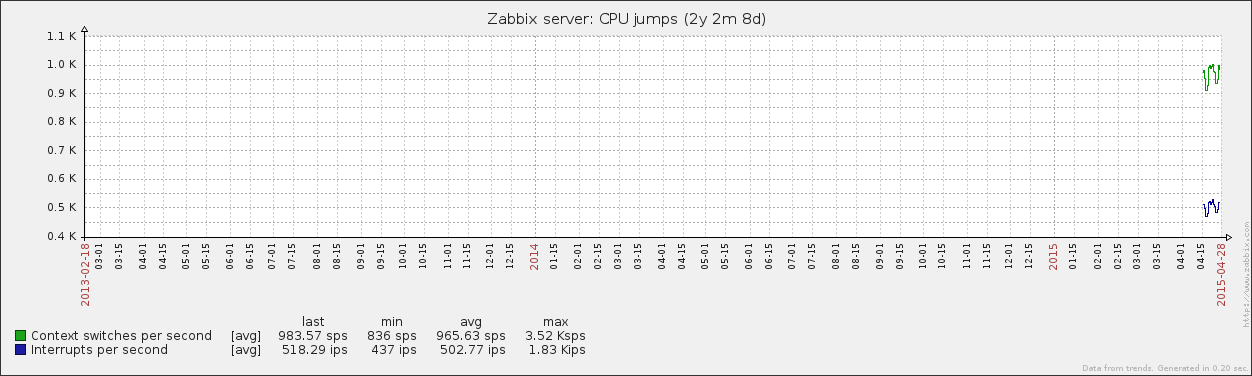
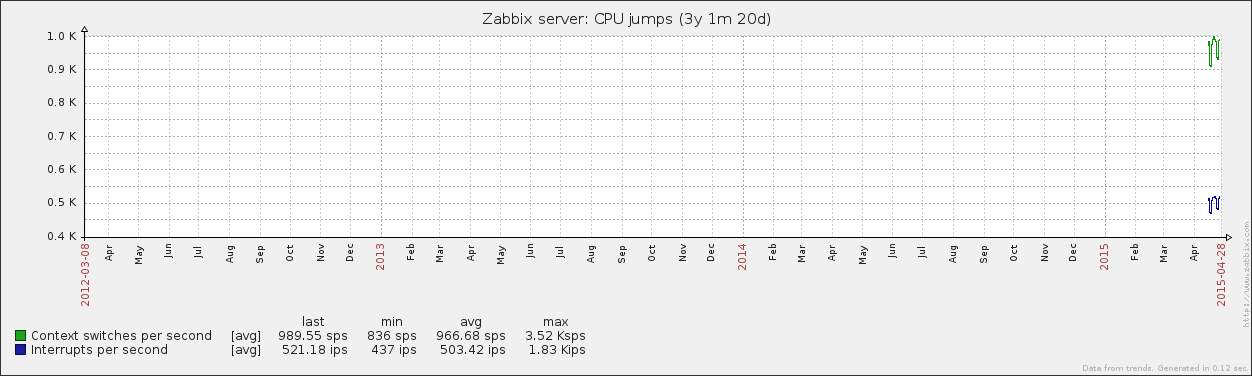
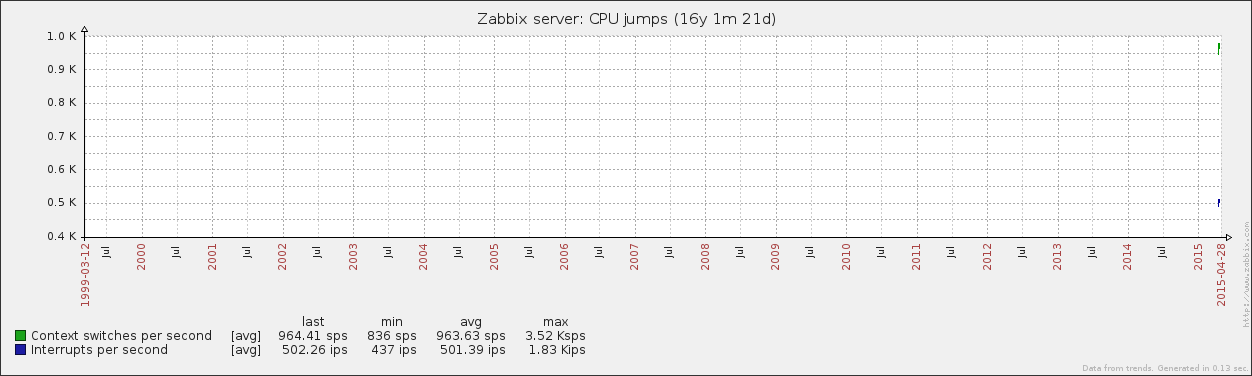
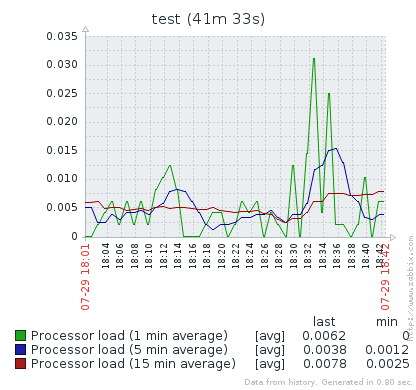
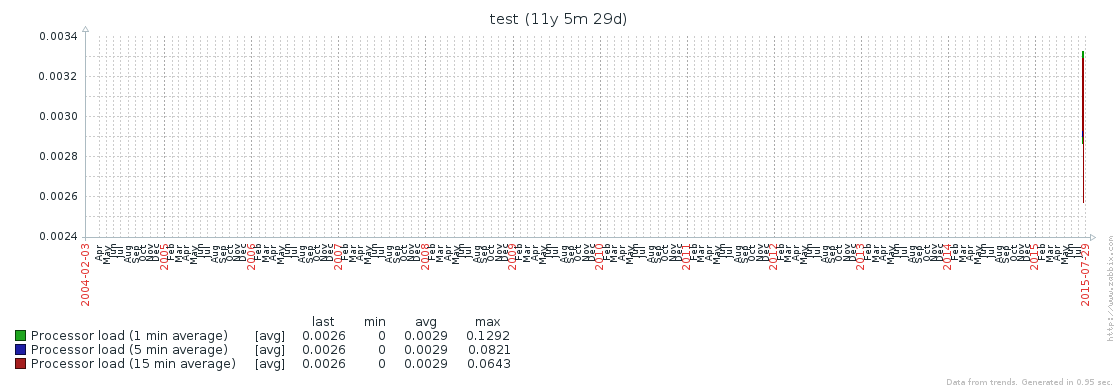
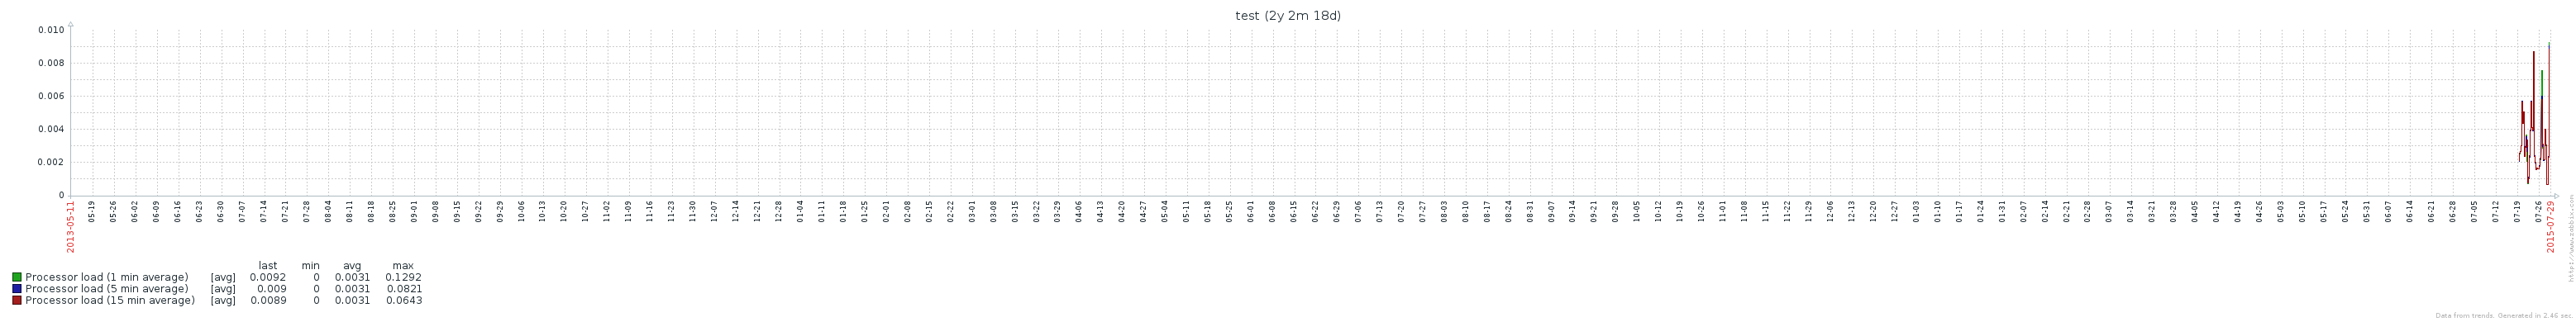
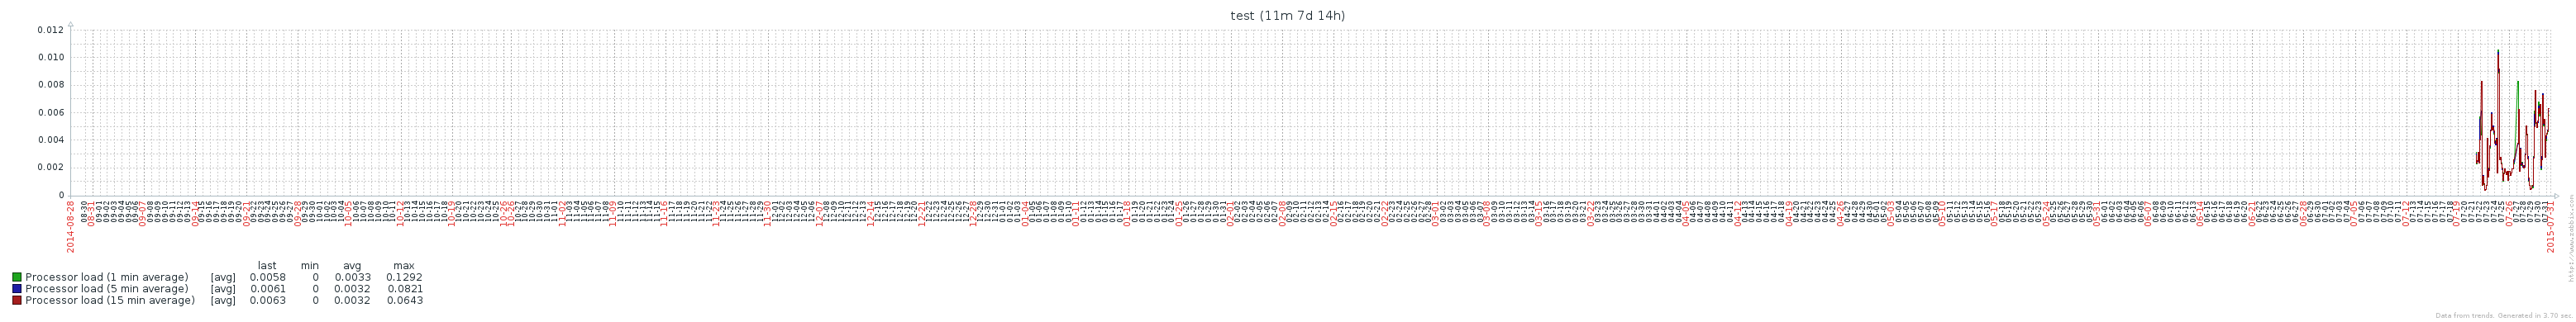
currently looking at a graph that shows data for a couple of years is somewhat challenging - it is not clear where year border is at all. it's not marked in any way or shown on the x axis labels. see the attached graph for an example |
| Comments |
| Comment by Steve mushero [ 2014 Nov 03 ] |
|
Could just use a Vertical line ? Would love to show a vertical colored line for day, week, and month boundaries, too. |
| Comment by Oleg Egorov (Inactive) [ 2015 Apr 28 ] |
|
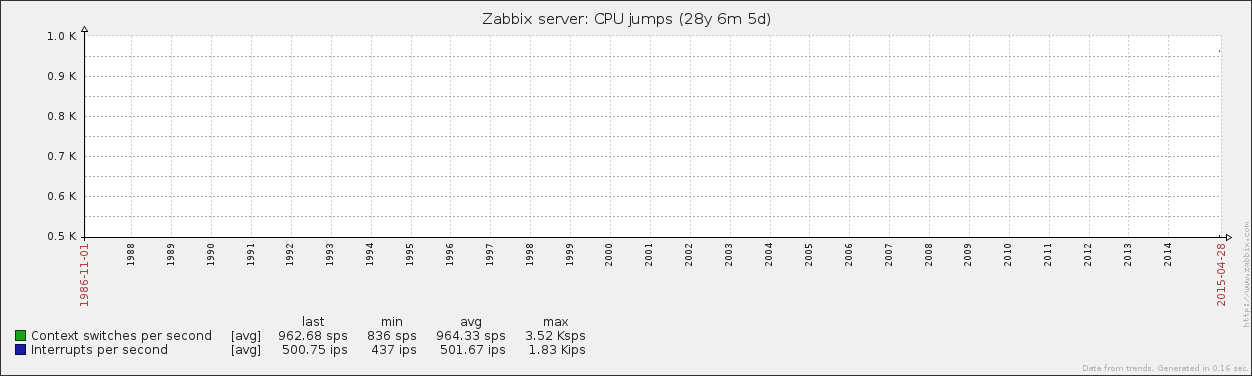
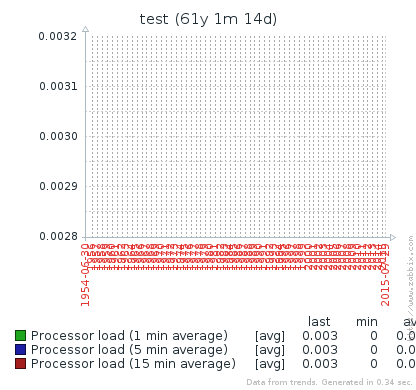
(1) Missed values on X-axis and grid, if selected huge interval. For example 30 years. Issue exist in Zabbix 2.5
FIXED IN r53393 iivs CLOSED |
| Comment by Oleg Egorov (Inactive) [ 2015 Apr 28 ] |
|
(2) No string changes sasha REOPENED Strings added:
Strings removed:
iivs CLOSED |
| Comment by Oleg Egorov (Inactive) [ 2015 Apr 28 ] |
|
Fixed X-axis Added year Added half months Added months Added half years Added huge intervals |
| Comment by Alexander Vladishev [ 2015 May 20 ] |
|
(3) Please do not use variables like SEC_PER_TWO_MIN. Use 2 * SEC_PER_MIN instead. oleg.egorov RESOLVED IN r54132 iivs CLOSED |
| Comment by Alexander Vladishev [ 2015 May 20 ] |
|
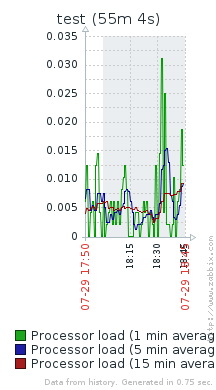
(4) x axis labels can be overlaped chart2.php?graphid=700075&width=350&period=301310000 oleg.egorov RESOLVED IN r54183, r54192 iivs Overlapping occurs at the end of graph
oleg.egorov RESOLVED in r56439 iivs CLOSED |
| Comment by Alexander Vladishev [ 2015 May 20 ] |
|
(5) Year should be always red. oleg.egorov RESOLVED IN r54145 iivs CLOSED |
| Comment by Ivo Kurzemnieks [ 2015 Jul 29 ] |
|
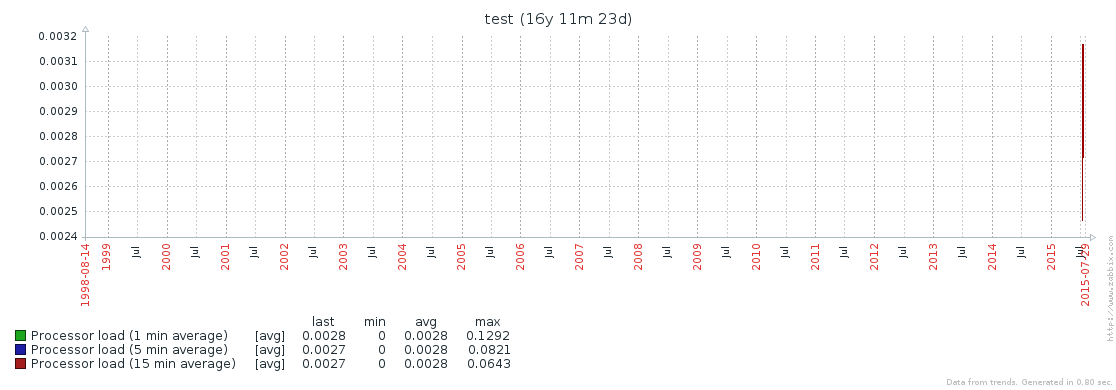
(6) Too many months in years Too many years and they all overlap. oleg.egorov RESOLVED in r56449 and r56450 iivs CLOSED |
| Comment by Ivo Kurzemnieks [ 2015 Jul 29 ] |
|
(7) Can't see year division on 3000px. 600 and 1000px, however, is ok. If no year is shown (it doesn't fit in grid), we could at least add the first month in new year red, so it's easier to identify where it starts. oleg.egorov As discussed with sasha - won't fix. Added week highlighting if changed month. RESOLVED in r56487 iivs CLOSED |
| Comment by Ivo Kurzemnieks [ 2015 Jul 29 ] |
|
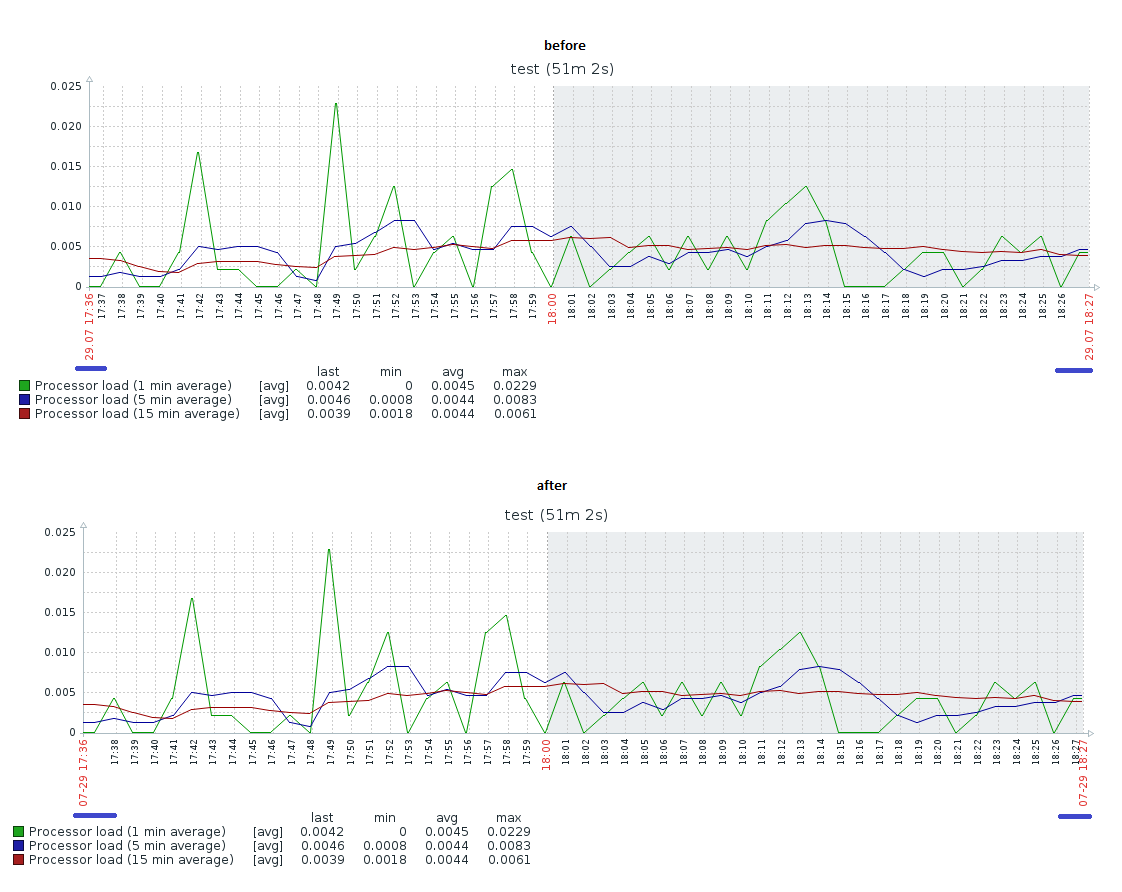
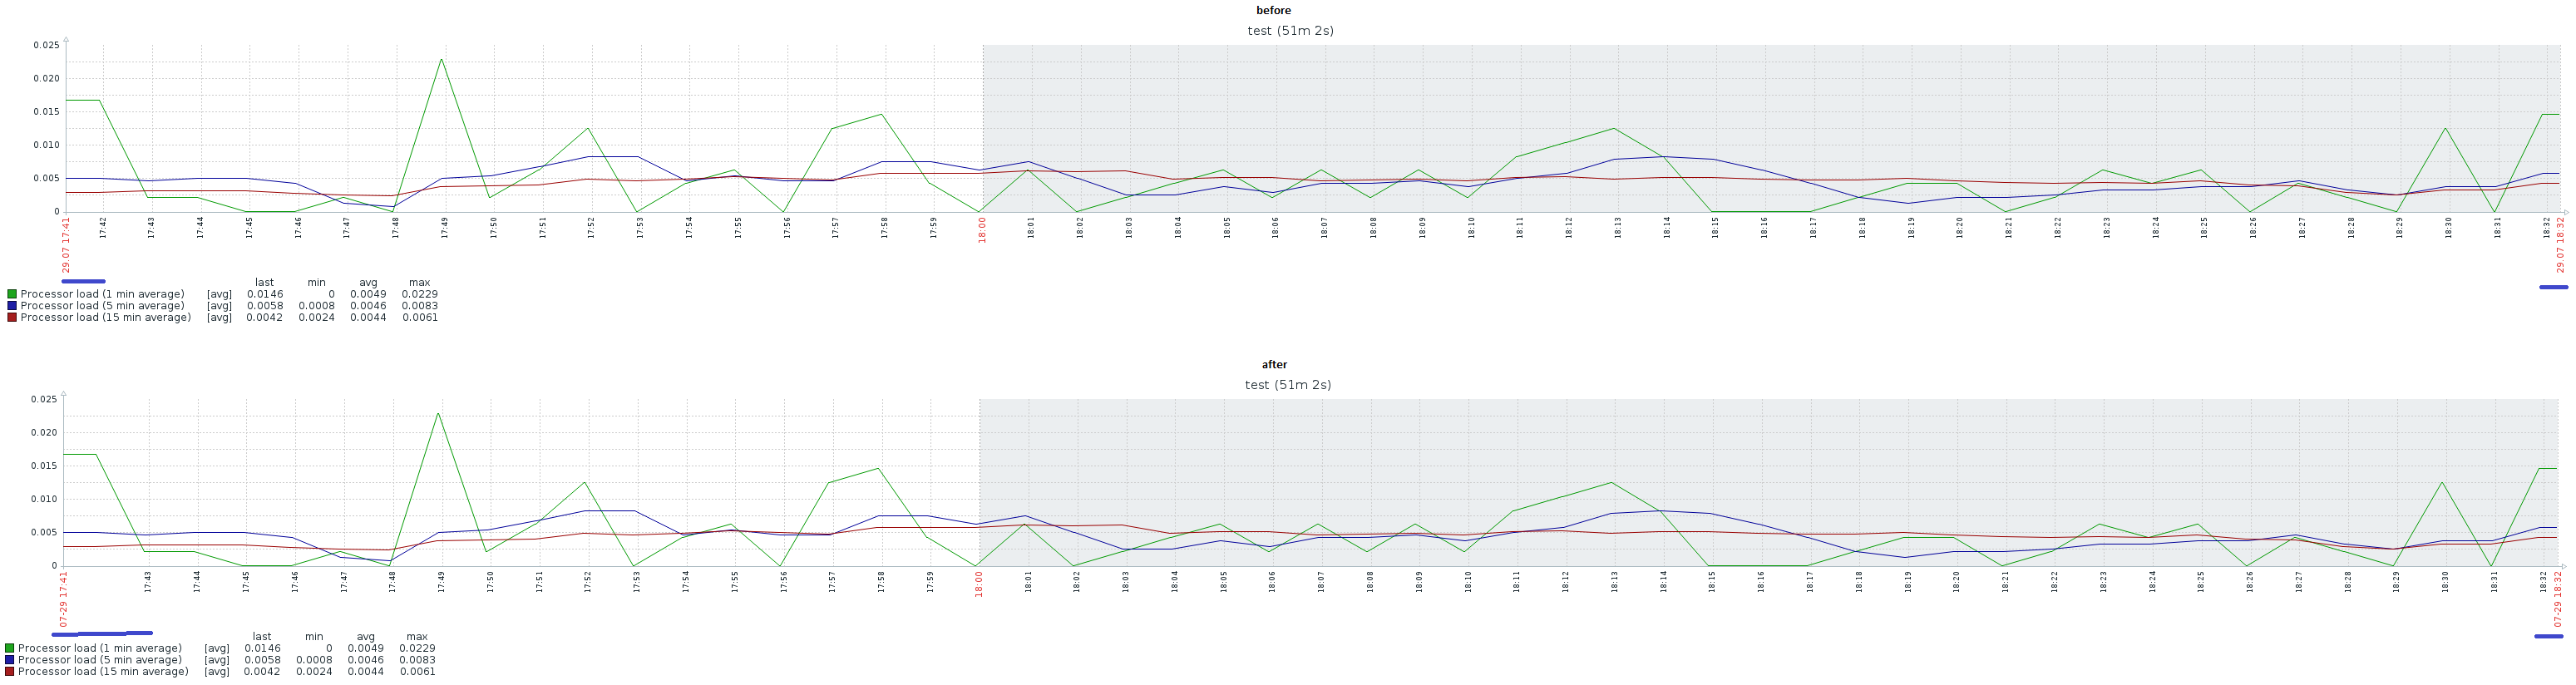
(8) In short periods before we displayed each minute, now the next minute is missing and last minute is displayed twice. When different width (or time difference) before we sometimes displayed last minute twice, but this changed that now first 2 minutes are missing too. Short width has also missing minutes and time overlaps at the end. oleg.egorov Partly issue resolved in (4) in r56439 other part resolved in r56473 iivs CLOSED |
| Comment by Ivo Kurzemnieks [ 2015 Jul 31 ] |
|
(9) Daylight saving time is not taken into account. It displays the date twice in late October and does not mark the date in red in late March. oleg.egorov As discussed won't fix. |
| Comment by Ivo Kurzemnieks [ 2015 Oct 06 ] |
|
(10) When oleg.egorov RESOLVED in r56415 iivs CLOSED |
| Comment by Oleg Egorov (Inactive) [ 2015 Oct 29 ] |
|
(11) RESOLVED in r52271, r53246, r53393 and r53396
oleg.egorov CLOSED |
| Comment by Ivo Kurzemnieks [ 2015 Nov 05 ] |
|
TESTED, but close (11) before merging. |
| Comment by Ivo Kurzemnieks [ 2015 Nov 05 ] |
|
(12) Documentation:
martins-v Updated documentation:
RESOLVED. Please review. oleg.egorov Reviewed and CLOSED |
| Comment by Oleg Egorov (Inactive) [ 2015 Nov 05 ] |
|
Implemented in pre-3.0.0alpha4 (trunk) r56561 |