[ZBXNEXT-2441] Significant performance impact when having Multiple PROBLEM events generation enabled Created: 2014 Sep 05 Updated: 2014 Sep 09 |
|
| Status: | Open |
| Project: | ZABBIX FEATURE REQUESTS |
| Component/s: | Server (S) |
| Affects Version/s: | 2.2.6 |
| Fix Version/s: | None |
| Type: | Change Request | Priority: | Trivial |
| Reporter: | Marc | Assignee: | Unassigned |
| Resolution: | Unresolved | Votes: | 0 |
| Labels: | events, performance | ||
| Remaining Estimate: | Not Specified | ||
| Time Spent: | Not Specified | ||
| Original Estimate: | Not Specified | ||
| Attachments: |
|
| Description |
|
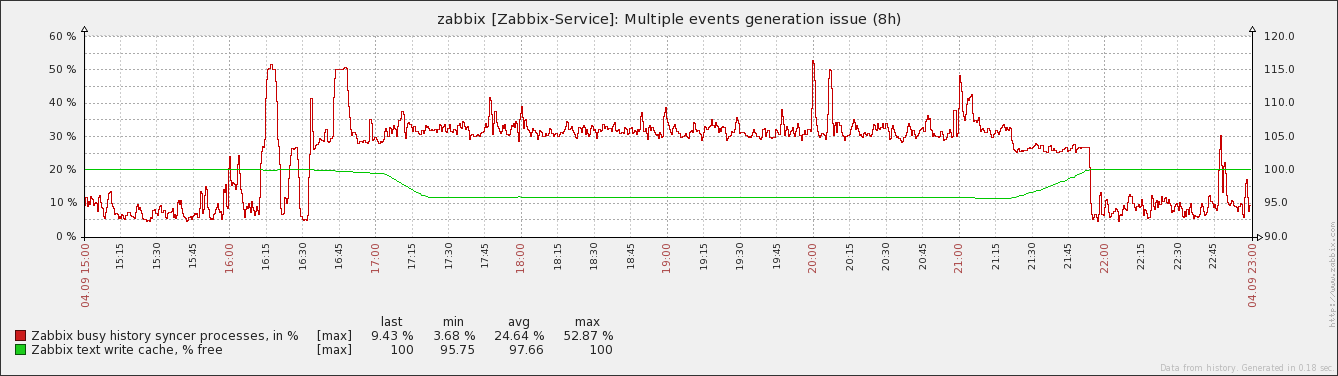
I understand that having Multiple PROBLEM events generation enabled, inevitably causes a performance impact. Anyhow, while reproducing the scenario described in ~16:15 log items were activated
The observed behavior was (beside what already mentioned):
SELECT conditionid,
       conditiontype,
       operator,
       value
FROM   conditions
WHERE  actionid = <actionid>
ORDER  BY condition
SELECT DISTINCT hg.groupid
FROM   hosts_groups hg,
       hosts h,
       items i,
       functions f,
       triggers t
WHERE  hg.host
SELECT DISTINCT i.hostid
FROM   items i,
       functions f,
       triggers t
WHERE  i.itemid = f.itemid AND
       f.triggerid
SELECT templateid
FROM   triggers
WHERE  triggerid = <triggerid>
Just in case these statements are the cause for the performance difference, I wonder whether moving the related information into the configuration cache might speed up things... |
| Comments |
| Comment by Aleksandrs Saveljevs [ 2014 Sep 08 ] |
|
Marc, could you please describe what would be your desired outcome of this feature request? Enabling "Multiple PROBLEM events generation" means that an event is generated whenever a trigger evaluates to PROBLEM, as can be seen in process_trigger() function in src/libs/zbxdbhigh/db.c, and that leads to event processing sequence, as you observed with the SQL queries. Function process_trigger() also walks dependencies of that trigger and, most importantly, executes a database query to update "lastchange" field in the database. So a significant increase in server load is expected. The fact that one history syncer is busy for a long time is expected, too, because at most one history syncer can process one item's values, which is the case if you send millions of values for a single log item. If that is the main point of the report, then the issue might be better handled in already reported issues like |
| Comment by Marc [ 2014 Sep 08 ] |
|
The outcome, if that's possible at all, should be faster processing of cached values when having "Multiple PROBLEM events generation" set. I didn't had concerns about the blocked history syncer. It was just something i noticed and wanted to mention to draw the complete picture of my observation. However, what concerned me was the fact that the time after the high load (~17:15+ and ~21:20) the text cache appeared effectively not to be cleared anymore. Subjectively it seemed to grow by the rate of regular incoming text based data. I've no certain idea about the real root cause yet and thus no idea how it could be improved. Btw, it turned out that there were only two hosts with limited logging involved for testing. So the total count of send log values were just ~300k log values. Edit: Edit: |
| Comment by Aleksandrs Saveljevs [ 2014 Sep 09 ] |
There is no such (hardcoded) limit. What lead you to make this conclusion? |
| Comment by Marc [ 2014 Sep 09 ] |
|
I picked three or four blocks of events that were made at the very same second. These blocks always consisted of exactly 400 events. |