|
Duplicate |
|||
| is duplicated by |
|
New graph widget: show point in time ... | Closed |

[ZBXNEXT-4819] Graph widget containing date & time on hover?.. Created: 2018 Oct 21 Updated: 2024 Apr 10 Resolved: 2019 Mar 04 |
|
| Status: | Closed |
| Project: | ZABBIX FEATURE REQUESTS |
| Component/s: | Frontend (F) |
| Affects Version/s: | 4.0.0 |
| Fix Version/s: | 4.0.6rc1, 4.2.0beta2, 4.2 (plan) |
| Type: | Change Request | Priority: | Trivial |
| Reporter: | Giedrius Stasiulionis | Assignee: | Miks Kronkalns |
| Resolution: | Fixed | Votes: | 8 |
| Labels: | None | ||
| Remaining Estimate: | Not Specified | ||
| Time Spent: | Not Specified | ||
| Original Estimate: | Not Specified | ||
| Attachments: |
|
||||||||
| Issue Links: |
|
||||||||
| Team: | Team B | ||||||||
| Team: | |
||||||||
| Sprint: | Sprint 47, Dec 2018, Sprint 48, Jan 2019, Sprint 49 (Feb 2019) | ||||||||
| Story Points: | 0.5 | ||||||||
| Description |
|
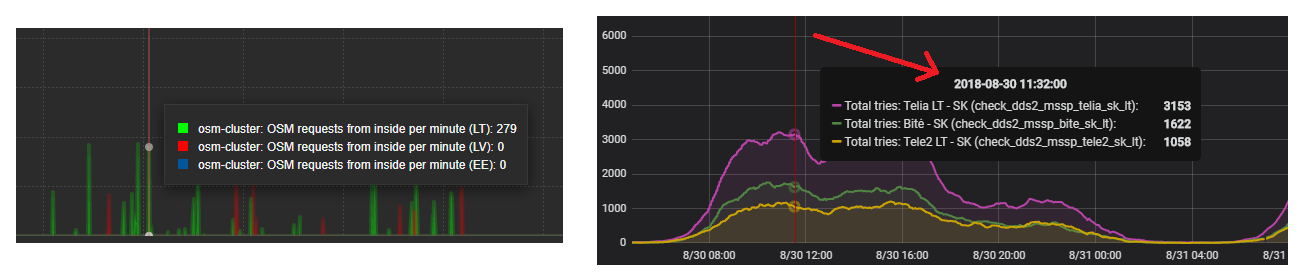
Could the widget be improved in a way, visible in attached image (comparison with Grafana)?.. I think that would be very useful, because now you can only approximately guess, where in time have you had an interesting peak
|
| Comments |
| Comment by Marc [ 2018 Oct 22 ] |
|
Since there is no guarantee that measuring points are from the same time, the time displayed should possibly correspond to the crosshair. |
| Comment by Giedrius Stasiulionis [ 2018 Oct 22 ] |
|
They don't have to be from the same time, same as in Grafana... Each collected item value has the timestamp, when it was collected, and that is enough. Zooming out should provide each (say) fifth value and so on, until you reach point when you retrieve data from trends. Values in trends will also have timestamps... |
| Comment by Miks Kronkalns [ 2019 Feb 18 ] |
|
Implemented in development branch svn://svn.zabbix.com/branches/dev/ZBXNEXT-4819 |
| Comment by Miks Kronkalns [ 2019 Feb 26 ] |
|
Fixed in:
|
| Comment by Miks Kronkalns [ 2019 Feb 27 ] |
|
Documentation updated: |