|
Causes |
|||
| causes |
|
TimescaleDB - further improvements | Closed |
| caused by | ZBXNEXT-714 | need scalable alternative for the his... | Open |

[ZBXNEXT-4868] Support of TimescaleDB Created: 2018 Nov 21 Updated: 2024 Apr 10 Resolved: 2019 Feb 10 |
|
| Status: | Closed |
| Project: | ZABBIX FEATURE REQUESTS |
| Component/s: | Server (S) |
| Affects Version/s: | 4.0.0 |
| Fix Version/s: | 4.2.0alpha3, 4.2 (plan) |
| Type: | New Feature Request | Priority: | Trivial |
| Reporter: | Rostislav Palivoda (Inactive) | Assignee: | Alex Kalimulin |
| Resolution: | Fixed | Votes: | 6 |
| Labels: | None | ||
| Remaining Estimate: | Not Specified | ||
| Time Spent: | Not Specified | ||
| Original Estimate: | Not Specified | ||
| Attachments: |
|
||||||||||||
| Issue Links: |
|
||||||||||||
| Team: | |
||||||||||||
| Sprint: | Sprint 46, Nov 2018, Sprint 47, Dec 2018, Sprint 48, Jan 2019 | ||||||||||||
| Story Points: | 5 | ||||||||||||
| Description |
|
Zabbix has been trying to find a scalable trouble-free solution for storage of time series data for ages. Recent release of TimescaleDB 1.0 looks very promising as it delivers zero-configuration out-of-the-box partitioning and therefore much better scalability and lower maintenance cost comparing to MySQL and PostgreSQL. Note that TimescaleDB is a combination of standard PostgreSQL and TimescaleDB plugin. |
| Comments |
| Comment by Stefan [ 2019 Jan 22 ] |
|
that is very intersting, do you have some benchmarks or other performance measurements? how does it scale with zabbix? |
| Comment by Alex Kalimulin [ 2019 Jan 24 ] |
|
Implemented in:
|
| Comment by Dimitri Bellini [ 2019 Jan 28 ] |
|
Good news but on Zabbix Whats New i read "TimescaleDB is supported with Zabbix server only.", what does it mean? |
| Comment by Alex Kalimulin [ 2019 Jan 28 ] |
It means that Zabbix proxy is not supported. Thanks for pointing out, the docs updated! |
| Comment by Dimitri Bellini [ 2019 Jan 28 ] |
|
Hi Alex, |
| Comment by T.J. Yang [ 2019 Jan 29 ] |
|
Can you also update the zabbix 4.2 doc when Zabbix server need TimescaleDB CE or Enterprise version ? Looks to me we only need CE version to get DB table auto-partitioning from https://www.timescale.com/pricing
|
| Comment by Alex Kalimulin [ 2019 Jan 29 ] |
Enterprise version of TimescaleDB is not required. 4.2 supports OSS version of TimescaleDB and is not dependent on TLS-licensed features included in CE (in fact, the 1st TLS-licensed version just coming out today) that's why we just put minimum supported version (1.0) in the requirement page. |
| Comment by Sebastian YEPES [ 2019 Jan 30 ] |
|
Finally you guys are looking into this! We have internally been using TSDB for the past year and its been working like a charm, we have created hypertables on events, alerts, history* and trends* and its been a world changer in terms of DB management / performance. One of the main issues we have been facing are the Zabbix upgrades, currently Zabbix does not support or have the knowledge that these tables are now hypertables. It fails because of the foreign keys and other structural changes.. So for the moment we are "Manually" upgrading our DB schema.
@Alex, Are you going to fully support TSDB and Zabbix upgrades?
|
| Comment by Alex Kalimulin [ 2019 Jan 30 ] |
Upgrading shouldn't be a problem. But please note currently TSDB support is in experimental status. We'll decide how to progress with further TSDB support as soon as we collect enough of user feedback. |
| Comment by Raymond Kuiper [ 2019 Feb 02 ] |
|
Really happy to see Zabbix possibly moving to support TimescaleDB. |
| Comment by T.J. Yang [ 2019 Feb 02 ] |
|
I am thinking of deploying a zabbix back-ended with postgresql as primary and replicate its data over a 10ms WAN pipe to aother DC,via repmgr. Now with TS db supported by coming zabbix 4.2, This is even more interesting, one can design a Zabbix Geo fail-over with auto table partitions(by TSDB). Things I don't know is how to calculate is that what is nvps value that will saturate the 10ms WAN pipe when doing repmgr replication ? PS: Here is my workbook a "Zabbix TimeScale DB" POC. |
| Comment by T.J. Yang [ 2019 Feb 03 ] |
|
I got my POC working following the doc. One suggestion is to increase the max_connection from 20 upward( mine is 40). Otherwise following error showed in my poc instance.
11421:20190203:092313.774 [Z3001] connection to database 'zabbix' failed: [0] FATAL: sorry, too many clients already
|
| Comment by T.J. Yang [ 2019 Feb 04 ] |
|
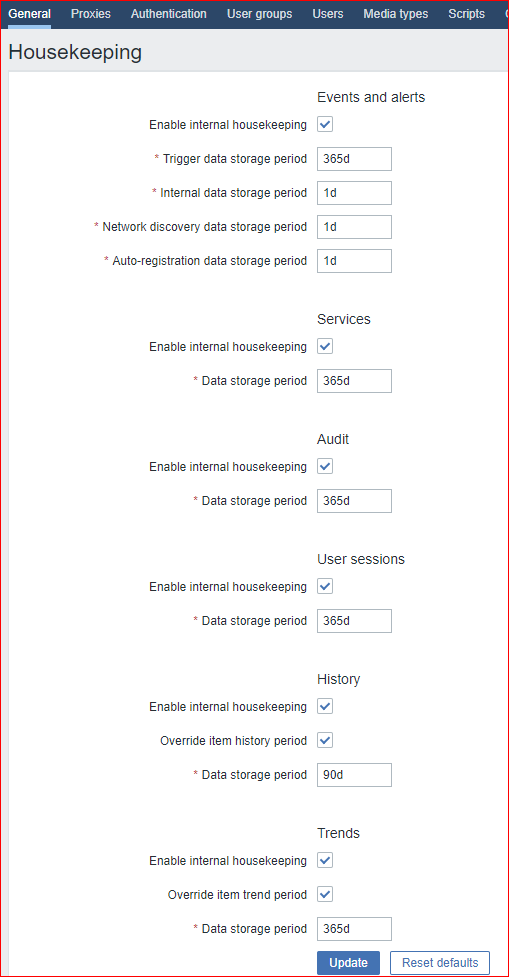
Following screenshot is from 4.0.3 Zabbix. Same as the one in 4.2 alpha3. Shouldn't "TimeScale DB" be displayed somewhere ?
|
| Comment by Alex Kalimulin [ 2019 Feb 05 ] |
tjyang, no, just make sure Override item history and trend periods are on. If you applied timescaledb.sql script and it ran successfully you'll see this string db_extension: timescaledb in zabbix_server.log after configuration sync. |
| Comment by T.J. Yang [ 2019 Feb 05 ] |
|
@Alex Kalimulin Thanks for this tip. I do find this string in my test environment. Is following string correct ?
But my concern still remain. Shouldn't there be a place somewhere in GUI, to inform login user you are operating on a Zabbix server with TimeScale DB ? |
| Comment by Glebs Ivanovskis [ 2019 Feb 05 ] |
|
There is no indication which backend is used (MySQL, PostgreSQL, Oracle, IBM DB2), why would TimescaleDB be special? |
| Comment by T.J. Yang [ 2019 Feb 05 ] |
|
@Glebs Ivanovskis, you got the point. I rest/withdraw my concern on displaying DB backend. |
| Comment by Alex Kalimulin [ 2019 Feb 05 ] |
|
| Comment by T.J. Yang [ 2019 Feb 05 ] |
|
Thanks Alex, I got following string as you pointed out, after setting debug level to 5.
|
| Comment by Dimitri Bellini [ 2019 Feb 05 ] |
|
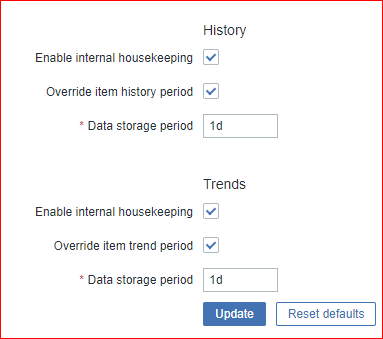
@T.J. Yang: You are right! If we would like to use TimescaleDB i think is good option in Zabbix, to force the option "Override history/trend period" in Administration/General to simplify the initial configuration. |
| Comment by Alex Kalimulin [ 2019 Feb 05 ] |
dimitri.bellini When you run timescaledb.sql the script sets "Override history/trend period" options already so no problems here. If you decide to unset one of these options later on Zabbix will not prevent you from doing so, you may have your reasons. |
| Comment by T.J. Yang [ 2019 Feb 05 ] |
|
Hi all
|
| Comment by Dimitri Bellini [ 2019 Feb 05 ] |
|
@Alex: Ok very good! I have missed that feature |
| Comment by Alex Kalimulin [ 2019 Feb 05 ] |
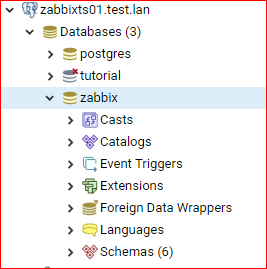
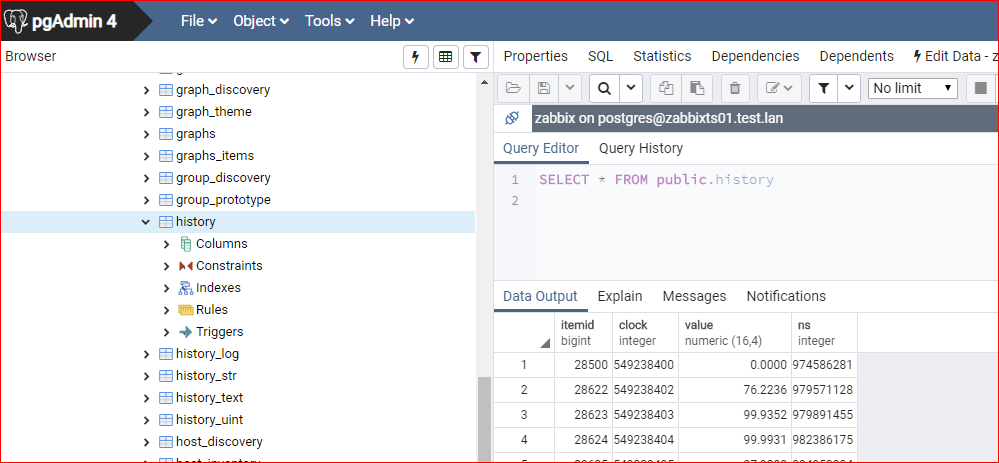
tjyang There are the following history tables which are currently under TimescaleDB control:
You can check the oldest item in the historic table by running the following SQL: select to_timestamp(min(clock)) oldest from history_uint; |
| Comment by T.J. Yang [ 2019 Feb 05 ] |
|
Hi Alex, From the output, looks like 1 day old retention is not working. I am still getting 02/03(two days) old data.
|
| Comment by Alex Kalimulin [ 2019 Feb 05 ] |
tjyang This may be normal and subject to various conditions such as frequency of historic data and partition size. Under TimescaleDB Zabbix deletes partitions rather than individual records. Which means that server does not touch any partitions which contain data that is newer than your housekeeping settings. For example, if partition #2 stores days 5, 4, 3 and partition #1 stores days 2, 1 and 0 (today), and you have 1 day retention period then only partition #2 will be deleted during next housekeeping cycle. Partition #1 will be deleted only when ALL records in the partition will be older than your retention period. |
| Comment by T.J. Yang [ 2019 Feb 05 ] |
|
Alex, thanks for the explanation, I will add more zabbix agents, wait and see. In the mean time, I will study more on postgresql and timescaleDB. |
| Comment by Jan Ostrochovsky [ 2019 Feb 07 ] |
|
glad to read this, guys several questions on my mind:
|
| Comment by Alex Kalimulin [ 2019 Feb 07 ] |
The current implementation doesn't change the way the frontend queries historical data. However selects from chunked tables undergo TSDB range exclusion optimizations automatically so you may see performance improvements described in the post you mentioned.
1 day is just a sensible default, not a universal recommendation. If you feel 1 day doesn't match your history data rates you can always change it by calling set_chunk_time_interval().
Indeed, the script uses adaptive chunking to set up hyper-tables. TSDB has deprecated adaptive chunking very recently so I hope they are not removing this feature right away. In fact, their main site still lists adaptive chunking as TSDB's headline feature: "TimescaleDB can dynamically adapt the interval to optimize performance" (https://www.timescale.com/how-it-works)
From what I see - yes, at least for now:
Deprecate adaptive chunking.
The current implementation of adaptive chunking, as often employed by users, is a failed experiment.
...
we decided to deprecate it and its current API
altogether to ensure overall stability in the system, with the potential
to revisit/reimplement in the future
(Github)
Follow |