|
this would probably burn horribly with thousands of hosts in a single group, so such environments should be taken in consideration
|
|
I think the request is for graphs for a specific host only...
that's the way I understood it, and that's the feature I voted for ...
|
|
Yeah, I also requested this feature to be available, when single host is selected.
|
|
There was an unofficial patch for it back in 2006, that was working great.
Maybe this old forum topic helps:
http://www.zabbix.com/forum/showthread.php?t=3064
|
|
charts.php.1.8.10.diff
quick & dirty patch against 1.8.10 frontend, displays all graphs of an host in Monitoring/Graphs when no graph is selected.
|
|
charts.php.1.8.10-2.diff
more polished version: each listed graph img has a name, and is clickable (click opens single graph window).
|
|
I don't see this request as a duplicate of bug ZBX-4100 resp. feature request ZBXNEXT-1120 . While this last bug suggests that a specific graph should be viewed for all
hosts of a group, the request here is to have a "show all" entry allowing to display all available graphs of a given host.
|
|
Here's my working version of charts.php diff, based on charts.php.1.8.10-2.diff which shows always all graphs, no matter if you selected one or you don't.
This patch only shows all graphs when you select "not selected" in dropdown, in other words, when graphid is 0.
|
|
Update for 2.0.0. I got a warning about Undefined Index for S_GRAPHS. Changed it to "**". It seems locale changed in 2.0.0.
Just wanted to say thanks for this patch. It has been very helpful for me.
|
|
Fixed Patch.
|
|
Hi, Nathan.
Your Patch doesn't work in Zabbix 2.0.3. It has other charts.php file. Can you please fix your patch?
|
|
Hi, would you be able to quickly patch charts.php for 2.0.3? it worked great for 2.0.0 cheers!
|
|
also a patch for 2.0.4 would be nice 
http://www.zabbix.com/forum/showthread.php?p=123660#post123660
|
|
will this feature be implemented in one of the next releases?
|
|
it's not planned for short term : https://zabbix.org/wiki/Docs/roadmap
|
|
pity - you are right. I did not know the roadmap yet.
but this would really be a nice feature to see all details of the server on one site
|
|
a patch for 2.0.4 you can find here:
https://www.zabbix.com/forum/showthread.php?p=125155
thank you higebu!!!!
|
|
The patch on the forum is broken, see my comment there!
|
|
Source:
https://www.zabbix.com/forum/showthread.php?p=125155
Thanks to Higebu!
|
|
Hi there.
I've just added "zabbix_2_0_4_and_higher.patch". It worked for a zabbix-2.0.9 installation.
Instructions to apply:
1. Dowload the file to /tmp for instance
2. Go to Zabbix php frontend installation:
cd /srw/www/zabbix-2.0.9
3. Apply the patch (use sudo if files doesn't belongs to you):
sudo patch -p1 < /tmp/zabbix_2_0_4_and_higher.patch
Source of the patch:
https://www.zabbix.com/forum/showthread.php?p=125155
Many thanks Higebu!
|
|
Attached patch zabbix_2_0_4_and_higher-flickerfreescreen.js.patch might solve the issue mentioned in corresponding forum thread.
Anyhow, haven't extensively investigated this issue and the patch might break other things.
|
|
The patch zabbix_2_0_4_and_higher-orderByGraphType.patch extends zabbix_2_0_4_and_higher.patch by ordering graphs.
Graphs are separately ordered by name for 'graph' and 'pie' charts.
Charts of graphtype 'normal' and 'stacked are displayed first. Charts of graphtype 'pie' and 'exploded' come then.
|
|
Thank you for the patches, the end result is just what I was looking for. Hopefully we'll see it eventually on the roadmap.
Cheers!
|
|
Uploaded ZBXNEXT-75.patch
Features:
-Tested with Zabbix 2.0.4+ and 2.2
-Merges in just one file zabbix_2_0_4_and_higher.patch, zabbix_2_0_4_and_higher-orderByGraphType.patch and zabbix_2_0_4_and_higher-flickerfreescreen.js.patch
|
|
Hi Javier,
Got a quick question: if we adjust the date/time selection all the graphs are adjusting or just the first one ?
|
|
Hi Christian,
All of them are updated.
Cheers
|
|
Hi Javier,
Looks very good, better than previous patches exactly because of updating all graphs when updating the date/time selection.
I have one question. If all the graphs are Normal or Stacked how are the graphs ordered ? I can't understand how the graphs are ordered...
|
|
Btw, I simply don't understand why this patch is not included into Zabbix source. The code is quite simple and these (very useful) patches are quite easy to add.
|
|
Working nicely, but the results are terrible to overlook or search through. What if there were a textual index at the top using HTML anchors to go to the graphs?
|
|
Convenient but inefficient. You'll have many inexperienced users (in my case my own mates), clicking many times that option, for rendering many graphics, some of them not interesting to them.
Besides that, this feature is somehow implemented in 2.2 screens. You can make 1 screen, and apply it to whatever host you want, just by using the filter menues. Check it!
|
|
It becomes convenient when one got a lot of different host assets like Linux/Unix/Windows/... hosts, load balancers, firewalls, switches, databases, routers, rooms, ...
This feature allows to see very easily at a glance what's going on for a device - without any initial effort
To be honest I'm not aware of the screen improvements in 2.2 over 2.0. In case dynamic elements are meant to be the better solution (wich are available in 2.0 too), that would still need to create/maintain at least one screen per host asset.
Anyway, I agree this patch is not the final solution but it is a first step.
Beside removing dirty hacks like zabbix_2_0_4_and_higher-flickerfreescreen.js.patch it needs further thoughts how to be best implemented.
I could imagine for instance to opt-out graphs from such kind of view.
|
|
Added to Marc comments: is hard to work with screens (even with 2.2 improvements), the improvements are just minor when it comes to using diff templates for monitored hosts.
|
|
BTW ZBXNEXT-75.patch works with zabbix-2.2.1 as well.
|
|
ZBXNEXT-75.patch works with zabbix-2.2.2 as well.
|
|
also works for zabbix-2.2.3 as well
|
|
Thanks you so much! I previously used munin-cgi for showing all monitoring graphs on one page and was very much missing that with zabbix. This fix worked great.
|
|
Folks, this feature is great! We love it.
How about doing it the opposite way as well? I mean, i need to see all "eth0" traffic for a given group. To this date, i create the screens manually. This is useful as well.
|
|
Filipe, what you request is ZBXNEXT-1120 and/or ZBXNEXT-570 
|
|
Attached patch zbxNext75-2.2.5.patch is based on ZBXNEXT-75.patch. is based on ZBXNEXT-75.patch.
It differs by:
|
|
Great job!
Is there a chance of having a form that would filter graphs by their names?
|
|
Attached patch zbxNext75-2.2.5-MultiSelectFilter.patch is a first try of adding filter functionality:
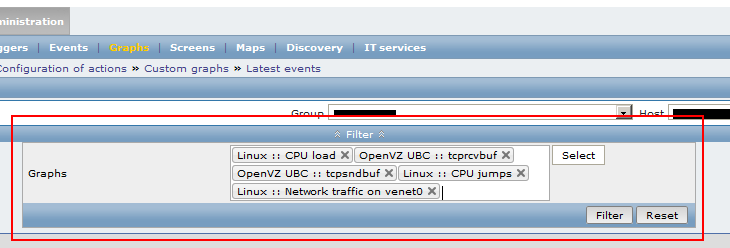
The filter is only displayed when a host but no graph is selected.
It supports auto-search as well as making a selection via pop-up.
When filter is unset it behaves like the origin implementation and shows all graphs.
Since it's the result of a PoC it lacks of a clean visual integration, persistent filter and is admittedly quite 'dirty' coded.
Edit:
The patch is a cumulative patch.
|
|
Works like a charm. Thanks a lot.
Would it be difficult to extend this filter by adding functionality similar to the filter from configuration->hosts->items tab , which would be displaying all graphs with defined word in the name? It would be more convenient in cases where there is lots of graphs on particular host.
As an example: on the 24-interface switch, I've 24 traffic graphs on physical interfaces (iwth 'traffic' in their names), 24 graphs with optical parameteres (with 'power' in their names) and 4 of them are connecting to different sites of one client (whose name is in all related to him graph names). All graph names contains a name/description of interface.
Typing 'traffic' in search field of filter would display 24 graphs, typing 'Ge0/1' would display 2 graphs (traffic and power) and typing 'clients name' would display 8 graphs (4 traffics and 4 powers).
|
|
Hi,
I just migrate 2.2.6 to 2.4.1.
Be aware, now ZBXNEXT-75.patch and 2.4 : there are big problem of performance processes httpd apache when a user look a item with 15-20 graph at the same page.
My CPU is 100% and load average more than 15 !!!!!
In 2.2.6 i dont have this problem.
So, ZBXNEXT-75.patch can be corrected?
tks
|
|
zbxNext75-2.2.5.patch works in zabbix 2.4.4 apparently without any performance issue.
|
|
Have any of you installed zbxNext75-2.2.5-MultiSelectFilter.patch succesfully on zabbix 2.4.4? How to do this?
|
|
I've made an alternative version of this patch for 2.4.3, with graphs being displayed in two columns and paging:
http://blog.sepa.spb.ru/2015/08/zabbix-graphs-improvements-patch.html
|
|
sepa, sweet! but please attach it to this ticket instead of linking to an external site.
|
|
Patch became too large to attach to this ticket, moved it to separate git repo: https://github.com/sepich/zabbixGrapher
It is now js page which is easily integrated to Zabbix and provides with live graphing of any existing Graphs or raw Items.
|
|
Thanks sepa, that's a huge improvement !!
Would it be difficult to add an option to choose entire host group at once (without having to select particular hosts) from which user could search graphs / items?
|
|
Nice feature, implemented.
But you'd better to create issue (or pull-request on github to not spam this thread.
|
|
Here is nice page http://www.zabbix.com/development_services.php where on the bottom of this page is possibility to Contribute on specific feature. I think that it can be way how to promote some feature requests and to do something like crowdfunding on specific feature. Zabbix dev setup price and we can contribute on this feature I think it can be good way how to pay for each feature and to to pay whole development by one customer.
|
|
And For Zabbix 3.0. Any 1?
i only found this:
https://github.com/OneOaaS/graphtrees
|
|
It can be found here: https://github.com/sepich/zabbixGrapher
|
|
We are going to implement a new view available from Monitoring->Hosts (also new view) that will display all user defined graphs for a selected host with a filter by graph name. Therefore it will be very easy to see, for example, all graphs or graphs matching "cpu", "disk", etc on a single page. It is coming in Zabbix 5.0, see ZBXNEXT-5694 to follow progress.
|
Generated at Wed Apr 01 04:42:48 EEST 2026 using Jira 10.3.13#10030013-sha1:56dd970ae30ebfeda3a697d25be1f6388b68a422.