|
This is an issue for our Zabbix team, particularly, the new Graph widget is needed. Using wildcard patterns in the Graph widget in a host dashboard would allow things like graphing all items created by a LLD discovery rule. If this is trivial, it would be great to get this functionality soon.
|
|
mdeforest , it is coming in Zabbix 6.4!
|
|
alexei That is great news! Finally we can fully utilize dashboard in that case, thanks!
|
|
@Alexei Vladishev great news! Looking forward to the release of 6.4!
|
|
Seems to have become quiet around this point. Is it really still coming in 6.4. ?
|
|
It is not coming in 6.4 unfortunately. It was postponed to Zabbix 7.0 LTS.
|
|
Implemented in development branch feature/ZBXNEXT-8086-6.3
|
|
Implemented in 7.0.0alpha1 (master) 475c0aed3fd
|
|
Documentation (7.0) updated.
Zabbix Manual:
Developer Center:
|
|
Hi DevTeam,
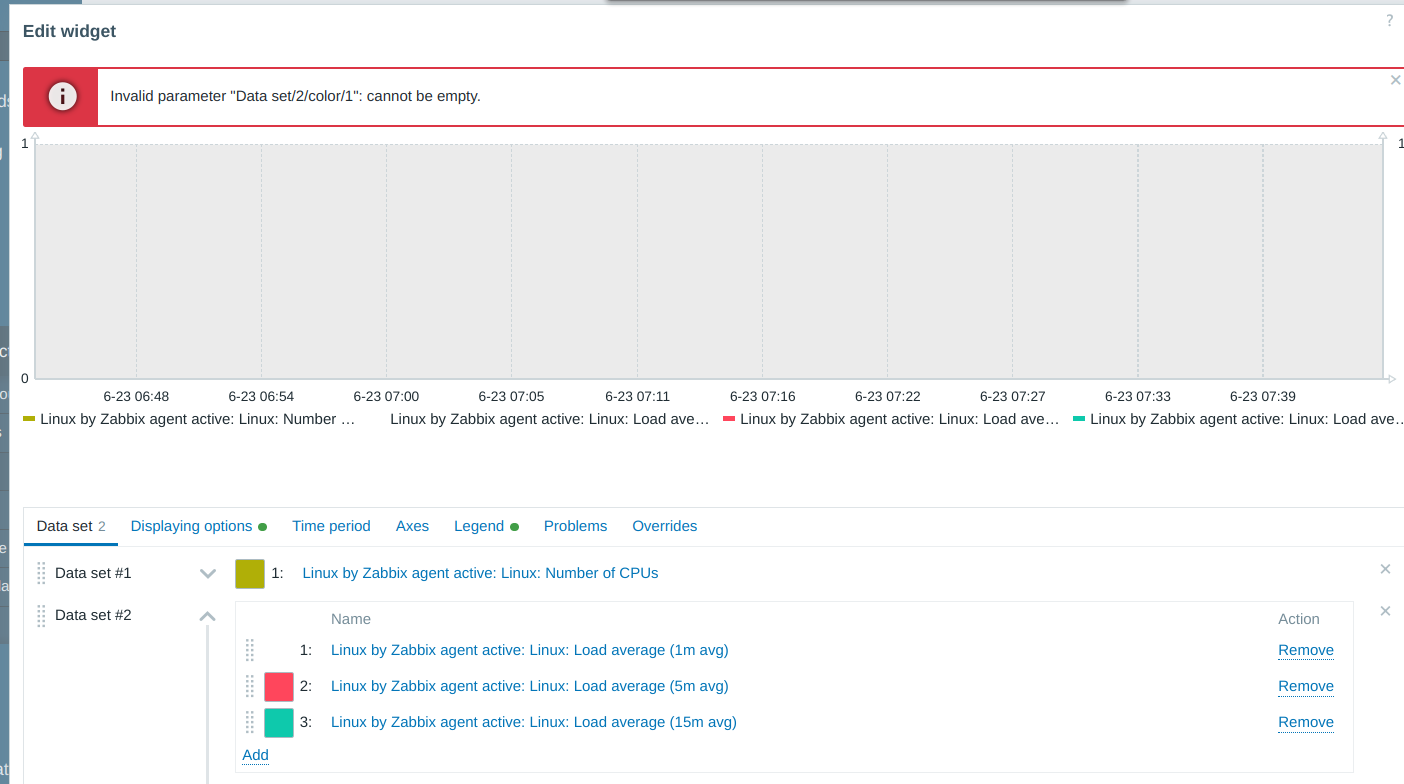
I have play with the latest Zabbix 7.0Alpha2 and I saw a bug on the widget "Graph" when i want to add a new "Item List" dataset.
If I select multiple Items the first one it's added with a "blank" color dataset and I can not change it.
Please see my screenshot.
BTW :Great work guys!
Thanks so much
|
|
Hi, dimitri.bellini!
Thank you for sharing your experience!
I was not able to reproduce this bug. Could you please give step by step instructions?
|
|
Hi Zabbix devs,
I found a pretty big limitation in host dashboards still. Some widgets in (host) dashboards use patterns for items (like graphs and pie charts do) example:
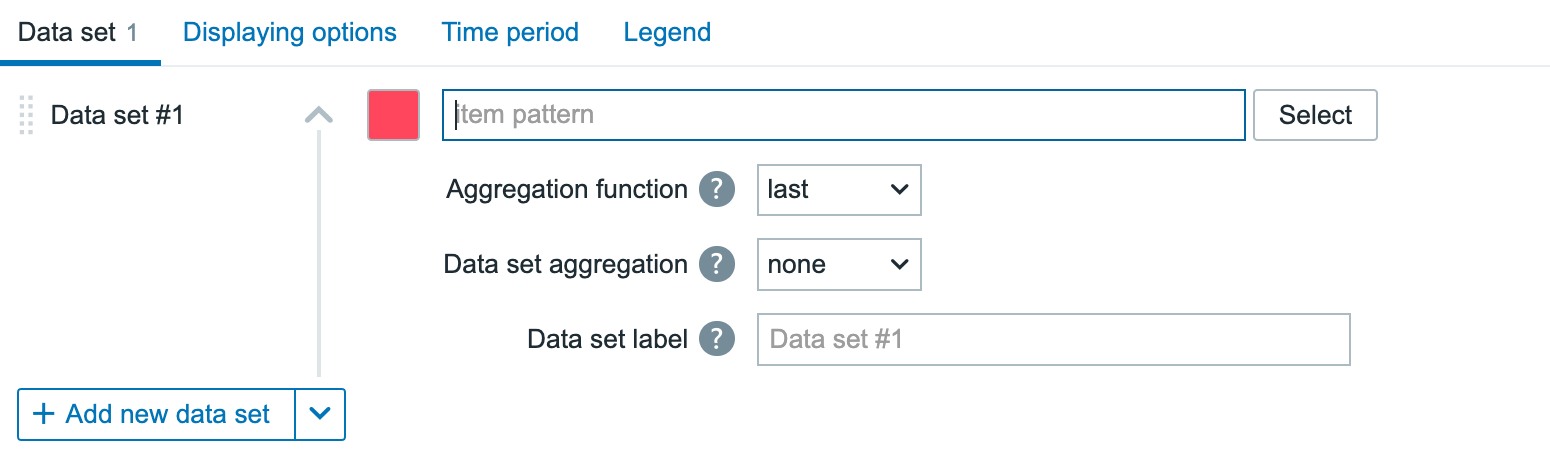
Not all widgets do this however, which means that widgets like the Gauge, Item value, Top hosts and (Top items) cannot use the LLD discovered data on host dashboards.
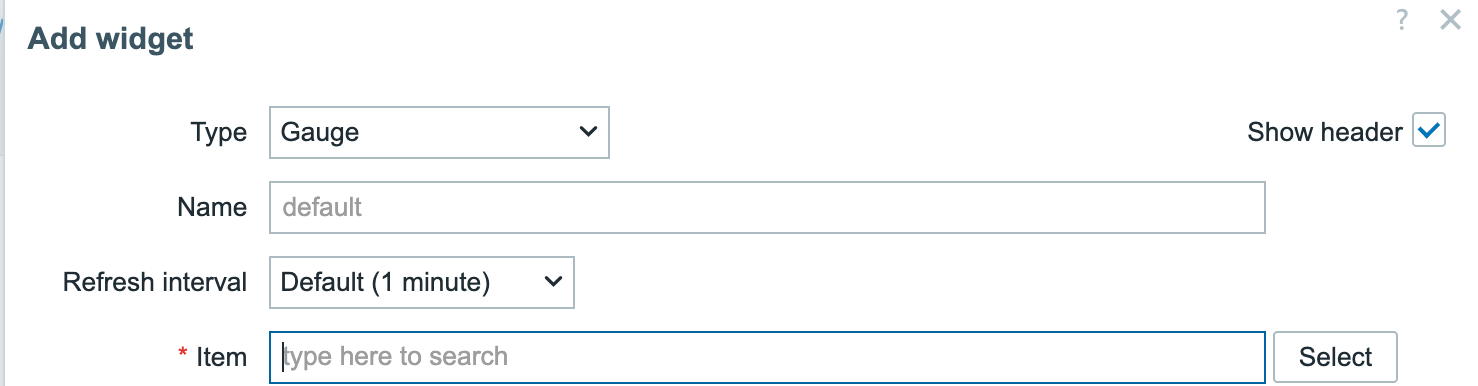
A pretty big limitation still if you ask me, that should be within the scope of this ticket "Ability to use all widgets in dashboard templates". The widgets can be used, but not like we can use them in global dashboards. Thus still limiting host dashboards.
Anyway, some stuff you find while writing a book 👀 Let me know if you agree it's within scope and if not we'll have to create a new ZBXNEXT.
|
|
Hi Nathan, thanks for your feedback! Yes, this is a limitation and we should address it. But, technically, it's not a problem with adding support for templated dashboards (which is a subject of this task) to all widgets but rather how some widgets store item references. Can you please add a ZBXNEXT?
ps. Looking forward to your book!
|
|
Thanks Alex for the prompt reply and excitment for the book ^^
I figured this would be the case, but wasn't sure. You're right, seperate ZBXNEXT is the way to go. Done and created #ZBXNEXT-8806 💪🏼
|
|
nathan.liefting , we are well aware of this limitation. It is not so easy to implement technically, but I hope it will be addressed in 7.0.
|
|
nathan.liefting, alexei, kalimulin - What are the chances that this limitation could be addressed by the work being put into ZBXNEXT-8145, ZBXNEXT-8686 and ZBXNEXT-8685? If these are designed and implemented in such a way (see some of my comments in those tickets directly) then I think global dashboards could really become "templates". A simple example is CPU usages. You could display a separate gauge widget for system, user, guest, nice, etc time. But, it might be useful to have a single gauge on a dashboard that is connected to an item navigator with pre-set item tag filters that display a list of CPU Utilization (total), CPU Guest Time, CPU Nice Time, CPU System Time, etc. where the default choice is CPU Utilization, but the user has the option to switch what is viewed in the gauge dynamically by selecting any of the other usages. And, to make things fully dynamic, I could see the host navigator widget being able to control that item navigator widget, so you can toggle between different hosts within and across different host groups.
I'm not saying don't focus on the template dashboard path as well - it's always great to provide multiple options for users. But the more I talk to my users it is very evident that the example I provided above, with the widget navigators is what they're looking for: It greatly reduces click counts (with template dashboard approach you need to continually switch between hosts which can be cumbersome when you have dozens of hosts to view - a global dashboard with navigators allows you to stay in one spot in the GUI, greatly improving the user experience). Arguably, a gauge chart is really not the best way to view all the CPU usages for many hosts at once; Top Hosts is the better choice, of course, but this is merely an example that I think users are really going to love as the concept of dynamic global dashboards starts to take shape in Zabbix.
Also, I realize my suggestions for the navigators probably opened up new possibilities in the design of the dynamic global dashboard (and for that matter APM, and the ability to monitor high performance computing applications that run in clustered environments). So, I realize this will take some work. I'm just thinking about alexei's keynote at the summit and some of the goals of advanced visualization techniques/widgets that are showing up on the roadmap and wondering if it made more sense to focus more heavily on the global dashboard ideas (communication framework, navigators, etc).
Thoughts?
|
|
GRyan337, I appreciate your comment very much. The work we are doing now is just the beginning of bringing the next-level visualisation aimed to various use cases into Zabbix. It includes many things: unification of global and template dashboards, widget framework, ability to use nearly all widgets as navigators and able to be controlled by other widgets and also a new set of widgets. The next step is to introduce hierarchy of dashboards with drill-down capability and one-click navigation between dashboards and various resources (like hosts, host groups or tag values).
The ultimate idea and our focus is to allow users build their own complex and dynamic UIs aimed to specific use cases.
I will give you just a quick example to illustrate it. Now Zabbix has a static and rather outdated event details view. The work we do now will make possible replacing it with a custom dashboard supporting workflow and displaying information we want.
Zabbix 7.0 is a huge step ahead but there will be many more serious enhancements in the future.
|
|
alexei - Thanks for the response. Advanced visualization techniques and options is definitely something all of my users are strongly interested in. The trigger framework is hands down the best and I'm excited for these global dashboard and widget additions. As I mentioned previously, all of these things combined will be game changers and make Zabbix even more of a premier monitoring solution.
|
Generated at Sat Aug 02 10:52:08 EEST 2025 using Jira 9.12.4#9120004-sha1:625303b708afdb767e17cb2838290c41888e9ff0.