Related: ZBXNEXT-3229
ZBXNEXT-1906 is distantly related as well. Although, it's about trigger expressions.
However, when finding a good algorithm for action conditions, this is then possibly applicable to trigger expressions as well ![]()
[ZBXNEXT-8371] Add availability to keep events even after parent items\triggers are removed Created: 2023 Mar 29 Updated: 2023 Mar 29 |
|
| Status: | Open |
| Project: | ZABBIX FEATURE REQUESTS |
| Component/s: | Server (S) |
| Affects Version/s: | 6.4.1rc1 |
| Fix Version/s: | None |
| Type: | New Feature Request | Priority: | Minor |
| Reporter: | Elina Kuzyutkina (Inactive) | Assignee: | Zabbix Development Team |
| Resolution: | Unresolved | Votes: | 1 |
| Labels: | events, housekeeper | ||
| Remaining Estimate: | Not Specified | ||
| Time Spent: | Not Specified | ||
| Original Estimate: | Not Specified | ||
| Issue Links: |
|
||||
| Description |
|
In the context of plans, of possiblity to import (and export) events from (to) third-party applications Regards, Elina |
[ZBXNEXT-6130] Trigger Dependency with different time interval on two hosts Created: 2020 Aug 12 Updated: 2020 Aug 12 |
|
| Status: | Open |
| Project: | ZABBIX FEATURE REQUESTS |
| Component/s: | Server (S) |
| Affects Version/s: | 5.0.1 |
| Fix Version/s: | None |
| Type: | New Feature Request | Priority: | Trivial |
| Reporter: | Youngkwang Han | Assignee: | Andris Zeila |
| Resolution: | Unresolved | Votes: | 0 |
| Labels: | dependency, events, problems, trigger | ||
| Remaining Estimate: | Not Specified | ||
| Time Spent: | Not Specified | ||
| Original Estimate: | Not Specified | ||
| Environment: |
CentOS, Apache |
||
| Description |
|
I love the functionality Trigger Dependency since it is so useful in monitoring. However, I want to differentiate the time intervals of two hosts in order to reduce my cpu and memory resources from checking pings at all times. What I want to do is having a host item checked with 1 min of time interval which is dependent on another host item with 5 min or longer time interval and still get alerts based on the dependency. Logically, even though it has not been 5 minutes, it should go and check ping when my primary host has a problem detected. So that I could find out the real origin of the problem right away instead of waiting all 5 minutes. Could this be done by editing C source code? |
[ZBXNEXT-5255] Add support for trigger and event macros in global scripts Created: 2019 Jun 04 Updated: 2021 Oct 18 Resolved: 2021 Sep 25 |
|
| Status: | Closed |
| Project: | ZABBIX FEATURE REQUESTS |
| Component/s: | Frontend (F), Server (S) |
| Affects Version/s: | 4.0.8 |
| Fix Version/s: | None |
| Type: | Change Request | Priority: | Major |
| Reporter: | Ramivis Exi | Assignee: | Valdis Murzins |
| Resolution: | Fixed | Votes: | 11 |
| Labels: | events, globalscripts, macros | ||
| Remaining Estimate: | Not Specified | ||
| Time Spent: | Not Specified | ||
| Original Estimate: | Not Specified | ||
| Issue Links: |
|
||||||||||||||||
| Description |
|
Currently, just host macro are supported in global script, but I need use triggers and events macro too for specific actions when the script run.. {EVENT.NAME}, {EVENT.DATE}, {TRIGGER.SEVERITY}, etc. Its possible? |
| Comments |
| Comment by Stephen Courtney [ 2019 Oct 24 ] |
|
Our specific use-case for this would be to use the {EVENT.TAGS} macro in a global script, - this would allow us to start a Windows service that had stopped (using a trigger action is not suitable, as there will be times when we don't want a service to automatically be restarted). |
| Comment by Jose Lourdes [ 2019 Nov 03 ] |
|
This feature would bring so many benefits to us. This would allow us to start a Windows service that had stopped. In our case, instead of 1st Line support teams get in touch with 2nd Line support teams, they would have a means to start the services, because the don´t have access to servers. Using a trigger action is not suitable. |
| Comment by Ramivis Exi [ 2020 May 13 ] |
|
is there any prevision for release of the feature? Tks |
| Comment by Frank Geister [ 2020 Jun 26 ] |
|
Hi, same here it would be a great benefit for us also. I added a similar request: https://support.zabbix.com/browse/ZBXNEXT-6029
Background we need an option to "manually" trigger our CreateIncident.pl script which creates an Incident from the selected event. Therfore to get data from the event to handover to Service Manager like user who opened the incident (thankfully is available since 5.0.2 and it's working) and we need the event data. We need at least the {EVENT.ID} to query additional data from the RestAPI to enrich the Incident within global script to get additional data (occurence, message, system name etc.) from the event. Please can you check if it is possible to implement? Many thanks! |
| Comment by Frank Geister [ 2020 Jun 26 ] |
|
We currently evaluating if Zabbix could be a replacement for our current Monitoring solution (BMC Patrol). The most pain point we got is that it is not possible to handover any type of MACROS or ITEM values ({{$HOST.HOST}:<KEY>}) to global script as argument which can be triggered manually by our operators in a event/problem context. Like described above, the {EVENT.ID} will be at least the argument we need to query additional data from the specific event where the operator executes the remote script from to query additional information by RestAPI from this specific event for our Incident creation intefrace. Would be awesome if you can provide this in a future release.
Many thanks. |
| Comment by Stefan [ 2020 Aug 10 ] |
|
Would be great to get it integrated. Thanks in advance. |
| Comment by Ramivis Exi [ 2021 Feb 24 ] |
|
Hello guys, is a very important feature, do you know when it will be available? maybe in version 5.4 or 6.0? =) |
| Comment by Andris Mednis [ 2021 Feb 24 ] |
|
I hope you will get something with |
| Comment by Ramivis Exi [ 2021 Sep 25 ] |
|
thank you, solved in version 5.4 |
[ZBXNEXT-3960] Short-circuit Action Condition Evaluation Created: 2017 Jul 03 Updated: 2017 Jul 03 |
|
| Status: | Open |
| Project: | ZABBIX FEATURE REQUESTS |
| Component/s: | Server (S) |
| Affects Version/s: | 3.4.0alpha1 |
| Fix Version/s: | 3.4.0alpha1 |
| Type: | New Feature Request | Priority: | Minor |
| Reporter: | Vladislavs Sokurenko | Assignee: | Unassigned |
| Resolution: | Unresolved | Votes: | 0 |
| Labels: | actions, conditions, events, optimization, performance | ||
| Remaining Estimate: | Not Specified | ||
| Time Spent: | Not Specified | ||
| Original Estimate: | Not Specified | ||
| Description |
|
Performance of action condition evaluation can be improved by implementing short circuit. Expected: Actual: |
| Comments |
| Comment by Glebs Ivanovskis (Inactive) [ 2017 Jul 03 ] |
|
Related: ZBXNEXT-3229 |
| Comment by Marc [ 2017 Jul 03 ] |
|
ZBXNEXT-1906 is distantly related as well. Although, it's about trigger expressions. |
[ZBXNEXT-3913] Locally cache actions and reload only if cache was reloaded Created: 2017 Jun 06 Updated: 2017 Jun 06 |
|
| Status: | Open |
| Project: | ZABBIX FEATURE REQUESTS |
| Component/s: | Server (S) |
| Affects Version/s: | 3.4.0alpha1 |
| Fix Version/s: | 3.4.0alpha1 |
| Type: | New Feature Request | Priority: | Trivial |
| Reporter: | Vladislavs Sokurenko | Assignee: | Unassigned |
| Resolution: | Unresolved | Votes: | 0 |
| Labels: | actions, conditions, events, performance | ||
| Remaining Estimate: | Not Specified | ||
| Time Spent: | Not Specified | ||
| Original Estimate: | Not Specified | ||
| Story Points: | 3 |
| Description |
|
Actions are always reloaded and cache is locked during this time, even if cache was not reloaded, see zbx_dc_get_actions_eval() However the correlation rules are refreshed only if the sync timestamp does not match current configuration cache sync timestamp. This allows to locally cache the correlation rules, see zbx_dc_correlation_rules_get() Actions should have the same behavior as correlation rules. |
[ZBXNEXT-3778] Actions from evensource "Internal" should support "host unavailable" as eventtype in action condition Created: 2017 Apr 05 Updated: 2017 Apr 05 |
|
| Status: | Open |
| Project: | ZABBIX FEATURE REQUESTS |
| Component/s: | Frontend (F), Server (S) |
| Affects Version/s: | None |
| Fix Version/s: | None |
| Type: | New Feature Request | Priority: | Trivial |
| Reporter: | Wolfgang Alper | Assignee: | Unassigned |
| Resolution: | Unresolved | Votes: | 0 |
| Labels: | actions, events | ||
| Remaining Estimate: | Not Specified | ||
| Time Spent: | Not Specified | ||
| Original Estimate: | Not Specified | ||
| Description |
|
When a host goes becomes unavailable, the server logs the following message: ... temporarily disabling Zabbix agent checks on host "testhost": host unavailable And if the host comes back server logs: It would be useful, if the actions based on the event source "Internal" would allow to setup an eventype " Host in unavailable state" as a condition similar to the existing eventtype "Item in not supported state" |
[ZBXNEXT-3632] Improve Discovery Multiple Event Condition Evaluation Created: 2016 Dec 22 Updated: 2016 Dec 27 Resolved: 2016 Dec 27 |
|
| Status: | Closed |
| Project: | ZABBIX FEATURE REQUESTS |
| Component/s: | Server (S) |
| Affects Version/s: | None |
| Fix Version/s: | 3.4.0alpha1 |
| Type: | Change Request | Priority: | Minor |
| Reporter: | Vladislavs Sokurenko | Assignee: | Unassigned |
| Resolution: | Duplicate | Votes: | 0 |
| Labels: | actions, conditions, discovery, events, performance | ||
| Remaining Estimate: | Not Specified | ||
| Time Spent: | Not Specified | ||
| Original Estimate: | Not Specified | ||
| Description |
|
In This task focuses on discovery multiple event bulk select. |
| Comments |
| Comment by Vladislavs Sokurenko [ 2016 Dec 27 ] |
|
Merged fix in https://support.zabbix.com/browse/ZBXNEXT-3588 |
[ZBXNEXT-3630] Improve Auto Registration Multiple Event Condition Evaluation Created: 2016 Dec 22 Updated: 2016 Dec 27 Resolved: 2016 Dec 27 |
|
| Status: | Closed |
| Project: | ZABBIX FEATURE REQUESTS |
| Component/s: | Server (S) |
| Affects Version/s: | None |
| Fix Version/s: | 3.4.0alpha1 |
| Type: | Change Request | Priority: | Minor |
| Reporter: | Vladislavs Sokurenko | Assignee: | Unassigned |
| Resolution: | Duplicate | Votes: | 0 |
| Labels: | actions, autoregistration, conditions, events, performance | ||
| Remaining Estimate: | Not Specified | ||
| Time Spent: | Not Specified | ||
| Original Estimate: | Not Specified | ||
| Description |
|
In This task focuses on auto registration multiple event bulk select. |
| Comments |
| Comment by Vladislavs Sokurenko [ 2016 Dec 22 ] |
|
Merged fix in https://support.zabbix.com/browse/ZBXNEXT-3588 |
[ZBXNEXT-3620] Improve Multiple Internal Event Condition Evaluation Created: 2016 Dec 20 Updated: 2016 Dec 27 Resolved: 2016 Dec 27 |
|
| Status: | Closed |
| Project: | ZABBIX FEATURE REQUESTS |
| Component/s: | Server (S) |
| Affects Version/s: | None |
| Fix Version/s: | 3.4.0alpha1 |
| Type: | Change Request | Priority: | Minor |
| Reporter: | Vladislavs Sokurenko | Assignee: | Unassigned |
| Resolution: | Duplicate | Votes: | 0 |
| Labels: | actions, conditions, events, performance | ||
| Remaining Estimate: | Not Specified | ||
| Time Spent: | Not Specified | ||
| Original Estimate: | Not Specified | ||
| Description |
|
Same as
|
| Comments |
| Comment by Vladislavs Sokurenko [ 2016 Dec 22 ] |
|
Merged fix in https://support.zabbix.com/browse/ZBXNEXT-3588 |
[ZBXNEXT-3616] Improve Template Condition Evaluation For Multiple Events Created: 2016 Dec 16 Updated: 2016 Dec 27 Resolved: 2016 Dec 27 |
|
| Status: | Closed |
| Project: | ZABBIX FEATURE REQUESTS |
| Component/s: | Server (S) |
| Affects Version/s: | None |
| Fix Version/s: | 3.4.0alpha1 |
| Type: | Change Request | Priority: | Minor |
| Reporter: | Vladislavs Sokurenko | Assignee: | Unassigned |
| Resolution: | Duplicate | Votes: | 0 |
| Labels: | actions, conditions, events, performance | ||
| Remaining Estimate: | Not Specified | ||
| Time Spent: | Not Specified | ||
| Original Estimate: | Not Specified | ||
| Description |
|
In This task focuses on template condition evaluation optimization. After it is implemented, there shall be all trigger sources optimized. Currently there is one select to obtain parent trigger id and then select with multiple levels possible to obtain hostid and compare to condition. Both selects shall select in bulk |
| Comments |
| Comment by Vladislavs Sokurenko [ 2016 Dec 20 ] |
|
Merged fix in https://support.zabbix.com/browse/ZBXNEXT-3588 |
[ZBXNEXT-3613] Improve Trigger Id Multiple Event Condition Evaluation Created: 2016 Dec 15 Updated: 2017 Mar 22 Resolved: 2017 Feb 17 |
|
| Status: | Closed |
| Project: | ZABBIX FEATURE REQUESTS |
| Component/s: | Server (S) |
| Affects Version/s: | None |
| Fix Version/s: | None |
| Type: | Change Request | Priority: | Minor |
| Reporter: | Vladislavs Sokurenko | Assignee: | Unassigned |
| Resolution: | Duplicate | Votes: | 0 |
| Labels: | actions, conditions, events, performance | ||
| Remaining Estimate: | Not Specified | ||
| Time Spent: | Not Specified | ||
| Original Estimate: | Not Specified | ||
| Issue Links: |
|
||||||||
| Description |
|
In Currently for each event zabbix server will resolve hierarchy of template ids. |
| Comments |
| Comment by Vladislavs Sokurenko [ 2016 Dec 16 ] |
|
Merged fix in |
[ZBXNEXT-3588] Improve Multiple Event Condition Evaluation Created: 2016 Dec 05 Updated: 2024 Apr 10 Resolved: 2020 Jun 30 |
|
| Status: | Closed |
| Project: | ZABBIX FEATURE REQUESTS |
| Component/s: | Server (S) |
| Affects Version/s: | 3.4.0alpha1 |
| Fix Version/s: | 4.0.22rc1, 5.0.2rc1, 5.2.0alpha1, 5.2 (plan) |
| Type: | Change Request | Priority: | Critical |
| Reporter: | Vladislavs Sokurenko | Assignee: | Vladislavs Sokurenko |
| Resolution: | Fixed | Votes: | 4 |
| Labels: | actions, conditions, events, performance | ||
| Σ Remaining Estimate: | Not Specified | Remaining Estimate: | Not Specified |
| Σ Time Spent: | Not Specified | Time Spent: | Not Specified |
| Σ Original Estimate: | Not Specified | Original Estimate: | Not Specified |
| Attachments: |
|
||||||||||||
| Issue Links: |
|
||||||||||||
| Sub-Tasks: |
|
||||||||||||
| Team: |  |
||||||||||||
| Sprint: | Sprint 2, Sprint 3, Sprint 4, Sprint 5, Sprint 6, Sprint 7, Sprint 8, Sprint 9, Sprint 10, Sprint 11, Sprint 12, Sprint 13, Sprint 14, Sprint 15, Sprint 16, Sprint 17, Sprint 18, Sprint 19, Sprint 20, Sprint 21, Sprint 22, Sprint 23, Sprint 64 (May 2020), Sprint 65 (Jun 2020) | ||||||||||||
| Story Points: | 10 | ||||||||||||
| Description |
|
Now in It is expected that after optimization the query count will be equal to conditions. |
| Comments |
| Comment by Vladislavs Sokurenko [ 2016 Dec 14 ] |
|
Fixed in development branch svn://svn.zabbix.com/branches/dev/ZBXNEXT-3588-trunk |
| Comment by dimir [ 2016 Dec 22 ] |
|
(1) [S] In functions check_condition_event_tag() check_condition_event_tag_value() and a lot more the header says they might return successful or not value while in reality they always return SUCCEED. vso RESOLVED in r64752 s.paskevics CLOSED |
| Comment by Vladislavs Sokurenko [ 2016 Dec 28 ] |
|
Attached optimized and non optimized pictures for following action, 1 item and 1000 triggers + multiple event generation. A Maintenance status not in maintenance #!/bin/bash COUNTER=0 while [ $COUNTER -lt 200 ]; do ./bin/zabbix_sender -z 127.0.0.1 -p 10051 -s "test server" -k trap_template1 -o 0 let COUNTER=COUNTER+1 done |
| Comment by dimir [ 2016 Dec 29 ] |
|
(2) [S] In lots of functions to check conditions (e. g. check_condition_event_tag()) there is similar code snippet:
               ret = FAIL;

               if (CONDITION_OPERATOR_NOT_EQUAL == condition->operator ||
                               CONDITION_OPERATOR_NOT_LIKE == condition->operator)
               {
                       ret_continue = SUCCEED;
               }
               else
                       ret_continue = FAIL;

               ret = ret_continue;
Looks like the first assignment is redundant. vso RESOLVED in r64779 <dimir> CLOSED |
| Comment by Vladislavs Sokurenko [ 2017 Jan 06 ] |
|
(3) Some headers have - before IN/OUT and is_escalation_event() is missing header vso RESOLVED in r64933 s.paskevics CLOSED |
| Comment by Vladislavs Sokurenko [ 2017 Jan 06 ] |
|
(4) Redundant distinct check in internal events host condition Distinct is used with primary key.
"select distinct itemid"
vso RESOLVED in r64935 glebs.ivanovskis Well spotted! |
| Comment by Vladislavs Sokurenko [ 2017 Mar 31 ] |
|
(5) There are places where cache might be used instead of optimized SQL queries for example templates see In DCdump_htmpls() implemented in 24393:20170331:094031.407 In DCdump_htmpls() 24393:20170331:094031.407 hostid:1 24393:20170331:094031.408 templateid:7 24393:20170331:094031.408 hostid:10 24393:20170331:094031.408 templateid:7 24393:20170331:094031.408 End of DCdump_htmpls() This should be better done as separate task probably, but must be properly investigated. So it might be worth removing template processing optimization part of this task and deciding to implement it through cache as a separate task. vso WON'T FIX, not possible to use only cache here. |
| Comment by Vladislavs Sokurenko [ 2017 Mar 31 ] |
|
(6) Short-circuit evaluation. |
| Comment by Glebs Ivanovskis (Inactive) [ 2017 May 17 ] |
|
(7) event_match_condition() seems to be quite small and simple function with a lot of debug logging ("In ..." and "End of ..."). Probably worth moving logging to check_action_conditions(), will be just one line per event per condition. vso RESOLVED in r68473 glebs.ivanovskis Nice! |
| Comment by Glebs Ivanovskis (Inactive) [ 2017 May 17 ] |
|
(8) check_action_condition() is a symbol with external visibility. Would be nice to add zbx_ prefix. vso RESOLVED in r68474 glebs.ivanovskis Good! |
| Comment by Glebs Ivanovskis (Inactive) [ 2017 May 17 ] |
|
(9) I had a belief that DB_* types should match database schema as close as possible, thus the idea to store zbx_vector_uint64_t objectids; in DB_CONDITION seems strange to me. I think it decreases readability of the code using DB_CONDITION. Maybe I'm wrong, let's get some clarification from wiper who started the trend with zbx_vector_ptr_t tags; in DB_EVENT. wiper ... who simply looked at DB_TRIGGER insider DB_EVENT and added more properties. glebs.ivanovskis I've found the source of this movement. vso RESOLVED in (26) s.paskevics CLOSED |
| Comment by Glebs Ivanovskis (Inactive) [ 2017 May 17 ] |
|
(10) Function prepare_actions_eval() does not belong to dbconfig.c, neither it accesses configuration cache nor uses configuration-specific definitions. This file is huge on its own, let's not pollute it with unrelated code. vso RESOLVED in r68484,68486 glebs.ivanovskis Great! Minor style fixes in r68641. Let's remove zbx_action_eval_free() from dbconfig.c too. REOPENED vso RESOLVED in r68938 s.paskevics CLOSED |
| Comment by Glebs Ivanovskis (Inactive) [ 2017 May 18 ] |
|
(11) In the wake of (9) I made some improvements to db.h and its surroundings. Please review my changes in r68265, r68270, r68273, r68274, r68276. vso CLOSED |
| Comment by Glebs Ivanovskis (Inactive) [ 2017 May 29 ] |
|
(12) I couldn't say by the name of check_events_conditions() what this function does and it's purpose "check if multiple events matches multiple conditions" wasn't helpful either. Same story with conditions_vectors_create() and conditions_vectors_destroy(). I tried to inline them and was quite pleased with result. Reader would need to look at their code anyway to understand what they are doing. Take a look at r68638. If you feel that process_actions() is too long, there are more logical ways to divide it into multiple functions. vso yes, I agree CLOSED |
| Comment by Glebs Ivanovskis (Inactive) [ 2017 May 29 ] |
|
(13) As I understand zbx_dc_get_actions_eval() simply copies data from shared memory into local memory of history syncer. We may consider optimization similar to zbx_dc_correlation_rules_get() (maybe as a subtask or independent task): /* The correlation rules are refreshed only if the sync timestamp */ /* does not match current configuration cache sync timestamp. This */ /* allows to locally cache the correlation rules. */ if (config->sync_ts == rules->sync_ts) { UNLOCK_CACHE; return; } glebs.ivanovskis BTW, probably no need to lock cache just for timestamp check, as vjaceslavs does in vso CLOSED nice observation, created ZBXNEXT-3913 |
| Comment by Sergejs Paskevics [ 2017 Jun 05 ] |
|
(14) Incorrect function name in comment for check_template_id_item_sql_alloc function. vso RESOLVED in r68955 s.paskevics CLOSED |
| Comment by Sergejs Paskevics [ 2017 Jun 08 ] |
|
(15) I don't like is_escalation_event function, because after new changes ( s.paskevics WON'T FIX, function is correct for current version. |
| Comment by Sergejs Paskevics [ 2017 Jun 09 ] |
|
(16) I propose to replacing if else statement with switch in check_discovery_condition function, as is done in check_trigger_condition, check_auto_registration_condition and check_internal_condition functions. RESOLVED in r69288. vso CLOSED |
| Comment by Sergejs Paskevics [ 2017 Jun 19 ] |
|
(17) Did some refactoring, please review r69288, r69289. vso CLOSED |
| Comment by Vladislavs Sokurenko [ 2017 Jun 19 ] |
|
(18) Objectids that we do select on shall be stored for possibility to use in between. vso RESOLVED in r69378 s.paskevics CLOSED |
| Comment by Sergejs Paskevics [ 2017 Jun 20 ] |
|
(19) Please check changes in r69379. Callbacks were deleted from check_object_hierarchy function. vso CLOSED with small style fix in r69411 |
| Comment by Vladislavs Sokurenko [ 2017 Jun 20 ] |
|
(20) When internal events are generated for trigger and for item then there is no guarantee that objectid will not be same for both. We must add object to the criteria. s.paskevics CLOSED |
| Comment by Sergejs Paskevics [ 2017 Jun 28 ] |
|
(25) Please check get_object_ids_internal() function refactoring. r69633 r69641 vso CLOSED |
| Comment by Sergejs Paskevics [ 2017 Jun 29 ] |
|
(26) There is no bulk selection in the check_acknowledged_condition function, but in practice, this function always process only one event. s.paskevics This function can be called only from escalator. I added some changes in code r69676, 69687. RESOLVED. vso CLOSED |
| Comment by Sergejs Paskevics [ 2017 Jul 03 ] |
|
(27) SQL error: [Z3005] query failed: [1054] Unknown column 's.type' in 'field list' [select s.type from dservices s where s.dserviceid=1] vso this was reported and fixed under |
| Comment by Sergejs Paskevics [ 2017 Jul 03 ] |
|
(28) Please check my minor changes in r69736. vso CLOSED |
| Comment by Sergejs Paskevics [ 2017 Jul 03 ] |
|
Successfully tested. |
| Comment by Vladislavs Sokurenko [ 2020 Jun 09 ] |
|
Fixed in:
|
[ZBXNEXT-3201] New high-performance view of current problems Created: 2016 Mar 18 Updated: 2017 Jul 19 Resolved: 2016 Dec 15 |
|
| Status: | Closed |
| Project: | ZABBIX FEATURE REQUESTS |
| Component/s: | API (A), Frontend (F), Installation (I), Server (S) |
| Affects Version/s: | None |
| Fix Version/s: | 3.2.0alpha1, 3.2.0alpha2, 3.2.0beta2 |
| Type: | Change Request | Priority: | Major |
| Reporter: | Alexander Vladishev | Assignee: | Unassigned |
| Resolution: | Fixed | Votes: | 9 |
| Labels: | events, performance | ||
| Remaining Estimate: | Not Specified | ||
| Time Spent: | Not Specified | ||
| Original Estimate: | Not Specified | ||
| Attachments: |
|
||||||||||||
| Issue Links: |
|
||||||||||||
| Description |
|
Current way of working with a list of active problems is very inefficient due to complex processing of historical table events. Also Zabbix displays problems in two different views: Monitoring?Triggers and Monitoring?Events. It confuses users and makes little sense. Another serious usability issue is displaying of OK events everywhere. It takes valuable space and makes reading of current problems confusing. It is proposed to make a unified view Monitoring?Problems that will take advantage of the new table problem and will contain list of active problems as well as history of problems. |
| Comments |
| Comment by Marc [ 2016 Apr 01 ] | ||||||||||
|
By stating to "[...] make a unified view [..]", is it meant to provide this view in addition or to replace the current views Triggers and Events, resp. to implement one view that supports each of these aspects? While I can confirm that it is indeed confusing to new or non-power-users, it is pretty valuable to have these two aspects on issues. One aspect for the current state and another aspect for identifying what happened at a certain period in time. A replacement view for Triggers and Events that provides several aspects sounds to be the best approach to me but is possibly also the most challenging one from a UX perspective. However, if a good implementation design is found, that's to say one view that allows different kind of aspects with flexible but intuitive filter options, then this promises to become a huge improvement to users. Btw, yet another aspect could be ZBXNEXT-2695. | ||||||||||
| Comment by Alexei Vladishev [ 2016 May 27 ] | ||||||||||
|
The new view is supposed to support all functionality we already have under Monitoring->Triggers and Monitoring->Events along with additional filtering options and much better performance. | ||||||||||
| Comment by Alexander Vladishev [ 2016 Jul 15 ] | ||||||||||
|
Available in development branch svn://svn.zabbix.com/branches/dev/ZBXNEXT-3201 | ||||||||||
| Comment by Alexander Vladishev [ 2016 Jul 15 ] | ||||||||||
|
(1) Changed translation strings: Strings added:
iivs CLOSED | ||||||||||
| Comment by Alexander Vladishev [ 2016 Jul 15 ] | ||||||||||
|
Available in pre-3.1.0 (trunk) r61049. | ||||||||||
| Comment by Alexander Vladishev [ 2016 Jul 18 ] | ||||||||||
|
(2) Related to Administration -> Media types: "exec_params_count" can be removed. sasha RESOLVED in trunk@61073,61074 iivs CLOSED | ||||||||||
| Comment by Alexander Vladishev [ 2016 Jul 18 ] | ||||||||||
|
(3) Links to event details is missing from problem view sasha RESOLVED in trunk@61077 iivs CLOSED | ||||||||||
| Comment by Alexander Vladishev [ 2016 Jul 18 ] | ||||||||||
|
(4) Broken "Host" column in Monitoring->Triggers view sasha RESOLVED in trunk@61081 iivs CLOSED | ||||||||||
| Comment by Alexander Vladishev [ 2016 Jul 18 ] | ||||||||||
|
(5) Bulk acknowledge sasha RESOLVED in dev branch svn://svn.zabbix.com/branches/dev/ZBXNEXT-3201-1 r61346. gunarspujats CLOSED | ||||||||||
| Comment by Ivo Kurzemnieks [ 2016 Jul 19 ] | ||||||||||
|
(6) [D] API documentation updated
RESOLVED gunarspujats CLOSED | ||||||||||
| Comment by Ivo Kurzemnieks [ 2016 Jul 19 ] | ||||||||||
|
(8) [F] Acknowledging problems, view switches to last page. So does the cancel. sasha RESOLVED in trunk@r61145 iivs CLOSED | ||||||||||
| Comment by Ivo Kurzemnieks [ 2016 Jul 19 ] | ||||||||||
|
(9) [F] Problems page shows 8689+ records at the bottom, while other pages show only 1001+. Also API count returns 9849 records. Filter was reset, so shouldn't everything be selected? sasha Problem view does not show old resolved problems. It depends on "Display OK triggers for" option. sasha RESOLVED in trunk@r61143 iivs CLOSED | ||||||||||
| Comment by Ivo Kurzemnieks [ 2016 Jul 19 ] | ||||||||||
|
(10) [F] Sorting by severity doesn't change. Looks exactly like sorted by time. alexei RESOLVED in trunk@r61120 iivs Looks good now. | ||||||||||
| Comment by Ivo Kurzemnieks [ 2016 Jul 19 ] | ||||||||||
|
(11) [F] As discussed, the extension of Monitoring -> Problems view from sasha RESOLVED in r62098 Strings added:
gunarspujats CLOSED | ||||||||||
| Comment by Ivo Kurzemnieks [ 2016 Jul 19 ] | ||||||||||
|
(12) [A] Specification states that possible sorting columns for problem.get are eventid and clock, however objectid is implemented as well. Also there is no clock index on problem table. sasha RESOLVED in dev branch svn://svn.zabbix.com/branches/dev/ZBXNEXT-3201-1 r61320. gunarspujats CLOSED | ||||||||||
| Comment by Ivo Kurzemnieks [ 2016 Jul 19 ] | ||||||||||
|
(13) [F] Coding style and other minor issues:
sasha RESOLVED in dev branch svn://svn.zabbix.com/branches/dev/ZBXNEXT-3201-1 r61316 gunarspujats CLOSED | ||||||||||
| Comment by Alexei Vladishev [ 2016 Jul 20 ] | ||||||||||
|
(14) [F] sorting by priority in problem view does not work alexei RESOLVED in revision 61120. iivs How is this different from (10)? sasha CLOSED as duplicate of (10) | ||||||||||
| Comment by Alexei Vladishev [ 2016 Jul 20 ] | ||||||||||
|
(15) [F] after first in-line refresh all sorting links in table header become incorrect sasha RESOLVED in dev branch svn://svn.zabbix.com/branches/dev/ZBXNEXT-3201-1 r61336. gunarspujats CLOSED | ||||||||||
| Comment by Oleg Egorov (Inactive) [ 2016 Jul 28 ] | ||||||||||
|
(16) [F] Performance issue (mod_fastcgi.c.2673) FastCGI-stderr: PHP Fatal error: Allowed memory size of 134217728 bytes exhausted (tried to allocate 72 bytes) in /var/www/zbxnext_3274/include/classes/api/CRelationMap.php on line 77 (mod_fastcgi.c.2673) FastCGI-stderr: PHP Fatal error: Allowed memory size of 134217728 bytes exhausted (tried to allocate 78 bytes) in /var/www/zbxnext_3274/include/classes/api/CApiService.php on line 286 (mod_fastcgi.c.2673) FastCGI-stderr: PHP Fatal error: Allowed memory size of 134217728 bytes exhausted (tried to allocate 72 bytes) in /var/www/zbxnext_3274/include/classes/api/CApiService.php on line 286 (mod_fastcgi.c.2673) FastCGI-stderr: PHP Fatal error: Allowed memory size of 134217728 bytes exhausted (tried to allocate 72 bytes) in /var/www/zbxnext_3274/include/classes/api/CApiService.php on line 286 (mod_fastcgi.c.2673) FastCGI-stderr: PHP Fatal error: Allowed memory size of 134217728 bytes exhausted (tried to allocate 72 bytes) in /var/www/zbxnext_3274/include/classes/api/CApiService.php on line 286 (mod_fastcgi.c.2673) FastCGI-stderr: PHP Fatal error: Allowed memory size of 134217728 bytes exhausted (tried to allocate 64 bytes) in (mod_fastcgi.c.2673) FastCGI-stderr: PHP Fatal error: Allowed memory size of 134217728 bytes exhausted (tried to allocate 72 bytes) in /var/www/zbxnext_3274/include/classes/api/CRelationMap.php on line 48 (mod_fastcgi.c.2673) FastCGI-stderr: PHP Fatal error: Allowed memory size of 134217728 bytes exhausted (tried to allocate 80 bytes) in /var/www/zbxnext_3274/include/db.inc.php on line 599 (mod_fastcgi.c.2673) FastCGI-stderr: PHP Fatal error: Allowed memory size of 134217728 bytes exhausted (tried to allocate 85 bytes) in /var/www/zbxnext_3274/include/db.inc.php on line 599 (mod_fastcgi.c.2673) FastCGI-stderr: PHP Fatal error: Allowed memory size of 134217728 bytes exhausted (tried to allocate 78 bytes) in /var/www/zbxnext_3274/include/classes/api/CRelationMap.php on line 73 Moved from sasha RESOLVED in dev branch svn://svn.zabbix.com/branches/dev/ZBXNEXT-3201-1 r61291:r61312 sandis.neilands It is better now however with 105k problems the "Problems" page still runs out of memory. This shouldn't happen since we show only 20 pages, e.g. 1000 problems by default. gunarspujats CLOSED | ||||||||||
| Comment by Oleg Egorov (Inactive) [ 2016 Jul 28 ] | ||||||||||
|
(17) [F] Moved from sandis.neilands: What does the 'Action' column in 'Problems' page is supposed to show? Just the actions taken for problem event, problem and ok event? sasha RESOLVED in r62041 Strings added:
Strings deleted:
gunarspujats CLOSED sasha added displaying of total number of actions in r62141 RESOLVED gunarspujats CLOSED | ||||||||||
| Comment by Alexander Vladishev [ 2016 Aug 02 ] | ||||||||||
|
(18) Different filter controls in Monitoring->Triggers, Monitoring->Overview and Monitoring->Problems sasha RESOLVED in dev branch svn://svn.zabbix.com/branches/dev/ZBXNEXT-3201-1 r61335. gunarspujats CLOSED | ||||||||||
| Comment by Natalja Romancaka [ 2016 Aug 02 ] | ||||||||||
|
(19) [F] if sorting by host empty list, errors Undefined variable: triggers_hosts [zabbix.php:21 → require_once() → ZBase->run() → ZBase->processRequest() → CView->getOutput() → include() → CScreenProblem->get() in include/classes/screens/CScreenProblem.php:166]
Invalid argument supplied for foreach() [zabbix.php:21 → require_once() → ZBase->run() → ZBase->processRequest() → CView->getOutput() → include() → CScreenProblem->get() in include/classes/screens/CScreenProblem.php:166]
picture no_data_sort_host.jpg sasha RESOLVED in dev branch svn://svn.zabbix.com/branches/dev/ZBXNEXT-3201-1 r61348. | ||||||||||
| Comment by Natalja Romancaka [ 2016 Aug 04 ] | ||||||||||
|
(20) [F] Based on specification "Displayed tag and tag value length is limited to N pixels". No limit to N pixels, now displaying all 255 symbols of tag and tag value sasha Already fixed in | ||||||||||
| Comment by Natalja Romancaka [ 2016 Aug 04 ] | ||||||||||
|
(21) [F] no space between third tag and '...' , with space looks better sasha RESOLVED in dev branch svn://svn.zabbix.com/branches/dev/ZBXNEXT-3201-1 r61436 gunarspujats CLOSED | ||||||||||
| Comment by Alexander Vladishev [ 2016 Aug 05 ] | ||||||||||
|
svn://svn.zabbix.com/branches/dev/ZBXNEXT-3201-1 was merged to trunk r61447. | ||||||||||
| Comment by Alexander Vladishev [ 2016 Aug 22 ] | ||||||||||
|
2nd phase was implemented in pre-3.2.0alpha2 r61801. | ||||||||||
| Comment by Alexander Vladishev [ 2016 Aug 22 ] | ||||||||||
|
(22) 2nd phase translation strings: Strings added:
Strings deleted:
oleg.egorov CLOSED | ||||||||||
| Comment by richlv [ 2016 Aug 22 ] | ||||||||||
|
(23) changelog entry currently says :
it might be worth specifying what was improved (performance ? something else ?) sasha CLOSED as duplicate of (6) richlv hmm, will the person updating the API docs remember to change the changelog entry ? maybe that's worth adding in that subissue ? sasha You are right! FIXED in r64478 CLOSED | ||||||||||
| Comment by Natalja Romancaka [ 2016 Aug 23 ] | ||||||||||
|
(24) [F] when use filtering options "Show:History", "Tags:any tag name and tag value" geting error Error in query [SELECT e.eventid,e.objectid,e.clock,e.ns FROM events e WHERE e.source='0' AND e.object='0' AND EXISTS (SELECT NULL FROM event_tag et WHERE e.eventid=et.eventid AND et.tag='TagName' AND UPPER(pt.value) LIKE'%TESTVALUE%' ESCAPE '!') AND e.clock>='1408860125' AND e.clock<='1471932125' AND e.value='1' ORDER BY e.eventid DESC LIMIT 1001 OFFSET 0] [Unknown column 'pt.value' in 'where clause'] sasha RESOLVED in r61872 oleg.egorov CLOSED | ||||||||||
| Comment by Oleg Egorov (Inactive) [ 2016 Aug 23 ] | ||||||||||
|
(25) [F] Time bar issue in Monitoring->Problems if selected all period
sasha Cannot reproduce. Seems the bug is related to timebar. CLOSED | ||||||||||
| Comment by Natalja Romancaka [ 2016 Aug 23 ] | ||||||||||
|
(26) [F] not renamed labels according specification in Administration->General->Trigger displaying options: sasha it is decided to leave these labels without changes CLOSED | ||||||||||
| Comment by Natalja Romancaka [ 2016 Aug 23 ] | ||||||||||
|
(27) [F] according to the specification "Show events not older than (in days)" and "Max count of events per trigger to show" should be removed in Administration->General->GUI sasha These fields already used in tr_status.php. Specification must be updated. WON'T FIX | ||||||||||
| Comment by Oleg Egorov (Inactive) [ 2016 Aug 23 ] | ||||||||||
|
(28) [I] Missed upgrade patch, event_expire and event_show_max should be removed from config table. sasha These fields already used in tr_status.php. Specification must be updated. WON'T FIX | ||||||||||
| Comment by Natalja Romancaka [ 2016 Aug 23 ] | ||||||||||
|
(29) [F] sorting by any type, change current page number oleg.egorov After bulk acknowledge happens same issue sasha RESOLVED in r61873 natalja.zabbix UI successfully tested oleg.egorov CLOSED | ||||||||||
| Comment by Oleg Egorov (Inactive) [ 2016 Aug 23 ] | ||||||||||
|
(30) [A] Slow query SQL (65.140725) SELECT e.eventid,e.objectid,e.clock,e.ns FROM events e WHERE e.source='0' AND e.object='0' AND (e.objectid BETWEEN '15353' AND '15398' OR e.objectid BETWEEN '15411' AND '15423' OR e.objectid BETWEEN '15493' AND '15505' OR e.objectid BETWEEN '16165' AND '16177' OR e.objectid BETWEEN '16180' AND '16189' OR e.objectid IN ('15440','15441','15442','15443','15543','15547','15548','15550','15551','15553','15561','15563','16162')) AND EXISTS (SELECT NULL FROM functions f,items i,hosts_groups hg,triggers t WHERE e.objectid=f.triggerid AND f.itemid=i.itemid AND i.hostid=hg.hostid AND (hg.groupid BETWEEN '4' AND '9' OR hg.groupid BETWEEN '16' AND '25' OR hg.groupid IN ('1','2','11','12','14','30','32','43','45','46','47','48')) AND i.hostid='10343' AND e.objectid=t.triggerid AND t.priority='5') AND e.acknowledged=0 AND e.clock>='1436821200' AND e.clock<='1457902800' AND e.value='1' ORDER BY e.eventid DESC LIMIT 1001 OFFSET 0 zabbix.php:21 → require_once() → ZBase->run() → ZBase->processRequest() → CView->getOutput() → include() → CScreenProblem->get() → CScreenProblem->getData() → CScreenProblem->getDataEvents() → CFrontendApiWrapper->get() → CApiWrapper->__call() → CFrontendApiWrapper->callMethod() → CApiWrapper->callMethod() → CFrontendApiWrapper->callClientMethod() → CLocalApiClient->callMethod() → call_user_func_array() → CEvent->get() → DBselect() in include\classes\api\services\CEvent.php:379 Debug info: Total time: 69.799992 Total SQL time: 66.112774000004 SQL count: 2339 (selects: 1523 | executes: 816) Peak memory usage: 63.25M Memory limit: 3072M Installation: 3,055,333 - events 2,167 - triggers sasha I can't reproduce this issue. SQL (0.232991): SELECT e.eventid,e.objectid,e.clock,e.ns FROM events e WHERE e.source='0' AND e.object='0' AND e.objectid IN ('13666','13782','13784','13786','13788','13790','13792','13794','13796','13798','13800','13802','13804','13806','13808','13810','13812','13814','13816','13818','13820','13822','13824','13826','13828','13830','13832','13834','13836','13838','13840','13842','13844','13846','13848','13850','13852','13854','13856','13858','13860','13862','13864','13866','13868','13870','13872','13874','13876','13878') AND EXISTS (SELECT NULL FROM functions f,items i,hosts_groups hg,triggers t WHERE e.objectid=f.triggerid AND f.itemid=i.itemid AND i.hostid=hg.hostid AND (hg.groupid BETWEEN '4' AND '16' OR hg.groupid IN ('1','2')) AND i.hostid IN ('10084','10105') AND e.objectid=t.triggerid AND t.priority IN ('2','3','4','5')) AND e.acknowledged=0 AND e.clock>='1408909797' AND e.clock<='1471981797' AND e.value='1' ORDER BY e.eventid DESC LIMIT 1001 OFFSET 0
zabbix.php:21 → require_once() → ZBase->run() → ZBase->processRequest() → CView->getOutput() → include() → CScreenProblem->get() → CScreenProblem->getData() → CScreenProblem->getDataEvents() → CFrontendApiWrapper->get() → CApiWrapper->__call() → CFrontendApiWrapper->callMethod() → CApiWrapper->callMethod() → CFrontendApiWrapper->callClientMethod() → CLocalApiClient->callMethod() → call_user_func_array() → CEvent->get() → DBselect() in include/classes/api/services/CEvent.php:379
Debug info: ******************** Script profiler ******************** Total time: 0.298484 Total SQL time: 0.262083 SQL count: 58 (selects: 35 | executes: 23) Peak memory usage: 6.75M Memory limit: 512M Installation: 1,135,455 - events 402 - triggers sasha WON'T FIX | ||||||||||
| Comment by Oleg Egorov (Inactive) [ 2016 Aug 23 ] | ||||||||||
|
(31) [F] In Monitoring->Problems displaying event acknowledge errors. Open in the new tab Event acknowledge , then try to submit space till page refreshed without error message.
sasha WON'T FIX | ||||||||||
| Comment by Oleg Egorov (Inactive) [ 2016 Aug 23 ] | ||||||||||
|
(32) [F] Triggers (tr_status.php) regression In "Trigger" page select old, problem trigger, then on popup select "Problems" link... and there is no result, because it's was old issue. sasha Already discussed with alexei. It was decided to show only recent problems from triggers popup menu. WON'T FIX | ||||||||||
| Comment by Natalja Romancaka [ 2016 Aug 24 ] | ||||||||||
|
(33) [F] macros not opened in trigger input after filtering sasha RESOLVED in r61876 natalja.zabbix UI successfully tested oleg.egorov CLOSED | ||||||||||
| Comment by Oleg Egorov (Inactive) [ 2016 Aug 24 ] | ||||||||||
|
(34) [F] Possible memory leak, tested on IE11 Will be tested on other browsers. Night test results: iivs My IE11 is eating 28kb/s. Over night it ate around 1.6GB of RAM. Trying to resize browser in the morning and using navigation to check if browser still works, it just freezes up and still continues to consume more memory. At this point I'm not sure if this is the only page or any page with 30s (default) refresh and left unattended for long periods of time. oleg.egorov Won't fix. CLOSED | ||||||||||
| Comment by Alexander Vladishev [ 2016 Aug 25 ] | ||||||||||
|
Fixed in pre-3.2.0beta1 r61938. | ||||||||||
| Comment by Backoffice Team [ 2016 Aug 29 ] | ||||||||||
|
When housekeeper remove an event (or in our test we truncated events table), the Monitoring => problems page shows an event age equal as the start of time, or unixtime at least. The events page seems to be OK. See the attachments below.
| ||||||||||
| Comment by Alexander Vladishev [ 2016 Aug 30 ] | ||||||||||
|
backoffice.team, it is already fixed under | ||||||||||
| Comment by Alexander Vladishev [ 2016 Aug 30 ] | ||||||||||
|
(35) Show details filter option is not implemented sasha RESOLVED in r62059 gunarspujats CLOSED | ||||||||||
| Comment by Alexander Vladishev [ 2016 Aug 30 ] | ||||||||||
|
(36) Problems in CLOSING state are not blinking sasha RESOLVED in r62060 gunarspujats CLOSED | ||||||||||
| Comment by Alexander Vladishev [ 2016 Aug 31 ] | ||||||||||
|
(37) Applied new icons
sasha RESOLVED in r62125 gunarspujats CLOSED | ||||||||||
| Comment by Alexander Vladishev [ 2016 Aug 31 ] | ||||||||||
|
(11), (17), (35), (36) and (37) are fixed in pre-3.2.0beta2 r62146. | ||||||||||
| Comment by Natalja Romancaka [ 2016 Sep 02 ] | ||||||||||
|
(38) [F] incorrect values in "action" and "tag" column in exported csv file from Monitoring->Problem page. Tag column empty, but in action column tag values iivs RESOLVED in r62308 natalja.zabbix ui successfully tested sasha CLOSED | ||||||||||
| Comment by Alexander Vladishev [ 2016 Sep 06 ] | ||||||||||
|
(39) [F] fixed displaying of actions popup; added footer for truncated action list sasha RESOLVED in r62326. Strings deleted:
oleg.egorov Fixed coding style in r62332. CLOSED | ||||||||||
| Comment by Alexander Vladishev [ 2016 Sep 06 ] | ||||||||||
|
(38) and (39) are fixed in pre-3.2.0beta3 r62334. |
[ZBXNEXT-3193] Linkage between problem and ok events Created: 2016 Mar 16 Updated: 2018 Aug 13 Resolved: 2016 Dec 15 |
|
| Status: | Closed |
| Project: | ZABBIX FEATURE REQUESTS |
| Component/s: | API (A), Frontend (F), Installation (I), Server (S) |
| Affects Version/s: | None |
| Fix Version/s: | 3.2.0alpha1 |
| Type: | New Feature Request | Priority: | Major |
| Reporter: | Alexander Vladishev | Assignee: | Unassigned |
| Resolution: | Fixed | Votes: | 2 |
| Labels: | events, multiple, triggers | ||
| Remaining Estimate: | Not Specified | ||
| Time Spent: | Not Specified | ||
| Original Estimate: | Not Specified | ||
| Issue Links: |
|
||||||||
| Description |
|
It's needed for faster displaying of events and finding correlation between PROBLEM and OK events. |
| Comments |
| Comment by richlv [ 2016 Mar 16 ] |
|
any more detail on what the feature request is about ? |
| Comment by Andris Zeila [ 2016 May 12 ] |
|
(1) [S] Database patch ready for testing in development branch svn://svn.zabbix.com/branches/dev/ZBXNEXT-3193 |
| Comment by Andris Zeila [ 2016 May 12 ] |
|
Server side ready for testing. |
| Comment by Ivo Kurzemnieks [ 2016 May 12 ] |
|
(2) No translation string changes. sasha CLOSED |
| Comment by Ivo Kurzemnieks [ 2016 May 12 ] |
|
Apparently there is nothing to do for event API, since there is only event.get and the field is already read-only. |
| Comment by Andris Zeila [ 2016 May 20 ] |
|
Updated server to conform the specification changes |
| Comment by Sandis Neilands (Inactive) [ 2016 May 26 ] |
|
(3) [D] Tables 'problem' and 'event recovery' have 'eventid' from 'events' as foreign key. However table 'events' can be partitioned (https://www.zabbix.org/wiki/Docs/howto/mysql_partitioning). At least MySQL does not support foreign keys on partitioned tables (http://dev.mysql.com/doc/refman/5.7/en/partitioning-limitations.html). This is a showstopper for upgrading to 3.2 for those that have the 'events' table partitioned. wiper 'events' table partitioning is not recommended anymore and we will stop supporting it. It should be clearly stated in upgrade notes and we should also update relevant documentation. sandis.neilands Should we also provide a guide on how to unify partitioned 'events' table? gunarspujats Discussed with sasha, guide won't be provided. CLOSED |
| Comment by Sandis Neilands (Inactive) [ 2016 May 26 ] |
|
(4) design Why 10000 events per batch during DB upgrade? How was this number determined? Considering that we'll hold the IDs of all events in memory during the upgrade - what is the maximum number of events that we have seen? wiper Just and arbitrary number, not too small and not too large.
wiper One solution would be to use temporary database table to store open events. However that would slow things down. For now we will just log warning when an event source reaches 10m open events. sandis.neilands Another possible solution - add log that states percentage of events processed after each 5%. This would allow to forecast how much time is still needed for the upgrade. wiper Would be nice, but there are upgrade steps we can't show step progress - for example changes to history table structure. So user will not be able to forecast to total time needed for upgrade. sandis.neilands CLOSED with a comment. After upgrade upon receiving an OK event the server will be stuck while processing all those PROBLEM events. |
| Comment by Sandis Neilands (Inactive) [ 2016 May 26 ] |
|
(5) design API: why not expose problems via API? The workflow of automating common tasks fails if we do not have 1-to-1 correspondance between API and UI. wiper This will done later in |
| Comment by Sandis Neilands (Inactive) [ 2016 May 26 ] |
|
(6) [S] trigger_events_hash_func() - hash overwritten, hash of source computed twice. wiper the hash is used as seed for the next hash step calculation. Fixed duplicate source addition to hash. sandis.neilands CLOSED. |
| Comment by Sandis Neilands (Inactive) [ 2016 May 26 ] |
|
(7) [S] assign_recovery_events() or update_event_recovery() (comment vs. reality)? wiper RESOLVED in r60338. sandis.neilands CLOSED. |
| Comment by Sandis Neilands (Inactive) [ 2016 May 26 ] |
|
(8) design If item and/or trigger removed while problem still unresolved then it is never removed from 'problem' table. Is this intended? wiper It will be removed together with events by housekeeper |
| Comment by Sandis Neilands (Inactive) [ 2016 May 26 ] |
|
(9) design If trigger changed to generate single problem event, PROBLEM event arrives, then OK event arrives. All the open PROBLEM events for the trigger are closed. Is this intended? wiper Yes, currently OK event closes all open PROBLEM events. |
| Comment by Sandis Neilands (Inactive) [ 2016 May 26 ] |
|
(10) design When is 'event_recovery' table supposed to be cleaned? How will it be used (which ZBXNEXT)? wiper 'event_recovery' table records will be automatically removed with events (e.g. housekeeper). |
| Comment by Marc [ 2016 May 26 ] |
|
richlv, |
| Comment by Alexei Vladishev [ 2016 May 26 ] |
Your assumption is absolutely correct. It's a quite technical feature request, which does not bring any end-user benefits if implemented alone. |
| Comment by Sandis Neilands (Inactive) [ 2016 May 26 ] |
|
(11) [S] Memory leak during upgrade in update_event_recovery(). ==27269== 53,252,160 bytes in 1,633 blocks are possibly lost in loss record 1,065 of 1,065 ==27269== at 0x4C2AB80: malloc (in /usr/lib/valgrind/vgpreload_memcheck-amd64-linux.so) ==27269== by 0x4E898B3: my_malloc (in /usr/lib/x86_64-linux-gnu/libmysqlclient.so.18.0.0) ==27269== by 0x4E853CD: alloc_root (in /usr/lib/x86_64-linux-gnu/libmysqlclient.so.18.0.0) ==27269== by 0x4E6A33A: cli_read_rows (in /usr/lib/x86_64-linux-gnu/libmysqlclient.so.18.0.0) ==27269== by 0x4E6CB97: mysql_store_result (in /usr/lib/x86_64-linux-gnu/libmysqlclient.so.18.0.0) ==27269== by 0x53F2E7: zbx_db_vselect (db.c:1392) ==27269== by 0x53F5D4: __zbx_zbx_db_select (db.c:241) ==27269== by 0x53F477: zbx_db_select_n (db.c:1624) ==27269== by 0x5095FA: DBselectN (db.c:405) ==27269== by 0x4FA4D8: update_event_recovery (dbupgrade_3010.c:276) ==27269== by 0x4FA133: DBpatch_3010021 (dbupgrade_3010.c:350) ==27269== by 0x4F1ECB: DBcheck_version (dbupgrade.c:784) ==27269== ==27269== LEAK SUMMARY: ==27269== definitely lost: 680 bytes in 85 blocks ==27269== indirectly lost: 6,568,800 bytes in 426 blocks ==27269== possibly lost: 76,010,400 bytes in 2,258 blocks ==27269== still reachable: 814,257 bytes in 13,152 blocks ==27269== suppressed: 0 bytes in 0 blocks ==27269== Reachable blocks (those to which a pointer was found) are not shown. ==27269== To see them, rerun with: --leak-check=full --show-leak-kinds=all wiper RESOLVED in r60351. sandis.neilands CLOSED. |
| Comment by Sandis Neilands (Inactive) [ 2016 May 26 ] |
|
Successfully tested the functionality. We should check the performance once those features that depend on this feature are implemented. |
| Comment by Andris Zeila [ 2016 May 27 ] |
|
Released in:
|
[ZBXNEXT-2869] don't require triggerid in event details page Created: 2015 Jul 05 Updated: 2016 Nov 09 |
|
| Status: | Open |
| Project: | ZABBIX FEATURE REQUESTS |
| Component/s: | Frontend (F) |
| Affects Version/s: | 2.4.5 |
| Fix Version/s: | None |
| Type: | Change Request | Priority: | Trivial |
| Reporter: | richlv | Assignee: | Unassigned |
| Resolution: | Unresolved | Votes: | 2 |
| Labels: | events | ||
| Remaining Estimate: | Not Specified | ||
| Time Spent: | Not Specified | ||
| Original Estimate: | Not Specified | ||
| Description |
|
event details page for some reason requires triggerid in addition to eventid. one usecase is something that pops up on irc every now and then - somebody got an eventid and they would like to know more about the event. unfortunately, currently it's not as easy as plugging the eventid in the event details page. |
[ZBXNEXT-2817] Statuses for event acknowledgement Created: 2015 May 18 Updated: 2015 May 18 |
|
| Status: | Open |
| Project: | ZABBIX FEATURE REQUESTS |
| Component/s: | Frontend (F), Server (S) |
| Affects Version/s: | 2.2.9, 2.4.5 |
| Fix Version/s: | None |
| Type: | Change Request | Priority: | Major |
| Reporter: | Kodai Terashima | Assignee: | Unassigned |
| Resolution: | Unresolved | Votes: | 0 |
| Labels: | acknowledgements, dashboard, escalations, events | ||
| Remaining Estimate: | Not Specified | ||
| Time Spent: | Not Specified | ||
| Original Estimate: | Not Specified | ||
| Description |
|
Currently event acknowledge has only two status, not-acknowledged and acknowledged. Escalations will be stopped and events will disappear from dashboard if events status become acknowledged status. There's a case I want to mark events to "confirmed" status, not stop escalations and still visible on dashboard. Also sometimes I make mistakes to add acknowledge message to incorrect events. This case I want to change back the events to not-acknowledged status. For those case, some statuses for acknowledge is useful for that case, like ticket management system:
|
| Comments |
| Comment by richlv [ 2015 May 18 ] |
note that escalations, dashboard and other places are customisable based on ack status (operation condition, frontend filters), they do not always take it into account - that's a user preference. having a hard dependency would remove that flexibility |
[ZBXNEXT-2562] Select proper time period when accessing history from trigger menu Created: 2014 Nov 04 Updated: 2014 Nov 04 |
|
| Status: | Open |
| Project: | ZABBIX FEATURE REQUESTS |
| Component/s: | Frontend (F) |
| Affects Version/s: | 2.2.7 |
| Fix Version/s: | None |
| Type: | Change Request | Priority: | Minor |
| Reporter: | Marc | Assignee: | Unassigned |
| Resolution: | Unresolved | Votes: | 0 |
| Labels: | events, history, menu, triggers, usability | ||
| Remaining Estimate: | Not Specified | ||
| Time Spent: | Not Specified | ||
| Original Estimate: | Not Specified | ||
| Description |
|
Wouldn't it be nice, when the history of an item shows the time window of the respective last event, if it as accessed via trigger menu? E.g. by setting zoom level to 1h and start time to 30 minutes before last change. |
[ZBXNEXT-2441] Significant performance impact when having Multiple PROBLEM events generation enabled Created: 2014 Sep 05 Updated: 2014 Sep 09 |
|
| Status: | Open |
| Project: | ZABBIX FEATURE REQUESTS |
| Component/s: | Server (S) |
| Affects Version/s: | 2.2.6 |
| Fix Version/s: | None |
| Type: | Change Request | Priority: | Trivial |
| Reporter: | Marc | Assignee: | Unassigned |
| Resolution: | Unresolved | Votes: | 0 |
| Labels: | events, performance | ||
| Remaining Estimate: | Not Specified | ||
| Time Spent: | Not Specified | ||
| Original Estimate: | Not Specified | ||
| Attachments: |
|
| Description |
|
I understand that having Multiple PROBLEM events generation enabled, inevitably causes a performance impact. Anyhow, while reproducing the scenario described in ~16:15 log items were activated
The observed behavior was (beside what already mentioned):
SELECT conditionid,
       conditiontype,
       operator,
       value
FROM   conditions
WHERE  actionid = <actionid>
ORDER  BY condition
SELECT DISTINCT hg.groupid
FROM   hosts_groups hg,
       hosts h,
       items i,
       functions f,
       triggers t
WHERE  hg.host
SELECT DISTINCT i.hostid
FROM   items i,
       functions f,
       triggers t
WHERE  i.itemid = f.itemid AND
       f.triggerid
SELECT templateid
FROM   triggers
WHERE  triggerid = <triggerid>
Just in case these statements are the cause for the performance difference, I wonder whether moving the related information into the configuration cache might speed up things... |
| Comments |
| Comment by Aleksandrs Saveljevs [ 2014 Sep 08 ] |
|
Marc, could you please describe what would be your desired outcome of this feature request? Enabling "Multiple PROBLEM events generation" means that an event is generated whenever a trigger evaluates to PROBLEM, as can be seen in process_trigger() function in src/libs/zbxdbhigh/db.c, and that leads to event processing sequence, as you observed with the SQL queries. Function process_trigger() also walks dependencies of that trigger and, most importantly, executes a database query to update "lastchange" field in the database. So a significant increase in server load is expected. The fact that one history syncer is busy for a long time is expected, too, because at most one history syncer can process one item's values, which is the case if you send millions of values for a single log item. If that is the main point of the report, then the issue might be better handled in already reported issues like |
| Comment by Marc [ 2014 Sep 08 ] |
|
The outcome, if that's possible at all, should be faster processing of cached values when having "Multiple PROBLEM events generation" set. I didn't had concerns about the blocked history syncer. It was just something i noticed and wanted to mention to draw the complete picture of my observation. However, what concerned me was the fact that the time after the high load (~17:15+ and ~21:20) the text cache appeared effectively not to be cleared anymore. Subjectively it seemed to grow by the rate of regular incoming text based data. I've no certain idea about the real root cause yet and thus no idea how it could be improved. Btw, it turned out that there were only two hosts with limited logging involved for testing. So the total count of send log values were just ~300k log values. Edit: Edit: |
| Comment by Aleksandrs Saveljevs [ 2014 Sep 09 ] |
There is no such (hardcoded) limit. What lead you to make this conclusion? |
| Comment by Marc [ 2014 Sep 09 ] |
|
I picked three or four blocks of events that were made at the very same second. These blocks always consisted of exactly 400 events. |
[ZBXNEXT-2388] grouping of events based on their root cause Created: 2014 Jul 21 Updated: 2017 May 31 Resolved: 2014 Jul 21 |
|
| Status: | Closed |
| Project: | ZABBIX FEATURE REQUESTS |
| Component/s: | Agent (G), Server (S) |
| Affects Version/s: | 2.2.1 |
| Fix Version/s: | None |
| Type: | Change Request | Priority: | Trivial |
| Reporter: | pes developer | Assignee: | Unassigned |
| Resolution: | Won't fix | Votes: | 0 |
| Labels: | events, trigger | ||
| Remaining Estimate: | Not Specified | ||
| Time Spent: | Not Specified | ||
| Original Estimate: | Not Specified | ||
| Environment: |
linux operating system |
||
| Description |
|
Hi, |
| Comments |
| Comment by richlv [ 2014 Jul 21 ] |
|
in zabbix, trigger functions along with their parameters are supposed to be used for this |
| Comment by pes developer [ 2014 Jul 21 ] |
|
Can you please show an example on this? |
| Comment by richlv [ 2014 Jul 21 ] |
|
please use zabbix irc, forums and other channels for community support. see https://www.zabbix.org/wiki/Getting_help for more detail |
[ZBXNEXT-2318] Have chronological event-list identical to events.php, but displaying only unacknowledged events Created: 2014 May 23 Updated: 2015 Jun 26 |
|
| Status: | Open |
| Project: | ZABBIX FEATURE REQUESTS |
| Component/s: | Frontend (F) |
| Affects Version/s: | None |
| Fix Version/s: | None |
| Type: | New Feature Request | Priority: | Trivial |
| Reporter: | Roman Fiedler | Assignee: | Unassigned |
| Resolution: | Unresolved | Votes: | 0 |
| Labels: | acknowledges, events, filters | ||
| Remaining Estimate: | Not Specified | ||
| Time Spent: | Not Specified | ||
| Original Estimate: | Not Specified | ||
| Description |
|
It might be quite convenient, to have a list similar to the current events.php, where one can see, which events were not acknowledged yet. This is especially handy, when working together with a collegue, to see, which events are still open to be addressed. This feature could be implemented in various ways, the simplest would be the duplication of the page. This can be tested easily on a Linux Zabbix 2.2.2 system using following commands: cp -a – /usr/share/zabbix/events.php /usr/share/zabbix/events_unack.php This will just create a duplicated page "events_unack.php" with the appropriate filter rule. Of course it would be nicer, to have it together with the standard "events.php" e.g. having a checkbox "show unaknowledged only". If this new feature would be found useful, please include at least the "tivial" version. |
[ZBXNEXT-2310] Possibility to map events against lunar phases Created: 2014 May 20 Updated: 2014 May 21 Resolved: 2014 May 20 |
|
| Status: | Closed |
| Project: | ZABBIX FEATURE REQUESTS |
| Component/s: | None |
| Affects Version/s: | None |
| Fix Version/s: | None |
| Type: | New Feature Request | Priority: | Minor |
| Reporter: | Janis Eisaks | Assignee: | Unassigned |
| Resolution: | Won't fix | Votes: | 0 |
| Labels: | charts, events | ||
| Remaining Estimate: | Not Specified | ||
| Time Spent: | Not Specified | ||
| Original Estimate: | Not Specified | ||
| Environment: |
platform independent |
||
| Description |
|
It could be nice having ability to chart events against lunar phases in order to get specific acivity pattern, for wich monthly charting does not fit |
| Comments |
| Comment by dimir [ 2014 May 20 ] |
|
Sorry, but, are you actually serious? |
| Comment by Janis Eisaks [ 2014 May 20 ] |
|
absolutely. At the company I work there is high correlation between the lunar phases and useless incoming mail which at the same time can not be qualified as spam. Such mapping seem interesting to our managers of activities. Of course, such monitoring could be made using various tools, but having all IT related monitoring in one place would be nice. |
| Comment by Aleksandrs Saveljevs [ 2014 May 20 ] |
|
Jānis, while I definitely agree that different ways of looking at time have their proper use, such a feature would be improper for an IT product meant for general public. |
| Comment by Janis Eisaks [ 2014 May 20 ] |
|
OK, dropping the specific periods like moon pahses - lets look at it other way
As for the curiosity - while it looks ridiculous, such data can be used for |
| Comment by Aleksandrs Saveljevs [ 2014 May 20 ] |
|
One of the characteristics of lunar days is that they are not equal in length, so adding the ability to define periodicity would only be of approximate value. Lunar day is also only one aspect of time and you might wish to consider other aspects, too. So what you are looking for in order to be precise is a general framework that would let user define a calendar system by providing some callback interface. A user would then provide such self-written callbacks to the calendar framework in Zabbix. So in order to graph by lunar days you would be required to write code anyway, and if you are required to write code anyway to address this custom need, you should probably just patch Zabbix yourself. Developing such a framework would complicate Zabbix code dramatically for the benefit of a small group of users. Perhaps, you could sign up for sponsored development, but it is unlikely to be developed on a voluntary basis. That was the reason for closing the issue originally. |
| Comment by Aleksandrs Saveljevs [ 2014 May 20 ] |
|
Perhaps a way to add labels to graphs through API might solve your problem: see ZBXNEXT-117. |
| Comment by richlv [ 2014 May 20 ] |
|
other use cases would be monitoring lighting and watering systems in correlation with lunar phases... but that is so highly specialised, i'd agree that for now it is unlikely to arrive in zabbix core. it would look nice on the feature list, though - but i guess per user timezone support is more useful, for example if interest in this feature reappears, let's reopen this feature request. still, was the interest to show lunar phases on the graph or or to have triggers react different ? triggers might be easier with an external datasource. graphs would be harder... |
| Comment by Janis Eisaks [ 2014 May 21 ] |
|
No, the idea was not to show phases on the graph, but graph according to lunar calendar - another item in granularity between week and standard month. Unfortunately, lunar month it is not a precise number of "solar" days (29,53 to be precise enough), as well as lunar week. |
| Comment by Janis Eisaks [ 2014 May 21 ] |
|
And what about potential Saudi Arabia clients? http://en.wikipedia.org/wiki/Lunar_calendar |
[ZBXNEXT-2246] Add detailed info/values to events via triggers Created: 2014 Apr 09 Updated: 2017 Jan 20 Resolved: 2017 Jan 20 |
|
| Status: | Closed |
| Project: | ZABBIX FEATURE REQUESTS |
| Component/s: | API (A), Frontend (F), Server (S) |
| Affects Version/s: | 2.2.1 |
| Fix Version/s: | None |
| Type: | Change Request | Priority: | Minor |
| Reporter: | Ryan Armstrong | Assignee: | Unassigned |
| Resolution: | Duplicate | Votes: | 3 |
| Labels: | events | ||
| Remaining Estimate: | Not Specified | ||
| Time Spent: | Not Specified | ||
| Original Estimate: | Not Specified | ||
| Issue Links: |
|
||||||||
| Description |
|
Essentially I want to be able to have an Item's value displayed and persisted in an Event's details for the lifetime of the event (and therefore in the Monitoring->Events page, Dashboard, etc.). This need became apparent when creating Triggering on Windows Event Logs. We have a rule to catch all 'Critical' events in the Windows System log. If 20 different log events are captured, Zabbix triggers and creates 20 Events, all of which have the exact same name (based on the Trigger name). I'd prefer instead to name them with macro substitutions for the event ID, source application, etc. and even include the full event log data (from Windows) in a field somewhere on the Zabbix Event. I understand this is a challenge for a few reasons: To overcome this issue, I've devised the following naive suggestions: \nDetails: {My Template:eventlog[...].value}" or 2. Create macros to reference an Item in a Template's expression by index (0, 1, etc) and then link to the Items history for the same time stamp (only valid while the history is maintained). Eg. TRIGGER.EXPRITEM1.VALUE, TRIGGER.EXPRITEM2.LOG.SOURCE, etc. Additionally, create an additional field for Events in the database which captures the resolved value so that it persists if Item history does not? |
| Comments |
| Comment by Oleksii Zagorskyi [ 2014 Apr 10 ] |
|
You did not mention ITEM.VALUE macro, which is different from mentioned ITEM.LASTVALUE macro. If you didn't know the ITEM.VALUE macro then it should resolve your requirements as I see. |
| Comment by Ryan Armstrong [ 2014 Sep 02 ] |
|
Does ITEM.VALUE always point to the value that occurred at the time of the Event? |
| Comment by Oleksii Zagorskyi [ 2014 Sep 02 ] |
|
yes, exactly, with nanoseconds precision. |
| Comment by Ryan Armstrong [ 2014 Sep 10 ] |
|
Thanks Oleksiy, I'll test and confirm. |
| Comment by Filipe Paternot [ 2015 Feb 03 ] |
|
Well i believe that this issue still important. Even though ITEM.VALUE retaining the detail as long as the data lives in history and ITEM.LASTVALUE showing the current value of the item, many times you don't actually keep the history for long. Thats the purpose of trends: you erase a bunch of data from history to keep it small (or at least manageable). It is just too expensive to keep what an enterprise environment needs from events inside the history. But the event, is somewhat more important than the history itself, at least in many cases. Considering Zabbix as a monitoring tool, the events it trigger are key for its existence. With that in mind, an Trigger Name within the Event Details should be persisted as long as the event stays in the database. It should not be related to history, as it can (and many times it will) return as UNKNOWN. We could implement this in two ways, i imagine: What do you guys think about this? |
| Comment by Glebs Ivanovskis (Inactive) [ 2017 Jan 20 ] |
|
Closing as duplicate of |
[ZBXNEXT-2170] Add support for viewing internal events in the web interface Created: 2014 Feb 20 Updated: 2019 Oct 10 |
|
| Status: | Open |
| Project: | ZABBIX FEATURE REQUESTS |
| Component/s: | Frontend (F) |
| Affects Version/s: | 2.2.2 |
| Fix Version/s: | None |
| Type: | Change Request | Priority: | Major |
| Reporter: | Strahinja Kustudic | Assignee: | Unassigned |
| Resolution: | Unresolved | Votes: | 8 |
| Labels: | events, internalmonitoring, usability | ||
| Remaining Estimate: | Not Specified | ||
| Time Spent: | Not Specified | ||
| Original Estimate: | Not Specified | ||
| Description |
|
Currently it is possible to create actions which send a notification when an internal event is triggered, but there is no way to view them in the web interface. It would be great if we could view internal events in the Triggers tab as well as the Events tab. |
| Comments |
| Comment by richlv [ 2014 Feb 27 ] |
|
as per https://www.zabbix.org/wiki/Docs/specs/ZBXNEXT-1575, displaying them during the initial development was "Discussed but will not be included" |
| Comment by Strahinja Kustudic [ 2014 Feb 28 ] |
|
Thanks for the answer, but that was then, things maybe different now? I don't see why the Events tab would need to be changed that much to display internal events, but I'm more interested in being able to display all unsupported items, which from my point of view should probably be displayed in the Triggers tab. It is really great that we can get an email when an item becomes unsupported, but it would be even nice if we could view all unsupported items. |
| Comment by richlv [ 2014 Mar 16 ] |
|
configuration -> hosts/templates, any item link, expand filter, set state to 'not supported' and clear host field |
| Comment by Strahinja Kustudic [ 2014 Mar 16 ] |
|
That view is awesome! The only thing it's missing is to be able to filter by maintenance status. Zabbix could really use a web front-end overhaul. It has so many great features which are hard to find, or never even discovered. |
| Comment by Marc [ 2014 Nov 02 ] |
|
I'd appreciate to optionally see internal events in a chronological order with proper filter functionality. This helps to see what recently happened without the need to create actions that fire lots of operations just to get this information. Beside the fact that it sounds a little bit cumbersome to use e.g. MUA filter functions to query recent internal events, the alerter is due to lack of |
| Comment by Raymond Kuiper [ 2016 Jan 20 ] |
|
Inclusion in "Monitoring -> Events -> Source: Internal" would be awesome |
| Comment by James Kirsop [ 2019 Oct 10 ] |
|
This forum thread presents a good use case why it would be helpful to have this UI feature added. Not having an easy way of viewing internal events means that problems with monitoring hosts and triggers on hosts themselves can't easily be identified and cleaned up, leading to other related issues. |
[ZBXNEXT-2141] Add maintenance status to the supported conditions for actions on internal events Created: 2014 Feb 02 Updated: 2017 Dec 16 |
|
| Status: | Open |
| Project: | ZABBIX FEATURE REQUESTS |
| Component/s: | Server (S) |
| Affects Version/s: | 2.2.1 |
| Fix Version/s: | None |
| Type: | Change Request | Priority: | Major |
| Reporter: | A B | Assignee: | Unassigned |
| Resolution: | Unresolved | Votes: | 5 |
| Labels: | actions, events, internalmonitoring, maintenance, patch | ||
| Remaining Estimate: | Not Specified | ||
| Time Spent: | Not Specified | ||
| Original Estimate: | Not Specified | ||
| Attachments: |
|
| Description |
|
Currently when creating actions for internal events, it is not possible to include the maintenance status in the conditions for that action, unlike for trigger based events. This is a problem since this means we get a bunch of high priority alerts when maintenance is performed. To give a little background: we have a host-group representing set of servers, where the actual servers are dynamically started and stopped according to load; a separate job takes care of detecting stopped hosts an marking them as not-monitored. Now, we need an alert if the number of servers ever goes to 0. For that we have a health item on each server (1 = healthy, 0 = bad), and then an aggregate host with an item grpsum["<host-group-of-the-servers>", <health-item>, last, 0], as well as a trigger on this grpsum item. The trigger will fire if all hosts have a health of 0 and there is at least one host; but if there are no (monitored) hosts in the host-group (all machines were stopped) then the grpsum item unfortunately goes into "not supported" state. Hence a separate action has been set up for this internal event. And just like actions for trigger based events, we need to be able to suppress this action when the host-group is put into maintenance. |
| Comments |
| Comment by Martin Hollerweger [ 2014 Mar 13 ] |
|
Same Problem here, i need to check if trigger goes to unknown. But if I restart Tomcat unfortunately all jmx triggers go to unknown and i get a lot of messages in my maintenance period. |
| Comment by Martin Hollerweger [ 2014 Mar 13 ] |
|
Also affects Zabbix version 2.2.2 and 2.2.0 |
| Comment by A B [ 2014 Mar 26 ] |
|
This patch implements the requested behavior. The maintenance option shows up in the UI (and works) just like for trigger based actions. We are running this in production. The patch is against svn r43648 on /branches/2.2 . |
| Comment by Michael Stockman [ 2015 Sep 08 ] |
|
Not solved in 2.4 |
| Comment by richlv [ 2016 Jan 20 ] |
|
also asked in ZBXNEXT-3104 |
| Comment by Oleksii Zagorskyi [ 2016 Feb 12 ] |
|
There could be other, much more simple cases why I don't want to receive alerts for internal events if a host in maintenance. |
| Comment by A B [ 2017 Dec 16 ] |
|
Updated patch for zabbix 3.4. |
[ZBXNEXT-2087] Custom fields to use and show in dashboard events Created: 2013 Dec 23 Updated: 2017 Feb 14 Resolved: 2016 Oct 18 |
|
| Status: | Closed |
| Project: | ZABBIX FEATURE REQUESTS |
| Component/s: | Frontend (F), Server (S) |
| Affects Version/s: | None |
| Fix Version/s: | 3.2.0alpha1 |
| Type: | New Feature Request | Priority: | Trivial |
| Reporter: | Ronny M | Assignee: | Unassigned |
| Resolution: | Fixed | Votes: | 7 |
| Labels: | events, tags | ||
| Remaining Estimate: | Not Specified | ||
| Time Spent: | Not Specified | ||
| Original Estimate: | Not Specified | ||
| Issue Links: |
|
||||||||||||||||
| Description |
|
I would like the have the possibility to add values/information to a custom field (summary, information, info, tag, key or something like that) which can be used to show additionally information in an event which can also be used in filters or triggers. Example use cases are:
If I think longer I can probably think of much more possible use cases for custom/additional columns/fields. fields should a least be able to be filled by custom_parameters, zabbix-sender, logfile items, traps and probably some more collection methods. |
| Comments |
| Comment by Marc [ 2013 Dec 24 ] |
|
By now the latter might be achieved partly by populating host inventory fields via items. Theses fields may then be used via macros. Since events are objects that don't exist before triggers change, I don't expect this to become an customizable object. The last missing part would then be to add proper filter functionality based on macros(macro values) - what should be easy to implement in most places |
| Comment by Marc [ 2016 Mar 15 ] |
|
|
| Comment by Andris Zeila [ 2016 Apr 27 ] |
|
(1) [S] Database patch created in development branch svn://svn.zabbix.com/branches/dev/ZBXNEXT-2087 sasha Successfully tested! CLOSED |
| Comment by Andris Zeila [ 2016 May 05 ] |
|
[S] Server side ready for review & testing. |
| Comment by Alexander Vladishev [ 2016 May 09 ] |
|
(2) [A] trigger.create(), triggerprototype.create(), trigger.update(), triggerprototype.update(): tags array must be validated:
gunarspujats RESOLVED in r59993 sasha the reason must be in such error messages instead of real value
REOPENED sasha RESOLVED in r60004 gunarspujats CLOSED |
| Comment by Alexander Vladishev [ 2016 May 09 ] |
|
(3) [A] CTriggerGeneral:504,678: check for an empty array is useless if (array_key_exists('tags', $trigger) && $trigger['tags']) { $this->validateAddTags($trigger['tags']); } gunarspujats RESOLVED in r59993 sasha CLOSED |
| Comment by Alexander Vladishev [ 2016 May 09 ] |
|
(4) [A] frontends/php/include/classes/api/services/CTriggerGeneral.php:884:906: $db_trigger['tags'] and $trigger['tags'] must be sorted before processing gunarspujats RESOLVED in r60002 sasha CLOSED |
| Comment by Alexander Vladishev [ 2016 May 09 ] |
|
(5) [A] "Undefined index" errors Undefined index: tag [hostgroups.php:63 → CFrontendApiWrapper->update() → CApiWrapper->__call() → CFrontendApiWrapper->callMethod() → CApiWrapper->callMethod() → CFrontendApiWrapper->callClientMethod() → CLocalApiClient->callMethod() → call_user_func_array() → CTrigger->update() → CTriggerGeneral->validateUpdate() → CTriggerGeneral->validateAddTags() → CArrayHelper::findDuplicate() in include/classes/helpers/CArrayHelper.php:204] Undefined index: value [hostgroups.php:63 → CFrontendApiWrapper->update() → CApiWrapper->__call() → CFrontendApiWrapper->callMethod() → CApiWrapper->callMethod() → CFrontendApiWrapper->callClientMethod() → CLocalApiClient->callMethod() → call_user_func_array() → CTrigger->update() → CTriggerGeneral->validateUpdate() → CTriggerGeneral->validateAddTags() → CArrayHelper::findDuplicate() in include/classes/helpers/CArrayHelper.php:207] Undefined index: tag [hostgroups.php:63 → CFrontendApiWrapper->update() → CApiWrapper->__call() → CFrontendApiWrapper->callMethod() → CApiWrapper->callMethod() → CFrontendApiWrapper->callClientMethod() → CLocalApiClient->callMethod() → call_user_func_array() → CTrigger->update() → CTriggerGeneral->updateReal() in include/classes/api/services/CTriggerGeneral.php:891] gunarspujats RESOLVED in r60002 sasha Have a look at my changes in r60009 gunarspujats CLOSED sasha checkTriggerTags() returns incorrect value if tags is not present. REOPENED sasha RESOLVED in 60013. gunarspujats CLOSED |
| Comment by Alexander Vladishev [ 2016 May 09 ] |
|
(6) [A] trigger.get() and triggerprototype.get() produces PHP errors with selectTags = API_OUTPUT_COUNT array_merge(): Argument #1 is not an array [hostgroups.php:64 → CFrontendApiWrapper->get() → CApiWrapper->__call() → CFrontendApiWrapper->callMethod() → CApiWrapper->callMethod() → CFrontendApiWrapper->callClientMethod() → CLocalApiClient->callMethod() → call_user_func_array() → CTrigger->get() → CTrigger->addRelatedObjects() → CTriggerGeneral->addRelatedObjects() → CApiService->outputExtend() → array_merge() in include/classes/api/CApiService.php:238] array_flip() expects parameter 1 to be array, null given [hostgroups.php:64 → CFrontendApiWrapper->get() → CApiWrapper->__call() → CFrontendApiWrapper->callMethod() → CApiWrapper->callMethod() → CFrontendApiWrapper->callClientMethod() → CLocalApiClient->callMethod() → call_user_func_array() → CTrigger->get() → CTrigger->addRelatedObjects() → CTriggerGeneral->addRelatedObjects() → CApiService->outputExtend() → array_flip() in include/classes/api/CApiService.php:238] array_keys() expects parameter 1 to be array, null given [hostgroups.php:64 → CFrontendApiWrapper->get() → CApiWrapper->__call() → CFrontendApiWrapper->callMethod() → CApiWrapper->callMethod() → CFrontendApiWrapper->callClientMethod() → CLocalApiClient->callMethod() → call_user_func_array() → CTrigger->get() → CTrigger->addRelatedObjects() → CTriggerGeneral->addRelatedObjects() → CApiService->outputExtend() → array_keys() in include/classes/api/CApiService.php:238] Undefined index: triggerid [hostgroups.php:64 → CFrontendApiWrapper->get() → CApiWrapper->__call() → CFrontendApiWrapper->callMethod() → CApiWrapper->callMethod() → CFrontendApiWrapper->callClientMethod() → CLocalApiClient->callMethod() → call_user_func_array() → CTrigger->get() → CTrigger->addRelatedObjects() → CTriggerGeneral->addRelatedObjects() → CApiService->createRelationMap() in include/classes/api/CApiService.php:327] Undefined index: triggerid [hostgroups.php:64 → CFrontendApiWrapper->get() → CApiWrapper->__call() → CFrontendApiWrapper->callMethod() → CApiWrapper->callMethod() → CFrontendApiWrapper->callClientMethod() → CLocalApiClient->callMethod() → call_user_func_array() → CTrigger->get() → CTrigger->addRelatedObjects() → CTriggerGeneral->addRelatedObjects() → CApiService->createRelationMap() in include/classes/api/CApiService.php:327] gunarspujats RESOLVED in r60007 sasha CLOSED |
| Comment by Alexander Vladishev [ 2016 May 09 ] |
|
(7) [A] Have a look at my changes in r59985. gunarspujats CLOSED |
| Comment by Alexander Vladishev [ 2016 May 10 ] |
|
(8) [A] better naming of validateAddTags(): checkTriggerTags()? gunarspujats RESOLVED in r60002 sasha CLOSED |
| Comment by Alexander Vladishev [ 2016 May 10 ] |
|
(9) [A] "selectTags" => API_OUTPUT_EXTEND returns triggertagid and triggerid sasha RESOLVED in r60010 (CTriggerGeneral), r60012 (CEvent) gunarspujats Deletion of old tags is broken. REOPENED sasha RESOLVED in r60015 gunarspujats CLOSED |
| Comment by Alexander Vladishev [ 2016 May 10 ] |
|
API was successfully tested! |
| Comment by Alexander Vladishev [ 2016 May 11 ] |
|
(10) XML import/export sasha RESOLVED in r60018 gunarspujats CLOSED |
| Comment by Alexander Vladishev [ 2016 May 11 ] |
|
(11) [A] trigger tags inheritance doesn't work sasha RESOLVED in r60020 gunarspujats CLOSED |
| Comment by Gunars Pujats (Inactive) [ 2016 May 11 ] |
|
(12) [F] Tags input form in triggers and trigger prototypes. gunarspujats RESOLVED in r60028 (triggers), r60033 (trigger prototypes).
REOPENED gunarspujats RESOLVED in r60091 sasha Tags sorting should be applied in the form. REOPENED gunarspujats RESOLVED in r60111 sasha CLOSED |
| Comment by Alexander Vladishev [ 2016 May 12 ] |
|
(13) [I] added new field value2 into conditions table wiper CLOSED |
| Comment by Alexander Vladishev [ 2016 May 12 ] |
|
(14) [S] action conditions processing doesn't respect tag field for "Tag value" condition wiper RESOLVED in r60084 sasha CLOSED |
| Comment by Alexander Vladishev [ 2016 May 14 ] |
|
(15) [S] lld_trigger.c trigger tags are not validated wiper RESOLVED in r60096. sasha Trigger tag cannot contain '/'. It must be validated. REOPENED wiper RESOLVED in r60112. sasha CLOSED with minor fix in r60123 |
| Comment by Alexander Vladishev [ 2016 May 14 ] |
|
(16) [S] src/zabbix_server/events.c:193 Only tag cannot contain character '/'. if (0 != strchr(event_tag_local.tag->tag, '/') || 0 != strchr(event_tag_local.tag->value, '/')) wiper RESOLVED in r60110 sasha CLOSED |
| Comment by Alexander Vladishev [ 2016 May 14 ] |
|
(17) [S] src/zabbix_server/events.c:195 seems this code is useless zbx_free_tag(event_tag_local.tag); events[i].tags.values[j] = events[i].tags.values[--events[i].tags.values_num]; j--; wiper RESOLVED in r60110 sasha CLOSED |
| Comment by Alexander Vladishev [ 2016 May 16 ] |
|
(18) [S] Have a look at my changes in r60102, r60103, r60104, r60105, r60106, r60107, r60108 and r60109 wiper CLOSED |
| Comment by Alexander Vladishev [ 2016 May 16 ] |
|
(19) [AF] Tags sorting should be removed from event.get and trigger.get. gunarspujats RESOLVED in r60111 sasha CLOSED |
| Comment by Gunars Pujats (Inactive) [ 2016 May 16 ] |
|
(20) [AF] New action conditions "Tag" and "Tag value". gunarspujats RESOLVED in r60111 sasha CLOSED with minor changes in r60125 |
| Comment by Alexander Vladishev [ 2016 May 17 ] |
|
Successfully tested! |
| Comment by Alexander Vladishev [ 2016 May 18 ] |
|
Available in pre-3.1.0 (trunk) r60130. |
| Comment by Aleksandrs Saveljevs [ 2016 Jun 06 ] |
|
This seems to have caused |
| Comment by Martins Valkovskis [ 2016 Jun 15 ] |
|
(21) Updated documentation: Trigger configuration screenshots in LLD will be updated in the viewable LLD items/triggers/graphs task. RESOLVED glebs.ivanovskis As I understand {ITEM.LASTVALUE} is supported in Event tags too. sasha {ITEM.LASTVALUE} is supported in Event tags and values. There are no differences between these macros. Documentation must be updated. martins-v Updated: RESOLVED sasha Thanks! CLOSED |
| Comment by Andris Zeila [ 2016 Jun 20 ] |
|
(22) [I] Database upgrade can get stuck if there are more than 10k discovery/autoregistration events in row. wiper RESOLVED in r60700 sasha CLOSED Fixed in pre-3.1.0 (trunk) r60821 |
| Comment by Andris Zeila [ 2016 Jun 28 ] |
|
(23) [F] Trigger tag
{{ITEM.VALUE}.regsub("CLASS:([a-zA-Z0-9/]+)","\1")}
fails validation while being valid. Probably because of / symbol in macro function parameters. Macros can be used in both - trigger tags and tag values. sasha RESOLVED in r60802 gunarspujats Coding style
sasha RESOLVED in r60819 gunarspujats CLOSED Fixed in pre-3.1.0 (trunk) r60821 |
| Comment by Alexander Vladishev [ 2016 Jun 30 ] |
|
(25) [D] API documentation:
sandis.neilands Description for tags except for "correlation_tag" is missing. iivs Updated:
RESOLVED sasha The wrong example for trigger prototypes methods. LLD macros are not included in the description and expression. REOPENED iivs Couldn't think of anything logical, so I deleted the that example and added tags for the first example. Updated:
RESOLVED sasha Looks good to me. Thank you! CLOSED |
| Comment by Glebs Ivanovskis (Inactive) [ 2016 Jul 11 ] |
|
(26) [S] Thanks to gunarspujats for discovering a crash! wiper I remember fixing this in one event correlation related branch. As the corresponding branches (3274, 3277) are already merged in trunk - this might be fixed. Have to check. glebs.ivanovskis Yes, I confirm that. +++ src/libs/zbxdbhigh/lld_trigger.c (revision 61049) @@ -1905,6 +1941,7 @@ zbx_vector_ptr_create(&db_trigger->functions); zbx_vector_ptr_create(&db_trigger->dependencies); zbx_vector_ptr_create(&db_trigger->dependents); + zbx_vector_ptr_create(&db_trigger->tags); zbx_vector_ptr_append(&db_triggers, db_trigger); } CLOSED |
[ZBXNEXT-2081] Filtering option for vmware.event item key Created: 2013 Dec 20 Updated: 2024 Apr 10 Resolved: 2020 Mar 29 |
|
| Status: | Closed |
| Project: | ZABBIX FEATURE REQUESTS |
| Component/s: | Documentation (D) |
| Affects Version/s: | 2.2.1, 4.0.17 |
| Fix Version/s: | 5.0 (plan) |
| Type: | New Feature Request | Priority: | Trivial |
| Reporter: | Kodai Terashima | Assignee: | Andrejs Kozlovs |
| Resolution: | Fixed | Votes: | 5 |
| Labels: | events, filters, vmware | ||
| Remaining Estimate: | Not Specified | ||
| Time Spent: | Not Specified | ||
| Original Estimate: | Not Specified | ||
| Issue Links: |
|
||||
| Team: | |
||||
| Sprint: | Sprint 61 (Feb 2020), Sprint 62 (Mar 2020) | ||||
| Story Points: | 0.25 | ||||
| Description |
|
Having a filtering option for vmware.eventlog would be nice to remove unnecessary events. The original request is an ability to filter out login/logout event from Zabbix server. |
| Comments |
| Comment by Kim Jongkwon [ 2018 Jul 26 ] |
|
To clarify, |
| Comment by Alexei Vladishev [ 2020 Feb 17 ] |
|
It will be implemented in Zabbix 5.0, the work is already in progress. |
| Comment by Alexander Vladishev [ 2020 Mar 29 ] |
|
Updated documentation: |
[ZBXNEXT-1905] event count in the graph Created: 2013 Sep 12 Updated: 2013 Sep 21 Resolved: 2013 Sep 21 |
|
| Status: | Closed |
| Project: | ZABBIX FEATURE REQUESTS |
| Component/s: | Frontend (F) |
| Affects Version/s: | 2.0.9 |
| Fix Version/s: | None |
| Type: | Change Request | Priority: | Minor |
| Reporter: | Jan Ostrochovsky | Assignee: | Unassigned |
| Resolution: | Duplicate | Votes: | 0 |
| Labels: | events, graphs | ||
| Remaining Estimate: | Not Specified | ||
| Time Spent: | Not Specified | ||
| Original Estimate: | Not Specified | ||
| Environment: |
Linux CentOS |
||
| Issue Links: |
|
||||||||
| Description |
|
When displaying graph through Latest data > host > item > Graph (e.g. for CPU iowait), there is info about related triggers at the bottom. It could be useful having also information about how many times was the trigger active during selected period of time... or maybe possibility to display lists of related triggers events with how long was their duration... possibly percent of time trigger-on vs. trigger-off. |
| Comments |
| Comment by richlv [ 2013 Sep 12 ] |
|
could also be shown directly on the graph - ZBXNEXT-414 |
| Comment by Oleksii Zagorskyi [ 2013 Sep 21 ] |
|
I'd say it indeed duplicates ZBXNEXT-414, idea is the same. |
[ZBXNEXT-1859] Do not insert events related with autoregistration if actions are not configured Created: 2013 Aug 16 Updated: 2016 Oct 22 Resolved: 2016 Oct 22 |
|
| Status: | Closed |
| Project: | ZABBIX FEATURE REQUESTS |
| Component/s: | Server (S) |
| Affects Version/s: | 2.0.8, 2.1.2 |
| Fix Version/s: | 2.2.16, 3.0.6, 3.2.2, 3.4.0alpha1 |
| Type: | Change Request | Priority: | Minor |
| Reporter: | Alexey Pustovalov | Assignee: | Unassigned |
| Resolution: | Fixed | Votes: | 0 |
| Labels: | events, performance | ||
| Remaining Estimate: | Not Specified | ||
| Time Spent: | Not Specified | ||
| Original Estimate: | Not Specified | ||
| Attachments: |
|
||||
| Issue Links: |
|
||||
| Description |
|
All Zabbix agents is configured to support Active checks generate autoregistration events even when no actions of auto-registration. |
| Comments |
| Comment by Oleksii Zagorskyi [ 2013 Aug 22 ] |
|
In first comment here http://blog.zabbix.com/multiple-servers-for-active-agent-sure/858/ I mentioned opposite - from 2.0 agents do not ask list of active checks by default. |
| Comment by Vladislavs Sokurenko [ 2016 Oct 10 ] |
|
Fixed in development branch svn://svn.zabbix.com/branches/dev/ZBXNEXT-1859 |
| Comment by Alexander Vladishev [ 2016 Oct 11 ] |
|
(1) an empty transaction 518:20161011:131121.928 In process_areg_data() 518:20161011:131121.928 query [txnlev:1] [begin;] 518:20161011:131121.928 In DBregister_host_flush() 518:20161011:131121.928 In process_events() events_num:0 518:20161011:131121.928 End of process_events() 518:20161011:131121.928 End of DBregister_host_flush() 518:20161011:131121.928 query [txnlev:1] [commit;] 518:20161011:131121.929 End of process_areg_data():SUCCEED vso RESOLVED in r63089 sasha CLOSED |
| Comment by Alexander Vladishev [ 2016 Oct 11 ] |
|
(2) This solution is not optimal:
vso RESOLVED in r63107, r63108, r63121, r63122 sasha CLOSED |
| Comment by Alexander Vladishev [ 2016 Oct 11 ] |
|
(3) DB_DSICOVERED_HOST
vso RESOLVED in r63107, r63108, r63121, r63122 sasha CLOSED |
| Comment by Alexander Vladishev [ 2016 Oct 11 ] |
|
(4) add_dhost()
vso RESOLVED in r63107, r63108, r63121, r63122 sasha CLOSED |
| Comment by Alexander Vladishev [ 2016 Oct 11 ] |
|
(5) Incorrect formatting for SQL statements:
    "select autoreg_hostid"
    " from autoreg_host"
    " where proxy_hostid%s"
    " and host='%s'"
    ZBX_SQL_NODE,
Correct:
    "select autoreg_hostid"
    " from autoreg_host"
    " where proxy_hostid%s"
        " and host='%s'"
        ZBX_SQL_NODE,
vso RESOLVED in r63107, r63108, r63121, r63122 sasha CLOSED |
| Comment by Alexander Vladishev [ 2016 Oct 12 ] |
|
(6) DBregister_host_active(): check for actions must be called only when auto-registration data is not empty vso RESOLVED in r63131 sasha CLOSED |
| Comment by Alexander Vladishev [ 2016 Oct 12 ] |
|
(7) Have a look at my changes in r63128 |
| Comment by Alexander Vladishev [ 2016 Oct 17 ] |
|
(8) The code was completely rewritten in r63182. |
| Comment by Vladislavs Sokurenko [ 2016 Oct 18 ] |
|
(9) Have a look at my changes in r63222 sasha Thanks a lot! CLOSED with minor fix in r63245. |
| Comment by Vladislavs Sokurenko [ 2016 Oct 18 ] |
|
(10) Have a look at my changes in r63234 sasha Thanks! CLOSED |
| Comment by Vladislavs Sokurenko [ 2016 Oct 18 ] |
|
Fixed conflicts in development branch svn://svn.zabbix.com/branches/dev/ZBXNEXT-1859-3.0 sasha Successfully tested with minor fix in r63255. |
| Comment by Vladislavs Sokurenko [ 2016 Oct 19 ] |
|
Fixed conflicts in development branch svn://svn.zabbix.com/branches/dev/ZBXNEXT-1859-3.2 sasha Successfully tested with minor improvements in r63287. |
| Comment by Alexander Vladishev [ 2016 Oct 19 ] |
|
(11) [D] broken 2.2/ChangeLog -New features: +New features:i vso RESOLVED in r63283 sasha CLOSED |
| Comment by Vladislavs Sokurenko [ 2016 Oct 20 ] |
|
Fixed in:
|
| Comment by Alexander Vladishev [ 2016 Oct 20 ] |
|
(12) Documentation
martins-v RESOLVED in upgrade notes/what's new. Auto-registration pages already mention that an auto-registration action must be present. It does not mention explicitly what happens with event generation. Do we need to update anything? sasha Thanks! It will be enough. CLOSED |
[ZBXNEXT-1842] Indicator/Event if log monitoring exceeds the lines per second threshold Created: 2013 Jul 28 Updated: 2013 Jul 28 |
|
| Status: | Open |
| Project: | ZABBIX FEATURE REQUESTS |
| Component/s: | Agent (G) |
| Affects Version/s: | 2.0.6 |
| Fix Version/s: | None |
| Type: | New Feature Request | Priority: | Major |
| Reporter: | Marc | Assignee: | Unassigned |
| Resolution: | Unresolved | Votes: | 1 |
| Labels: | events, logmonitoring, reliability | ||
| Remaining Estimate: | Not Specified | ||
| Time Spent: | Not Specified | ||
| Original Estimate: | Not Specified | ||
| Description |
|
It would be nice to have some kind of (internal) event or at least an undisruptive visual indication if a log[*] or logrt[*] item exceeds MaxLinesPerSecond (maybe considering both s_count and p_count separately) To me MaxLinesPerSecond is a very important feature and should be configured wisely for every log item individually. |
[ZBXNEXT-1807] Timed Triggers Created: 2013 Jul 01 Updated: 2013 Jul 02 Resolved: 2013 Jul 02 |
|
| Status: | Closed |
| Project: | ZABBIX FEATURE REQUESTS |
| Component/s: | Server (S) |
| Affects Version/s: | 2.0.4 |
| Fix Version/s: | None |
| Type: | Change Request | Priority: | Minor |
| Reporter: | Jiann-Ming Su | Assignee: | Unassigned |
| Resolution: | Duplicate | Votes: | 0 |
| Labels: | events, multiple, triggers | ||
| Remaining Estimate: | Not Specified | ||
| Time Spent: | Not Specified | ||
| Original Estimate: | Not Specified | ||
| Environment: |
RedHat el6.3 |
||
| Issue Links: |
|
||||||||
| Description |
|
It would be nice if a trigger with multiple items could be checked once over a period of time rather than each time one of the items has been checked. For example, I have a trigger with two items. And, the trigger is configured to alert on multiple true events. Item1 and Item2 are checked every 30 minutes, and the trigger conditions use change() for both items. The problem is if Item2 is checked 5 minutes after Item1, then this generates two events, even though the data may be the same. That is, Item1.change()=1 and sets off the trigger. Five minutes later, Item2.change()=0, but because Item1.change()=1 from 5 minutes ago, a different Event ID is generated. So I get two alerts on basically the same data. |
| Comments |
| Comment by Oleksii Zagorskyi [ 2013 Jul 02 ] |
|
I guess this example is the same as in ZBXNEXT-391 probably could help to resolve this issue. Hint: create a template with these items, remove existing ones from a host, link the template to the host and in a result these two items will be polled with 1 second interval between them (there is a quite complex logic and it depends on item IDs). |
[ZBXNEXT-1753] Event CSV export for specific period Created: 2013 May 20 Updated: 2024 Feb 27 |
|
| Status: | Open |
| Project: | ZABBIX FEATURE REQUESTS |
| Component/s: | Frontend (F) |
| Affects Version/s: | 2.0.6, 2.1.1 |
| Fix Version/s: | None |
| Type: | Change Request | Priority: | Minor |
| Reporter: | Kodai Terashima | Assignee: | Unassigned |
| Resolution: | Unresolved | Votes: | 9 |
| Labels: | csv, events, export, usability | ||
| Remaining Estimate: | Not Specified | ||
| Time Spent: | Not Specified | ||
| Original Estimate: | Not Specified | ||
| Issue Links: |
|
||||||||||||||||
| Description |
|
Currently CSV export function exports only listed events in screen. Ability of export specific period function would be nice for reporting recent problems in system. For example, exporting last month events is helpful for creating monthly problem report. |
| Comments |
| Comment by richlv [ 2014 Mar 19 ] |
|
remotely related - i tried to automate this with curl some time ago and there were undefined indexes : |
| Comment by Oleksii Zagorskyi [ 2015 Oct 17 ] |
|
duplicating |
| Comment by Watcharin Yang-Ngam [ 2018 Nov 21 ] |
|
Now, Have any update for this change request? |
| Comment by Oleksii Zagorskyi [ 2019 Sep 11 ] |
|
In current version 4.2 there no separate page for Events. |
| Comment by Alex Kalimulin [ 2024 Feb 27 ] |
|
kodai, can we close this? This is not the case anymore since 4.0.15 (see |
Need ability to alert on UNKNOWN state.
(ZBXNEXT-341)
|
|
| Status: | Closed |
| Project: | ZABBIX FEATURE REQUESTS |
| Component/s: | API (A), Frontend (F), Server (S) |
| Affects Version/s: | 2.1.0 |
| Fix Version/s: | 2.1.0 |
| Type: | Change Request (Sub-task) | Priority: | Major |
| Reporter: | Alexei Vladishev | Assignee: | Unassigned |
| Resolution: | Fixed | Votes: | 1 |
| Labels: | actions, events, notsupported | ||
| Remaining Estimate: | Not Specified | ||
| Time Spent: | Not Specified | ||
| Original Estimate: | Not Specified | ||
| Attachments: |
|
||||||||
| Issue Links: |
|
||||||||
| Description |
|
See https://www.zabbix.org/wiki/Docs/specs/ZBXNEXT-1575 for detailed specification. |
| Comments |
| Comment by Pavels Jelisejevs (Inactive) [ 2013 Jan 23 ] |
|
|
| Comment by Andris Zeila [ 2013 Feb 04 ] |
|
(1) database upgrade fails on DB2
After manual reorg on the table the database upgrade finishes successfully. sasha RESOLVED in r33397 dimir CLOSED |
| Comment by Andris Zeila [ 2013 Feb 11 ] |
|
(2) trigger nanosecond field might contain random value src/libs/zbxdbcache/nextchecks.c:140
timespecs = zbx_malloc(timespecs, nextcheck_num * sizeof(zbx_timespec_t));
...
for (i = 0; i < nextcheck_num; i++)
{
	itemids[i] = nextchecks[i].itemid;
	timespecs[i].sec = nextchecks[i].now;
	errors[i] = nextchecks[i].error_msg;
}
The nanosecond part of timespecs[] items is not initialized. sasha RESOLVED in r33545. dimir CLOSED |
| Comment by Pavels Jelisejevs (Inactive) [ 2013 Feb 15 ] |
|
The frontend is ready for testing. The development branch is available in svn://svn.zabbix.com/branches/dev/ZBXNEXT-1575. |
| Comment by Alexander Vladishev [ 2013 Feb 15 ] |
|
Updated documentation: |
| Comment by dimir [ 2013 Feb 18 ] |
|
(3) [F] Small suggestion. The spec says about "Report not supported items" action condition: Item state not supported but the frontend says: Item in "not supported" state Also on the actions list page the "Conditions" have nested quoted strings: Event type = "Item in "not supported" state" I suggest changing these messages in frontend like specs say: <SOMETHING> in "<STATE>" state -> <SOMETHING> state "<STATE>" and getting rid of nested quoted strings on actions list page. <Sasha> The strings was changed after discussion with Martins. Specification was changed too. jelisejev We've also decided, that the value of an action condition will be displayed in italic, instead of quotes. RESOLVED in r34751. <Sasha> Successfully TESTED. Code review are needed. oleg.egorov CLOSED |
| Comment by dimir [ 2013 Feb 28 ] |
|
(5) [F] Unlinking a default host "Zabbix server" after clean install from both templates gives error when trying to save host: Cannot delete templated trigger "Zabbix alerter processes more than 75% busy: {Zabbix server:zabbix[process,alerter,avg,busy].min(600)}>75". Image (zbxnext-1575-frontend-template-unlink-error.png) attached. oleg.egorov Impossible unlink template not only for default host. I can't unlink windows template from new host. jelisejev RESOLVED in r34566. oleg.egorov CLOSED |
| Comment by Oleg Egorov (Inactive) [ 2013 Mar 01 ] |
|
(6) [F] Incorrect object "0" (trigger) for source "1" (discovery), only the following objects are supported: 1 - discovered host, 2 - discovered service. jelisejev RESOLVED in r34604. oleg.egorov CLOSED |
| Comment by Oleg Egorov (Inactive) [ 2013 Mar 01 ] |
|
(7) [F] configuration.triggers.list.php: 184 and 191 too looooong rows defines.inc.php:426 unnecessary tab CEvent.php:54 and 63 row, please remove "," forms.inc.php:531 and 569 please remove "," configuration.action.edit.php:321, 448 long rows actions.inc.php:594 please remove "," CTrigger.php: 1002 unnecessary row break jelisejev RESOLVED in r34568. oleg.egorov CLOSED |
| Comment by Oleg Egorov (Inactive) [ 2013 Mar 01 ] |
|
(8) [F] Impossible acknowledge trigger from Monitoring->overview oleg.egorov CLOSED |
| Comment by Oleg Egorov (Inactive) [ 2013 Mar 01 ] |
|
(9)[F] Monitoring->Dashboard->Last 20 issue missing Ack column jelisejev CLOSED. |
| Comment by Oleg Egorov (Inactive) [ 2013 Mar 01 ] |
|
(10)[F] If open trigger event for "acknowledge" Argument 1 passed to CMacrosResolverHelper::resolveTriggerName() must be an array, null given, called in /var/www/oleg/ZBXNEXT-1575/frontends/php/acknow.php on line 144 and defined [acknow.php:144 → CMacrosResolverHelper::resolveTriggerName() in /var/www/oleg/ZBXNEXT-1575/frontends/php/include/classes/macros/CMacrosResolverHelper.php:74] jelisejev I cannot reproduce this problem. oleg.egorov EventId = 328 - don't exist... Same problem in trunk. jelisejev RESOLVED in r34727. oleg.egorov CLOSED |
| Comment by Oleg Egorov (Inactive) [ 2013 Mar 01 ] |
|
(11)[F] Missing Ack column in Monitoring->Events oleg.egorov CLOSED |
| Comment by Oleg Egorov (Inactive) [ 2013 Mar 04 ] |
|
(12)[F] In tr_events.php lost "Acknowledges table". oleg.egorov CLOSED |
| Comment by Oleg Egorov (Inactive) [ 2013 Mar 04 ] |
|
(13)[F] If we have in event.acknowledge (CEvent.php:769) Request like this:
{
        "eventids": [40, 41, 42, 43, 44, 45, 46, 47...],
        "message": "Problem resolved."
}
And events is not in "allowed". Then we have too much SQL queries. I think better collect not allowed events and then in one query check all ID's. jelisejev The additional API request will be executed only once, no matter how many valid or invalid IDs there will be. After that it will fail with an error oleg.egorov CLOSED |
| Comment by Pavels Jelisejevs (Inactive) [ 2013 Mar 05 ] |
|
(14)[A] Implement changes to the alert API described in the specs. jelisejev RESOLVED in r34624-34687. oleg.egorov CLOSED |
| Comment by Oleg Egorov (Inactive) [ 2013 Mar 05 ] |
|
(15)[F] Removed
define('ITEM_STATUS_NOTSUPPORTED', 3);
from defines.inc.php ITEM_STATUS_NOTSUPPORTED used in c20ImportFormatter.php in 138 and 170 lines. jelisejev RESOLVED in r34571. oleg.egorov CLOSED |
| Comment by dimir [ 2013 Mar 05 ] |
|
Server side successfully tested. Please review my changes in r33719:33794, r33805, r33858:34018. |
| Comment by dimir [ 2013 Mar 21 ] |
|
(16) [D] Please document the new macros related to and {LLDRULE.KEY.ORIG}should be mentioned in https://www.zabbix.com/documentation/2.2/manual/introduction/whatsnew220 You can ask me for details on where this is supported or just ask me to document it. <Sasha> RESOLVED dimir CLOSED |
| Comment by Pavels Jelisejevs (Inactive) [ 2013 Mar 25 ] |
|
(17) When creating a new item or LLD rule, the "Enabled" checkbox is not checked by default. jelisejev RESOLVED in r34688. oleg.egorov CLOSED |
| Comment by Oleg Egorov (Inactive) [ 2013 Mar 27 ] |
|
(18) Review my minor changes in r34668 jelisejev Good. CLOSED. |
| Comment by Oleg Egorov (Inactive) [ 2013 Mar 28 ] |
|
(19) Administration->Notifications Fatal error: Maximum execution time of 600 seconds exceeded in /var/www/oleg/ Don't work... jelisejev RESOLVED IN r34701 oleg.egorov CLOSED |
| Comment by Oleg Egorov (Inactive) [ 2013 Apr 02 ] |
|
(20) [F] Host full clone Created: Application "admin_item" on "admin2".
Created: Item "admin_item" on "admin2".
Created: Trigger "admin_trigger" on "admin2".
Cannot set "state" for item "admin_discovery".
jelisejev RESOLVED in r34731. oleg.egorov CLOSED |
| Comment by Oleg Egorov (Inactive) [ 2013 Apr 03 ] |
|
TESTED. |
| Comment by Pavels Jelisejevs (Inactive) [ 2013 Apr 03 ] |
|
Available in 2.1.0 r34766. |
| Comment by Pavels Jelisejevs (Inactive) [ 2013 Apr 03 ] |
|
(21) Documentation needs to be updated. martins-v Updated sections: (with internal event info) (regarding logic of Status column) (action conditions for internal event actions added) A new how-to section for receiving notification on unsupported items: Updated screenshots: (trigger display without 'unknown' value) (trigger display without 'unknown' value in Status of Zabbix) (no 'unknown' column) (Enabled field with a check-box) (Filter screenshot has a State attribute) Ok, the changes mentioned in the spec seem to be covered. If somebody has time to review these, that'd be great. |
| Comment by Pavels Jelisejevs (Inactive) [ 2013 Apr 03 ] |
|
(22) The API docs and changelog needs to be updated. jelisejev Updated: https://www.zabbix.com/documentation/2.2/manual/api/reference/event/get https://www.zabbix.com/documentation/2.2/manual/api/reference/item/object https://www.zabbix.com/documentation/2.2/manual/api/reference/discoveryrule/object https://www.zabbix.com/documentation/2.2/manual/api/reference/trigger/object |
| Comment by richlv [ 2013 Apr 03 ] |
|
(23) would be great to do some basic performance analysis/testing - would the generation of new events have negative impact in some cases (like lots of items/triggers going into unsupported/unknown state). |
| Comment by richlv [ 2013 Apr 09 ] |
|
was this issue closed so nobody would notice we didn't bother to document it properly ? |
| Comment by richlv [ 2013 Apr 09 ] |
|
...and i do not think documentation work can properly start because we do not have a finished specification. unfortunately. i was assured that the spec is complete, which sounds great. gotta read it |
| Comment by Alexander Vladishev [ 2013 Apr 16 ] |
|
(25) [S] BLOCKER! Zabbix server crashes. 31849:20130416:150308.603 In update_triggers_status_to_unknown() hostid:10084
31849:20130416:150308.605 query [txnlev:0] [select distinct t.triggerid,t.description,t.expression,t.priority,t.type,t.value,t.state,t.error,t.lastchange from items i,functions f,triggers t,
hosts h where i.itemid=f.itemid and f.triggerid=t.triggerid and i.hostid=h.hostid and i.status=0 and i.state=0 and i.type in (0) and f.function not in ('nodata','date','dayofmonth','dayofweek
','time','now') and t.status=0 and h.hostid=10084 and h.status=0 and not exists (select 1 from functions f2,items i2,hosts h2 where f2.triggerid=f.triggerid and f2.itemid=i2.itemid and i2.hostid=h2.hostid and (f2.function in ('nodata','date','dayofmonth','dayofweek','time','now') or (i2.type not in (0) and (i2.type not in (0,1,4,6,12,16) or (i2.type in (0) and h2.available=1) or (i2.type in (1,4,6) and h2.snmp_available=1) or (i2.type in (12) and h2.ipmi_available=1) or (i2.type in (16) and h2.jmx_available=1)))) and i2.status=0 and i2.state=0 and h2.status=0) order by t.triggerid]
31843:20130416:150308.655 One child process died (PID:31849,exitcode/signal:1). sig_exiting ...
wiper reviewed and successfully tested. CLOSED sasha fixed in version pre-2.1.0 r35068. |
| Comment by richlv [ 2013 May 07 ] |
|
(27) this probably solved the following, too - please, verify :
<richlv> closed |
| Comment by richlv [ 2013 May 24 ] |
|
(28) currently a problem exists. if we filter for "not supported", we also show disabled items without any indication why. we can : a) implement some visualisation for such items; it was decided to go with (c) jelisejev RESOLVED in svn://svn.zabbix.com/branches/dev/ZBXNEXT-1575. <richlv> commit message said something about disabling one filter when another is in use (thanks for mentioning that jelisejev done https://www.zabbix.org/mw/index.php5?title=Docs%2Fspecs%2FZBXNEXT-1575&diff=4369&oldid=4318 Eduards REOPEN jelisejev RESOLVED in r36139 and r36143. |
| Comment by Eduards Samersovs (Inactive) [ 2013 Jun 07 ] |
|
Tested! |
| Comment by Pavels Jelisejevs (Inactive) [ 2013 Jun 07 ] |
|
Implemented in 2.1.0 r36160. CLOSED. |
| Comment by Andrey Semyonov [ 2013 Aug 21 ] |
|
Is there any documented configuration scenario to raise a trigger when some SNMP item becomes 'unsupported' so one can make a inter-devices link visualize a problem on a map? I've 2.1.2-alpha3 installed and can only create a 'send message' action based on internal event. We need to monitor OSFP states through many devices. |
| Comment by Andrey Semyonov [ 2013 Aug 21 ] |
|
I've forgot to mention: both item and trigger are LLD-prototyped. |
| Comment by Alexander Vladishev [ 2013 Sep 19 ] |
|
(29) The trigger error shouldn't be updated when expression was changed. <richlv> this will be confusing now |
| Comment by Oleksii Zagorskyi [ 2013 Dec 28 ] |
|
It caused a regression in |
Need ability to alert on UNKNOWN state.
(ZBXNEXT-341)
|
|
| Status: | Closed |
| Project: | ZABBIX FEATURE REQUESTS |
| Component/s: | API (A), Frontend (F), Server (S) |
| Affects Version/s: | 2.1.0 |
| Fix Version/s: | 2.1.0 |
| Type: | Change Request (Sub-task) | Priority: | Major |
| Reporter: | Alexei Vladishev | Assignee: | Unassigned |
| Resolution: | Fixed | Votes: | 1 |
| Labels: | events, ids | ||
| Remaining Estimate: | Not Specified | ||
| Time Spent: | Not Specified | ||
| Original Estimate: | Not Specified | ||
| Issue Links: |
|
||||||||||||||||||||||||||||||||
| Description |
|
See https://www.zabbix.org/wiki/Docs/specs/ZBXNEXT-1574 for detailed specification. |
| Comments |
| Comment by Alexander Vladishev [ 2013 Jan 22 ] |
|
Available in the development branch svn://svn.zabbix.com/branches/dev/ZBXNEXT-1574. |
| Comment by dimir [ 2013 Jan 23 ] |
|
(3) [F] Triggers with value_flags=1 are not shown neither in "Monitoring" -> "Events" nor in "Monitoring" -> "Triggers". Here is how the trigger looks when status is OK and it's visible in "Monitoring":
 triggerid | expression | description | url | status | value | priority | lastchange | comments |                                               error                                               | templateid | type | value_flags | flags
-----------+------------+-------------+-----+--------+-------+----------+------------+----------+---------------------------------------------------------------------------------------------------+------------+------+-------------+-------
     13546 | {12980}>10 | random>10   |     |      0 |     0 |        2 | 1358929802 |          | Received value [test] is not suitable for value type [Numeric (unsigned)] and data type [Decimal] |            |    0 |           0 |     0
Now it becomes "unknown" and disappears from "Monitoring" (only change is "value_flags"): triggerid | expression | description | url | status | value | priority | lastchange | comments | error | templateid | type | value_flags | flags
-----------+------------+-------------+-----+--------+-------+----------+------------+----------+--------------------------------------------------------------------------------------------------+------------+------+-------------+-------
13546 | {12980}>10 | random>10 | | 0 | 0 | 2 | 1358929802 | | Received value [foo] is not suitable for value type [Numeric (unsigned)] and data type [Decimal] | | 0 | 1 | 0
|
| Comment by dimir [ 2013 Jan 23 ] |
|
Database changes successfully tested. |
| Comment by Alexei Vladishev [ 2013 Jan 23 ] |
|
Perhaps |
| Comment by Toms (Inactive) [ 2013 Jan 23 ] |
|
(4) in events.inc.php unnecessary 3rd param in get_next_event() jelisejev RESOLVED in r33101. tomtom CLOSED |
| Comment by Toms (Inactive) [ 2013 Jan 23 ] |
|
(5) in CScreenEvents.php should be removed jelisejev RESOLVED in r33101. tomtom CLOSED |
| Comment by Toms (Inactive) [ 2013 Jan 23 ] |
|
(6) in triggers.inc.php line:1456 statement: if ($state == -1) { never executes now jelisejev RESOLVED in r33109. tomtom CLOSED |
| Comment by Toms (Inactive) [ 2013 Jan 23 ] |
|
(7) in triggers.inc.php in calculate_availability() if ($total_time == 0) { $ret['true_time'] = 0; $ret['false_time'] = 0; $ret['true'] = 0; $ret['false'] = 0; } Maybe $ret['true'] should be 100!? jelisejev As far as I can see, this code should not be executed at all. But I suggest we leave it as is for now and deal with it in tomtom CLOSED |
| Comment by Toms (Inactive) [ 2013 Jan 24 ] |
|
(8) comments should be rewritten: "// if disable trigger, unknown event must be created" in triggers.php " * @param int $triggerValue TRIGGER_VALUE_FALSE, TRIGGER_VALUE_TRUE or TRIGGER_VALUE_UNKNOWN" in triggers.inc.php "// set element to problem state if it has problem events, ignore unknown events" in maps.inc.php. At 2 places! jelisejev RESOLVED in r33101. The last one should be removed under tomtom CLOSED |
| Comment by Toms (Inactive) [ 2013 Jan 24 ] |
|
(9) "return _('Unknown');" in trigger_value2str() should be rethought. Seems that it is unnecessary. jelisejev I've left it as is because that's how all similar functions behave. tomtom CLOSED |
| Comment by Toms (Inactive) [ 2013 Jan 24 ] |
|
(10) "$hintTable->addRow(array(new CCol(SPACE, 'trigger_unknown'), _('Unknown')));" should be removed in monitoring.overwiew.php probably associated class 'trigger_unknown' as well. jelisejev Will be fixed under tomtom CLOSED |
| Comment by Toms (Inactive) [ 2013 Jan 24 ] |
|
(11) "$this->ok('Number of triggers (enabled/disabled)[problem/unknown/ok]');" in testPageStatusOfZabbix.php should be updated. jelisejev RESOLVED in r33103. tomtom CLOSED |
| Comment by Toms (Inactive) [ 2013 Jan 24 ] |
|
(12) "$this->ok(array('Host', 'Name', 'Problems', 'Ok', 'Unknown', 'Graph'));" in testPageAvailabilityReport.php should be updated. At 2 places! jelisejev RESOLVED in r33103. tomtom CLOSED |
| Comment by dimir [ 2013 Jan 24 ] |
|
DB changes and serverside tested. sasha please see my small changes in r33114 and r33122. |
| Comment by Toms (Inactive) [ 2013 Jan 28 ] |
|
tomtom Frontend successfully TESTED. |
| Comment by Pavels Jelisejevs (Inactive) [ 2013 Jan 28 ] |
|
There have been conflicts when updating to the latest trunk. Please review r33166. |
| Comment by Pavels Jelisejevs (Inactive) [ 2013 Jan 28 ] |
|
Available in 2.1.0 r33169. |
| Comment by Pavels Jelisejevs (Inactive) [ 2013 Jan 28 ] |
|
Updated the API docs: the property list in https://www.zabbix.com/documentation/2.2/manual/api/reference/event/object |
| Comment by richlv [ 2013 Jan 28 ] |
|
(13) should be documented in whatsnew and upgrade notes, just have to figure out what are the important user-facing changes |
| Comment by Alexey Pustovalov [ 2013 Feb 01 ] |
|
(14) If events fro trigger has been deleted and trigger in the PROBLEM state (for example, when trigger is in PROBLEM state very long time), we can see the next errors: Undefined index: eventid [dashboard.php:97 → make_system_status() → makeTriggersPopup() → getEventAckState() in /var/www/zabbix/trunk-clean/include/events.inc.php:298] Undefined index: objectid [dashboard.php:97 → make_system_status() → makeTriggersPopup() → getEventAckState() in /var/www/zabbix/trunk-clean/include/events.inc.php:298] Undefined index: acknowledges [dashboard.php:97 → make_system_status() → makeTriggersPopup() → getEventAckState() in /var/www/zabbix/trunk-clean/include/events.inc.php:299] Undefined index: acknowledges [dashboard.php:97 → make_system_status() → makeTriggersPopup() → getEventAckState() in /var/www/zabbix/trunk-clean/include/events.inc.php:307] jelisejev RESOLVED in r33386. tomtom REOPENED blocks.inc.php line: $triggers[$tnum]['clock'] = isset($trigger['event']) ? $trigger['event']['clock'] : $trigger['lastchange']; jelisejev RESOLVED in r33486. tomtom CLOSED |
| Comment by Pavels Jelisejevs (Inactive) [ 2013 Feb 08 ] |
|
Fixed in 2.1.0 r33493. CLOSED. |
| Comment by Oleksii Zagorskyi [ 2013 Feb 09 ] |
|
Fix Version/s: is not set, REOPENED |
| Comment by Pavels Jelisejevs (Inactive) [ 2013 Feb 11 ] |
|
Set fix version. CLOSED. |
[ZBXNEXT-1518] do not update older event descriptions as macros they contain are updated Created: 2012 Nov 16 Updated: 2012 Dec 24 |
|
| Status: | Open |
| Project: | ZABBIX FEATURE REQUESTS |
| Component/s: | Server (S) |
| Affects Version/s: | 2.0.2 |
| Fix Version/s: | None |
| Type: | New Feature Request | Priority: | Minor |
| Reporter: | Taha Hasan | Assignee: | Unassigned |
| Resolution: | Unresolved | Votes: | 0 |
| Labels: | events, macros | ||
| Remaining Estimate: | Not Specified | ||
| Time Spent: | Not Specified | ||
| Original Estimate: | Not Specified | ||
| Environment: |
any |
||
| Description |
|
If you change a macro value in zabbix, any event descriptions holding that macro will show the new macro value (as opposed to the macro value at the time of the event). For things like traffic/ number of connections /etc - the event descriptions for older events holding the current macro value would be inaccurate/ wrong. |
| Comments |
| Comment by richlv [ 2012 Nov 16 ] |
|
not sure whether we have other existing issue about this... but this would be very, very hard to implement properly. |
| Comment by Taha Hasan [ 2012 Nov 16 ] |
|
Instead of keeping a history of what the macro value is/was, could we just keep a column in a table of what the old event description or old trigger was? |
| Comment by richlv [ 2012 Nov 17 ] |
|
that would increase db size quite a lot, as we'd have to store such a string for every event... |
[ZBXNEXT-1288] {EVENT.ACK.HISTORY} should work in recovery message too, not only in notification Created: 2012 Jun 22 Updated: 2014 Jun 16 Resolved: 2014 Jun 16 |
|
| Status: | Closed |
| Project: | ZABBIX FEATURE REQUESTS |
| Component/s: | Server (S) |
| Affects Version/s: | 1.8.13, 2.0.0 |
| Fix Version/s: | None |
| Type: | Change Request | Priority: | Minor |
| Reporter: | Ricardo Felipe Klein | Assignee: | Unassigned |
| Resolution: | Duplicate | Votes: | 2 |
| Labels: | acknowledges, actions, events, macros, recovery, trivial | ||
| Remaining Estimate: | Not Specified | ||
| Time Spent: | Not Specified | ||
| Original Estimate: | Not Specified | ||
| Environment: |
N/A |
||
| Issue Links: |
|
||||||||
| Description |
|
I think {EVENT.ACK.HISTORY} should be avaiable on Recovery message, so, when something gets back ok I can know if was someone who make something or the issue has just finished by itself.I tried to use this as recovery message, but, {EVENT.ACK.HISTORY} comes empty: Trigger: {TRIGGER.NAME}Trigger status: {TRIGGER.STATUS}Trigger severity: {TRIGGER.SEVERITY}Event Date: {EVENT.DATE}Item values: 1. {ITEM.NAME1}( {HOST.NAME1}: {ITEM.KEY1}): {ITEM.VALUE1}Issue History: |
| Comments |
| Comment by Ricardo Felipe Klein [ 2012 Jun 22 ] |
|
{EVENT.ACK.HISTORY}
<== forgot to close the "}" here, but it is correct on my zabbix configuration... |
| Comment by richlv [ 2013 Apr 15 ] |
|
this request probably is about showing ack history of the original problem event, not of the recovery event (which is less likely to have acknowledgements) somewhat similar change was made to EVENT.ID in |
| Comment by Ricardo Felipe Klein [ 2013 Apr 15 ] |
|
richlv, right, should be usefull see all ack history of the problem when you get the recovery message, so, fast way to know who did what to solve the problem. |
| Comment by Oleksii Zagorskyi [ 2014 Jun 16 ] |
|
According to my comment https://support.zabbix.com/browse/ZBXNEXT-384#comment-96655 it indeed has been implemented. |
[ZBXNEXT-1150] Event should store and show the maintenance status for an event Created: 2012 Mar 14 Updated: 2024 Feb 22 |
|
| Status: | Open |
| Project: | ZABBIX FEATURE REQUESTS |
| Component/s: | Frontend (F), Server (S) |
| Affects Version/s: | 1.8.10 |
| Fix Version/s: | None |
| Type: | New Feature Request | Priority: | Major |
| Reporter: | James Sperry | Assignee: | Alexei Vladishev |
| Resolution: | Unresolved | Votes: | 17 |
| Labels: | events, maintenance, troubleshooting, usability | ||
| Remaining Estimate: | Not Specified | ||
| Time Spent: | Not Specified | ||
| Original Estimate: | Not Specified | ||
| Environment: |
all |
||
| Issue Links: |
|
||||||||||||
| Description |
|
It would be very helpful if in the Event Details area of an event, there was a row on the left that included the Maintenance status during the event. When troubleshooting Actions and Triggers, it's very difficult to know if the maintenance was adhered to. Having this information would take a lot of guesswork out of it. |
| Comments |
| Comment by Volker Fröhlich [ 2012 Mar 14 ] |
|
From my point of view, actual maintenance periods should be stored along with the host, as long as maintenance is only host based. This way you could also visualize it in graphs. |
| Comment by Volker Fröhlich [ 2012 Dec 03 ] |
|
Connected to ZBXNEXT-1084 |
| Comment by Pavel Timofeev [ 2013 Jan 28 ] |
|
Not only in Event detail, but in Events list too. |
| Comment by Oleksii Zagorskyi [ 2016 Dec 20 ] |
|
In duplicated
What we need to remember that staring from 3.2 events may be found on Monitoring -> Problems (Show History switch) menu. |
| Comment by Oleksii Zagorskyi [ 2016 Dec 20 ] |
|
I've updated issue summary to not limit all possible use cases, linked here as duplicates. |
| Comment by richlv [ 2016 Dec 28 ] |
|
here's a hackish idea that might or might not work. my usecase is grabbing events with event.get to produce a report on which events and how many times have fired during a specific period of time. the hackish idea is to have an action that sends an alert with a "not in maintenance" condition (adjusting other conditions as needed to minimise the amount of these "extra" alerts). will have to play with this to see whether it works as hoped. |
| Comment by James Sperry [ 2016 Dec 28 ] |
|
just to be clear, my use case is not to exclude events which were created during maintenance. We automate the adding and removing of maintenance in our environment. So when we remove a host or group from maintenance, the maintenance item is deleted. So if someone comes to me and says "Hey, why didn't we see this alert last week", I would like to look into the event history and say "it was in maintenance at the time" thanks. |
| Comment by richlv [ 2016 Dec 29 ] |
|
ejames, yes, that's harder. the best i can think of - having two nearly identical actions. one with, one without "not in maintenance" condition. then an api-crawling script that compares alerts from both. any difference must be caused by an active maintenance at the time... |
| Comment by richlv [ 2016 Dec 31 ] |
|
as for the event.get problem, looks like alert.get can be used to work around the lack of the maintenance status like this :
of course, that will scale much worse - more alerts than events, might have to filter by a large number of events. other than that, seems to work for the intended purpose - finding out what alerted over some period, while ignoring things that happened during an active maintenance. |
| Comment by Oleksii Zagorskyi [ 2019 Sep 30 ] |
|
Maybe it could take "event_suppress" table data, as it has been added in v4.0 ? 20583:20190930:234928.509 taking host (10271) out of maintenance 20583:20190930:234928.509 query [txnlev:1] [update hosts set maintenanceid=null,maintenance_type=0,maintenance_status=0,maintenance_from=0 where hostid=10271;] 20583:20190930:234928.510 query [txnlev:1] [commit;] 20583:20190930:234928.510 query [txnlev:1] [begin;] 20583:20190930:234928.511 query [txnlev:1] [delete from event_suppress where suppress_until<1569876568] 20583:20190930:234928.511 query [txnlev:1] [commit;] 20583:20190930:234928.511 query [txnlev:0] [select eventid,objectid,r_eventid from problem where source=0 and object=0 and mod(eventid,1)=0 order by eventid] 20583:20190930:234928.512 query [txnlev:0] [select eventid,maintenanceid,suppress_until from event_suppress where mod(eventid,1)=0 order by eventid] 20583:20190930:234928.513 query [txnlev:0] [select functionid,triggerid from functions where (triggerid between 16019 and 16023 or triggerid in (13491,13496,13501,13502,15917,15924,15944,16012,16033,16055)) order by triggerid] 20583:20190930:234928.515 query [txnlev:0] [select eventid,tag,value from problem_tag where (eventid between 1069 and 1073 or eventid in (15,353,2238,2239,3395,3397,4061,4083,4084,4086,4089,4093,4095)) order by eventid] 20583:20190930:234928.516 query [txnlev:1] [begin;] 20583:20190930:234928.516 query [txnlev:1] [select maintenanceid from maintenances where maintenanceid=1 order by maintenanceid lock in share mode] 20583:20190930:234928.517 In zbx_dc_get_event_maintenances() 20583:20190930:234928.517 End of zbx_dc_get_event_maintenances() 20583:20190930:234928.517 query [txnlev:1] [delete from event_suppress where eventid=4095 and maintenanceid=1; But I think it could be possible to rework current approach and do not delete corresponding useful entries in the table and show details in event details, at least. |
| Comment by Dimitri Bellini [ 2023 Oct 25 ] |
|
Hi DevTeam, Thanks os much |
| Comment by Dimitri Bellini [ 2023 Dec 14 ] |
|
Hi Guys, |
| Comment by Alexei Vladishev [ 2023 Dec 18 ] |
|
We plan to discuss possible solutions later this week and will keep everyone updated. |
| Comment by Dimitri Bellini [ 2023 Dec 18 ] |
|
Hi Alexei, perfect! I will wait your further news. |
[ZBXNEXT-1104] [Patch] Show user alias on event details, not only phone numbers Created: 2012 Feb 03 Updated: 2012 Feb 08 Resolved: 2012 Feb 08 |
|
| Status: | Closed |
| Project: | ZABBIX FEATURE REQUESTS |
| Component/s: | Frontend (F) |
| Affects Version/s: | 1.8.10 |
| Fix Version/s: | None |
| Type: | Change Request | Priority: | Trivial |
| Reporter: | Volker Fröhlich | Assignee: | Alexei Vladishev |
| Resolution: | Duplicate | Votes: | 0 |
| Labels: | events, notifications, patch, sms | ||
| Remaining Estimate: | Not Specified | ||
| Time Spent: | Not Specified | ||
| Original Estimate: | Not Specified | ||
| Attachments: |
|
||||||||
| Issue Links: |
|
||||||||
| Description |
|
The right table on tr_events.php only shows sendto. In the case of sending a SMS: "03 Feb 2012 14:25:07 SMS sent 446648102623210 Subject: ..." This leaves the spectator with no clue and no easy way to find who's phone number that is. Using the submitted patch, the user alias appears underneath the phone number (or whatever) in brackets: "03 Feb 2012 14:25:07 SMS sent 446648102623210 (big_brother) Subject: ..." The code looks a bit different in some section in the trunk version. I don't have the time to adjust it at the moment. |
| Comments |
| Comment by richlv [ 2012 Feb 08 ] |
|
would be neat to provide this as a separate field, though (and filterable through the api etc...) |
[ZBXNEXT-1027] Differentiate between Service Level Views Created: 2011 Nov 14 Updated: 2013 Feb 07 |
|
| Status: | Open |
| Project: | ZABBIX FEATURE REQUESTS |
| Component/s: | Frontend (F) |
| Affects Version/s: | 1.9.7 (beta) |
| Fix Version/s: | None |
| Type: | New Feature Request | Priority: | Major |
| Reporter: | Johann Brajer | Assignee: | Unassigned |
| Resolution: | Unresolved | Votes: | 0 |
| Labels: | events, permissions, triggers | ||
| Remaining Estimate: | Not Specified | ||
| Time Spent: | Not Specified | ||
| Original Estimate: | Not Specified | ||
| Description |
|
Hi Zabbix Team, to use Zabbix in a big IT environment it seems neccessary to display all the Systemstatus and Alarms in a separted way, depending on the Service Level responsibility of a Zabbix user. For example a normal Service Level 1 user does not have to know each bits and bytes of the system to decide which kind of failure happend....to much information will just confuse him. He just have to handle fast and informe the right persons in critical situations....but of course a Level 3 Specialist must have access to all kind of deaper informations (eg. Warnings, Informationals,...) I think it should be quite easy for you to implement a filter function in Zabbix for different Information Levels, depending which kind of DisplayGroup the user belongs to. What do you think about this possible Feature? Does it makes sence to you? Regards johann |
| Comments |
| Comment by Johann Brajer [ 2011 Nov 14 ] |
|
same for Version 1.8.8 |
| Comment by richlv [ 2011 Nov 14 ] |
|
couldn't this be currently done by showing displays, filtered by trigger severity ? |
| Comment by Johann Brajer [ 2011 Nov 14 ] |
|
I think there was a little missunderstanding... It would be nice to setup different profils with special rights to see specific Items and alarms As i know this is not possible |
| Comment by richlv [ 2011 Nov 14 ] |
|
hmm, that's a bit too vague. would be nice to specify which entities in which pages are meant, and what the effect should be |
| Comment by Johann Brajer [ 2011 Nov 14 ] |
|
> different Service Level members have access to the same data of IT Systems (hostdata) but a different view on the Systems. eg. we have Sevice Level 1 members which should be alarmed only if a Critical Error with enormous consequencies happens, but not if some systems have redundancy. This failures should only be seen by the System Specialists (Level3) . > Reason just to hold the count of failures short. maps: > conclusion: Different typ of Trigger Setup for specific Group of Users.....for the Dashboard View, The Trigger View and The Map Views. ...also Screens... hope its now a little bit clearer |
| Comment by Johann Brajer [ 2012 Apr 06 ] |
|
Hi ZABBIX-Team, just wanted again to ask, if you consider to implement such a feature in one of the next Versions?? PLEASE let us know!! THX jb |
| Comment by richlv [ 2013 Feb 07 ] |
|
there are no short term plans for a feature like that |
[ZBXNEXT-415] need ability to alert on positive events Created: 2010 Jun 18 Updated: 2012 Oct 21 |
|
| Status: | Open |
| Project: | ZABBIX FEATURE REQUESTS |
| Component/s: | Server (S) |
| Affects Version/s: | None |
| Fix Version/s: | None |
| Type: | Change Request | Priority: | Major |
| Reporter: | Aleksandrs Saveljevs | Assignee: | Unassigned |
| Resolution: | Unresolved | Votes: | 3 |
| Labels: | alerts, events | ||
| Remaining Estimate: | Not Specified | ||
| Time Spent: | Not Specified | ||
| Original Estimate: | Not Specified | ||
| Issue Links: |
|
||||||||
| Description |
|
While it is true that in the large environments we usually wish to monitor for problems, in small environments we might wish to be inventive and also monitor for positive, interesting events. Consider the following two scenarios: (1) Suppose we have a self-made bank account. When financial resources come in, a log entry is written to a file. So whenever that happens, it is good news and we wish to be alerted. (2) Suppose we run a small advertisement business and we have a huge printer. It takes a lot of time to print a poster, maybe on the order of hours. Using SNMP, we wish to monitor the printer for activity and be alerted when it has finished printing, so that we can immediately start a new printing task and we do not have to check the printer ourselves every now and then. It is possible to receive alerts on such events using everything we have in Zabbix right now. Namely, we would create triggers and define alerts. The problem is that the only way to receive repeated alerts based on triggers is to have triggers in the PROBLEM state, but in neither of the two scenarios above the events we wish to monitor for are problems. We could use the existing mechanisms, but the "good" PROBLEM triggers would interfere wish "real problem" PROBLEM triggers. Scenario (1) can be solved, for instance, by either (a) introducing an ability to receive alerts whenever a new value comes in or (b) allow triggers to generate multiple OK events. Unsure about what to do about scenario (2), but it might or might not be related to |
| Comments |
| Comment by richlv [ 2010 Jun 18 ] |
|
well, both could actually be solved by creating a couple of triggers |
| Comment by richlv [ 2010 Sep 01 ] |
|
to clarify, these should be doable already : 1) have log monitored and enable multiple TRUE events (trigger could just check for .* or so). |
| Comment by James Wells [ 2010 Sep 01 ] |
|
Greetings, #1 above is actually pretty simple to do using a last(0)>prev(0) construct. This would generate an threshold violation when resources were increased, clear when resources were withdrawn or remained the same as the previous value. The only real issue with this is that it will show up as a problem. As Rich states it is simply overcoming a normal mental block about what a problem is. |
| Comment by Aleksandrs Saveljevs [ 2010 Sep 02 ] |
|
Unfortunately, a trigger like prev(0)>last(0) does not work. Consider that the amount of dollars in our bank account sequentially takes on the following values: $0 The trigger will fire when we get $200, spend $100, and get $200 again. However, since triggers cannot generate multiple OK events, we will not be alerted when the balance in our bank account increases to $500. So one of the solutions is to write a trigger like last(0)>-INFINITY and set it to generate multiple problem events. The trigger will then always be in the problem state. As conscientious administrators, we want our network to always be in a perfect state, without any problems, so we never want to have problem triggers appearing in our GUI. To clarify, the issue is not that alerts in such cases are technically impossible (they are possible), but rather that we do not usually call +$50 in our bank account a problem. Yes, we could live with the fact that both "good" problem triggers and "bad" problem triggers coexist in our GUI, but it would be nice if the design of Zabbix would not require us to do so. |
[ZBXNEXT-414] event timeline view Created: 2010 Jun 17 Updated: 2016 Aug 25 |
|
| Status: | Open |
| Project: | ZABBIX FEATURE REQUESTS |
| Component/s: | Frontend (F) |
| Affects Version/s: | None |
| Fix Version/s: | None |
| Type: | New Feature Request | Priority: | Major |
| Reporter: | richlv | Assignee: | Unassigned |
| Resolution: | Unresolved | Votes: | 16 |
| Labels: | dashboard, events, usability, widget | ||
| Remaining Estimate: | Not Specified | ||
| Time Spent: | Not Specified | ||
| Original Estimate: | Not Specified | ||
| Issue Links: |
|
||||||||||||
| Description |
|
event timeline would be a great feature. zabbix event timeline could show event duration as lines and their endpoints as events (and maybe midpoints for unknown flapping ?). clicking on endpoints would provide a popup with major event details and access to other screens (full event details, graphs/data for related items etc). acknowledged events would be visually different from non-acknowledged events (check mark ?). clicking on the line would provide a popup with a list of all involved events. it should be possible to select scale for the timeline. timeline does not invalidate event list view - it should be possible to use on the same screen timeline and time period slider, as well as see current event list. it should be possible to hide any of these three elements individually. might also be coupled with graphs, showing graph below the timeline. goes together with improved event filter |
| Comments |
| Comment by richlv [ 2010 Jun 17 ] |
|
seems to be using http://www.simile-widgets.org/timeline/ - bsd licensed ...and it has dark & white themes already to match zabbix ones... (to see events, drag that timeline back to 2013) |
| Comment by João Figueiredo [ 2010 Nov 17 ] |
|
This would be quite helpful to identify problem trends. |
| Comment by Cristian [ 2013 Jun 02 ] |
|
Some related feature request: https://support.zabbix.com/browse/ZBXNEXT-117 |
[ZBXNEXT-410] Add more filters to the Events page Created: 2010 Jun 14 Updated: 2017 Jul 19 Resolved: 2017 Jul 19 |
|
| Status: | Closed |
| Project: | ZABBIX FEATURE REQUESTS |
| Component/s: | Frontend (F) |
| Affects Version/s: | 1.8.2 |
| Fix Version/s: | None |
| Type: | Change Request | Priority: | Major |
| Reporter: | Vide | Assignee: | Unassigned |
| Resolution: | Duplicate | Votes: | 29 |
| Labels: | events, filters, patch | ||
| Remaining Estimate: | Not Specified | ||
| Time Spent: | Not Specified | ||
| Original Estimate: | Not Specified | ||
| Attachments: |
|
||||||||||||||||
| Issue Links: |
|
||||||||||||||||
| Description |
|
It would be great to have the possibility to filter the Events based on:
It would be very useful when creating reports or checking operators behavior Thanks!. |
| Comments |
| Comment by richlv [ 2010 Jun 14 ] |
|
1. - available in 1.8.3 |
| Comment by Volker Fröhlich [ 2012 Feb 15 ] |
|
Right now, you may only filter for a specific trigger on a specific host. It does not allow to filter on a trigger from a template. Filtering on trigger description might also be great, if not better. |
| Comment by Takanori Suzuki [ 2012 Oct 12 ] |
|
Hi, I'm Takanori Suzuki working at Miracle Linux.
|
| Comment by Takanori Suzuki [ 2012 Dec 26 ] |
|
Sorry, the previous post patch has problem in CSV output processing. |
| Comment by Volker Fröhlich [ 2013 Feb 11 ] |
|
Thank you Takanori, your patch works fine for me. |
| Comment by Volker Fröhlich [ 2013 Feb 11 ] |
|
zabbix-2.0.4-filter_events_by_trigger_description.patch allows to filter by trigger description, much like on the tr_status page. |
| Comment by Volker Fröhlich [ 2013 Feb 12 ] |
|
Filtering with the two patches combined |
| Comment by Andrey Shpak [ 2013 Feb 28 ] |
|
Tested on centos epel 205 distrib. Errors: --- events.php 2012-12-08 12:09:20.000000000 +0100 +++ events.php 2013-02-11 16:23:43.119990951 +0100 @@ -116,6 +117,7 @@ if (isset($_REQUEST['filter_rst'])) { $_REQUEST['triggerid'] = 0; $_REQUEST['showUnknown'] = 0; + $_REQUEST['txt_select'] = ''; } $source = get_request('triggerid') > 0 ? EVENT_SOURCE_TRIGGERS @@ -123,6 +125,7 @@ $_REQUEST['triggerid'] = get_request('triggerid', CProfile::get('web.events.filter.triggerid', 0)); $_REQUEST['showUnknown'] = get_request('showUnknown', CProfile::get('web.events.filter.showUnknown', 0)); +$_REQUEST['txt_select'] = get_request('txt_select', CProfile::get('web.events.filter.txt_select', '')); // Change triggerId filter if change hostId if (($_REQUEST['triggerid'] > 0) && isset($_REQUEST['hostid'])) { @@ -224,6 +227,7 @@ if (isset($_REQUEST['filter_set']) || isset($_REQUEST['filter_rst'])) { CProfile::update('web.events.filter.triggerid', $_REQUEST['triggerid'], PROFILE_TYPE_ID); CProfile::update('web.events.filter.showUnknown', $_REQUEST['showUnknown'], PROFILE_TYPE_INT); + CProfile::update('web.events.filter.txt_select', $_REQUEST['txt_select'], PROFILE_TYPE_STR); } // -------------- |
| Comment by Volker Fröhlich [ 2013 Apr 09 ] |
|
There seems to be a flaw with the Duration column. The calculated durations are wrong if filtered by trigger status. |
| Comment by Volker Fröhlich [ 2013 May 06 ] |
|
Cumulative patch including duration fix uploaded |
| Comment by Volker Fröhlich [ 2013 Nov 14 ] |
|
Cumulative patch for 2.2.0; please don't let me port it to 2.4 as well! |
| Comment by Michael Schwartzkopff [ 2014 May 07 ] |
|
Hi, I would like to see that feature: Filter events by severity. Michael. |
| Comment by Erwin Vrolijk [ 2014 Jun 27 ] |
|
Please add this to the next 2.2 or 2.4 Filtering events by severity is very usefull, in particular if triggers with a 'not classified' severity are used to change colors of links on a map the event list gets cluttered. |
| Comment by Volker Fröhlich [ 2014 Aug 28 ] |
|
Adapted patch to fit 2.2.5 |
| Comment by Volker Fröhlich [ 2014 Nov 05 ] |
|
Paging doesn't work with the patches |
| Comment by Volker Fröhlich [ 2014 Nov 06 ] |
|
zabbix-2.2.5- |
| Comment by Corey Shaw [ 2014 Nov 11 ] |
|
Ported to 2.4.2. This port includes the paging bug fix that Volker fixed. |
| Comment by Erik Skytthe [ 2015 Feb 07 ] |
|
Nice features! Today you cannot get an overview of only high events/triggers in an specific periode. It is difficult to report impact back to management, when bigger problems occurs. The ability to filter on status, gives a much better overview on events = only one line per event. |
| Comment by peter erbst [ 2015 Feb 11 ] |
|
after applying the 2.4.2 patch, it's sort of working, but throws this error at the end of the page: Undefined index: searchWildcardsEnabled [events.php:740 → CFrontendApiWrapper->get() → CApiWrapper->__call() → CFrontendApiWrapper->callMethod() → CApiWrapper->callMethod() → CFrontendApiWrapper->callClientMethod() → CLocalApiClient->callMethod() → call_user_func_array() → CEvent->get() → zbx_db_search() in /var/www/html/include/db.inc.php:777] |
| Comment by storex [ 2015 Dec 16 ] |
|
Ported to 2.4.7 |
| Comment by Volker Fröhlich [ 2016 Sep 09 ] |
|
I think this can be closed as "Fixed in 3.2"! |
| Comment by Alexander Vladishev [ 2017 Jul 19 ] |
|
Already implemented under |
| Comment by Vide [ 2017 Jul 19 ] |
|
I'm glad it was finally implemented in |
[ZBXNEXT-384] Add new macro to uniquely identify an alert Created: 2010 May 27 Updated: 2020 May 17 Resolved: 2014 Jul 22 |
|
| Status: | Closed |
| Project: | ZABBIX FEATURE REQUESTS |
| Component/s: | None |
| Affects Version/s: | 1.8.2 |
| Fix Version/s: | 2.1.0 |
| Type: | Change Request | Priority: | Major |
| Reporter: | Alixen | Assignee: | Unassigned |
| Resolution: | Fixed | Votes: | 23 |
| Labels: | eventid, events, trivial | ||
| Remaining Estimate: | Not Specified | ||
| Time Spent: | Not Specified | ||
| Original Estimate: | Not Specified | ||
| Attachments: |
|
||||||||||||||||
| Issue Links: |
|
||||||||||||||||
| Description |
|
We need to have a way to uniquely identify an alert during its whole life cycle. This feature is important because we need to automatically open and close tickets on an ITSM system and automatic closing is impossible without it. A possible solution would be to have a {EVENTID.SRC}/ORIG or whatever macro in recovery message that would return EVENT.ID of the event that triggered the alert. |
| Comments |
| Comment by Danny Lancashire [ 2010 May 27 ] | ||||||||||||
|
It's also important to our support team if, when a recovery notification is received, the event details responsible for resolving the alert are reported e.g. {EVENT.RECOVER}. | ||||||||||||
| Comment by Garth Dahlstrom [ 2011 Oct 13 ] | ||||||||||||
|
This patch adds {ESC.ORIGIN.EVENT.ID} to the list of macros that can be substituted for during Action messages. ESC.ORIGIN.EVENT.ID is the event id of the first escalation event, it will always be the same id for both problem and recovery messages and is therefore suitable for tracking incidents with their resolutions. This patch was created against the Zabbix 1.8.8 source tarball, tested against Zabbix 1.8.5 on Ubuntu and will patch against Zabbix 1.9.6 (with 400+ fuzz). www.2keys.ca assigns copyright for this code to zabbix.com for distribution under GPLv2 and any other licenses zabbix.com sees fit. | ||||||||||||
| Comment by Garth Dahlstrom [ 2011 Oct 18 ] | ||||||||||||
|
Please consider linking this to ZBXNEXT-1001, which also has patches attached to it... as together these will allow for Trigger Email -> JIRA Ticket workflow | ||||||||||||
| Comment by Garth Dahlstrom [ 2012 Mar 23 ] | ||||||||||||
|
The patch provided here is very trivial, yet the functionality for tracking in external systems is so useful... Can we get this targeted to 2.x.something?? I'll happily provided an updated patch if the current attached one needs updating. | ||||||||||||
| Comment by richlv [ 2012 Mar 24 ] | ||||||||||||
|
with all the hard work on 2.0, this isn't on the short term roadmap yet - we'll see what time permits once 2.0 is out & stable... | ||||||||||||
| Comment by Garth Dahlstrom [ 2012 Jun 18 ] | ||||||||||||
|
Now that 2.0 is out and approaching stability, any chance we can get this added into the mix for 2.1.x? | ||||||||||||
| Comment by Garth Dahlstrom [ 2012 Sep 25 ] | ||||||||||||
|
Seems harder then pulling teeth to get a response about including a patch into Zabbix... I mean, the work is already done, right? Just needs to be merged. Am I going about this the wrong way? Is there a devel mailing list I should send it to or an IRC channel where devs hang out? | ||||||||||||
| Comment by lubyou [ 2012 Oct 11 ] | ||||||||||||
|
I would also like to see this getting merged. I have been using the patch in production for a while and it works well for me. | ||||||||||||
| Comment by Raymond Kuiper [ 2012 Oct 15 ] | ||||||||||||
|
Very much needed for integration with ITIL tooling. | ||||||||||||
| Comment by Robby Dermody [ 2012 Dec 15 ] | ||||||||||||
|
Add me to the list of folks that need this feature. As other have stated, it's absolutely critical for tying alert resolution to alert creation. | ||||||||||||
| Comment by richlv [ 2012 Dec 15 ] | ||||||||||||
|
please see the last item in https://zabbix.org/wiki/Docs/bug_reporting_guidelines#Reporting_an_issue | ||||||||||||
| Comment by Alexei Vladishev [ 2013 Jan 28 ] | ||||||||||||
|
See also | ||||||||||||
| Comment by Alexei Vladishev [ 2013 Jan 29 ] | ||||||||||||
|
ZBXNEXT-1001 should be closed after implementing this one. <richlv> hmm, ZBXNEXT-1001 doesn't seem to be related | ||||||||||||
| Comment by richlv [ 2013 Jan 29 ] | ||||||||||||
|
| ||||||||||||
| Comment by Garth Dahlstrom [ 2013 Jan 29 ] | ||||||||||||
|
Alexei, there is nothing to implement. All we need is someone with commit access to apply the attached 3 line patch that has been sitting here for a year and a half. If you have repo access, please stop messing about with the bug's metadata and take 2 minutes & apply the patch! If you are having trouble downloading it, here it is again inline: --- ./src/libs/zbxserver/expression.c 2011-10-13 11:38:42.000000000 -0400 +++ ./src/libs/zbxserver/expression.c 2011-10-13 12:01:08.000000000 -0400 @@ -1476,6 +1476,7 @@ #define MVAR_EVENT_AGE "{EVENT.AGE}" #define MVAR_EVENT_ACK_STATUS "{EVENT.ACK.STATUS}" #define MVAR_EVENT_ACK_HISTORY "{EVENT.ACK.HISTORY}" +#define MVAR_ESC_ORIGIN_EVENT_ID "{ESC.ORIGIN.EVENT.ID}" #define MVAR_ESC_HISTORY "{ESC.HISTORY}" #define MVAR_HOSTNAME "{HOSTNAME}" #define MVAR_PROXY_NAME "{PROXY.NAME}" @@ -1835,6 +1836,8 @@ replace_to = zbx_strdup(replace_to, event->acknowledged ? "Yes" : "No"); else if (0 == strcmp(m, MVAR_EVENT_ACK_HISTORY)) ret = get_event_ack_history(event, &replace_to); + else if (0 == strcmp(m, MVAR_ESC_ORIGIN_EVENT_ID)) + replace_to = zbx_dsprintf(replace_to, "%d", (int)(escalation != NULL ? escalation->eventid : event->eventid)); else if (0 == strcmp(m, MVAR_ESC_HISTORY)) ret = get_escalation_history(event, escalation, &replace_to); else if (0 == strcmp(m, MVAR_TRIGGER_SEVERITY)) | ||||||||||||
| Comment by Garth Dahlstrom [ 2013 Feb 26 ] | ||||||||||||
|
What is the status of this? Has the provided patch been committed yet? Please update the ticket. | ||||||||||||
| Comment by Oleksii Zagorskyi [ 2013 Feb 26 ] | ||||||||||||
|
As you can see above - Status: is Open | ||||||||||||
| Comment by Garth Dahlstrom [ 2013 Feb 26 ] | ||||||||||||
|
@Oleksiy as you can see above the ticket has been open for almost 3 years, 1.5 which there has been a patch sitting there waiting to be applied that fixes the issue. Surely the correct status should be WON'T FIX, should it not? | ||||||||||||
| Comment by Oleksii Zagorskyi [ 2013 Feb 26 ] | ||||||||||||
|
Garth, I just wanted to say that you can see actual status of this feature request on top of this page, as answer to your question. If this feature would not be interesting then it would be probably closed already. | ||||||||||||
| Comment by Garth Dahlstrom [ 2013 Feb 27 ] | ||||||||||||
|
Oleksiy, I appreciate that the literal status of the ticket is Open, but that is also the default status of a ticket when it was first created some 3 years back. If after 3 years a dev can't stop in for a minute to even target the ticket to a future release, I really have to wonder if it will ever be fixed. If someone handed me the fix to a problem, I'd spend a minute to look at, decide if it was worth doing/made sense and if were too complex to apply on the spot, I'd plan to apply it in a future release. The most obvious thing to do would be to just mark this as WON'T FIX, since its unlikely to be relevant to anyone who voted for the ticket by the time it is addressed, if it is even ever addressed at all. | ||||||||||||
| Comment by dimir [ 2013 Mar 07 ] | ||||||||||||
|
Just confirmed that this is in roadmap for 2.2 . | ||||||||||||
| Comment by Alexander Vladishev [ 2013 Apr 09 ] | ||||||||||||
|
Specification: https://www.zabbix.org/wiki/Docs/specs/ZBXNEXT-384 | ||||||||||||
| Comment by Alexander Vladishev [ 2013 Apr 09 ] | ||||||||||||
|
Available in the development branch svn://svn.zabbix.com/branches/dev/ZBXNEXT-384 | ||||||||||||
| Comment by Alexander Vladishev [ 2013 Apr 09 ] | ||||||||||||
|
(1) Documentation needs to be updated.
sasha Partially updated: martins-v Updated:
zalex_ua I think all the changes are good and may be closed. It has to be improved ! Also, on https://www.zabbix.com/documentation/2.2/manual/config/notifications/action we could add details to "Recovery message" checkbox. As I recall there are also some details related to maintenance. Maybe we need to open separate ZBX to address rest of doc changes? martins-v RESOLVED:
zalex_ua Reviewed, seems ok. Then it will be more clear, imo. martins-v I agree with the first sentence change. Not so sure about "condition record is, say, being suppressed". Reading it, I cannot immediately get/understand what a "condition record" is. martins-v The first sentence changed, for more clarity. RESOLVED. zalex_ua looks ok, now is CLOSED. | ||||||||||||
| Comment by dimir [ 2013 Apr 11 ] | ||||||||||||
|
Successfully tested. Please review my small changes in r34941. sasha Great! Thanks. CLOSED | ||||||||||||
| Comment by Alexander Vladishev [ 2013 Apr 11 ] | ||||||||||||
|
Available in version pre-2.1.0 (trunk) r34950. | ||||||||||||
| Comment by richlv [ 2013 Apr 15 ] | ||||||||||||
|
| ||||||||||||
| Comment by richlv [ 2013 May 29 ] | ||||||||||||
|
doc subissue (1) has not been reviewed, and it says "partially updated" - supposedly something is still missing ? | ||||||||||||
| Comment by Oleksii Zagorskyi [ 2013 Dec 26 ] | ||||||||||||
|
To check documentation changes I've performed a test: 1st action ID:8 is with "Trigger value = PROBLEM" condition and recovery message checkbox enabled - to test, say, "pure recovery" event. Here are results (1st, 2nd steps of Problem and then OK):
As we can see the pure recovery case is different from OK. Based on the results I've added a comment to [1] sub issue. | ||||||||||||
| Comment by Frank [ 2014 Jun 18 ] | ||||||||||||
|
This doesn't appear to be working in the "Remote Command" Custom Script functionality either. The value is never replaced when an "OK" event occurs, but that is probably due to the same as Oleksiy indicated in December. | ||||||||||||
| Comment by Mohammed Razem [ 2015 May 17 ] | ||||||||||||
|
I'm using Zabbix 2.2.2 and still cannot use a macro that uses the "original" event ID that triggered the PROBLEM in the recovery message. I do not understand why this has been marked as fixed. | ||||||||||||
| Comment by Alex Stumpf [ 2018 Nov 23 ] | ||||||||||||
|
Is this really implemented? Given this is supposedly "fixed" with 2.1.0 it should be working on our v3.0.16 install. Yet neither {EVENT.RECOVERY.ID} nor {ESC.ORIGIN.EVENT.ID} makros are expanded and {EVENT.ID} differs between PROBLEM and OK trigger in the remote command. When following the manual, i.e. checking "Recovery message" and setting trigger.value=problem as condition, then no remote command is executed on recovery (which makes sense looking at the condition, but is in contradiction to the manual). | ||||||||||||
| Comment by Eduard [ 2020 May 17 ] | ||||||||||||
|
Any news on this ? or anyway to get our ticket systems to uniquely identify a monitoring alert and prevent flapping to create multiple new tickets? |
[ZBXNEXT-341] Need ability to alert on UNKNOWN state. Created: 2010 May 04 Updated: 2021 Apr 09 Resolved: 2013 May 12 |
|
| Status: | Closed |
| Project: | ZABBIX FEATURE REQUESTS |
| Component/s: | None |
| Affects Version/s: | 1.8.2 |
| Fix Version/s: | 2.1.0 |
| Type: | New Feature Request | Priority: | Critical |
| Reporter: | Brett Lentz | Assignee: | Unassigned |
| Resolution: | Fixed | Votes: | 70 |
| Labels: | events, triggers | ||
| Σ Remaining Estimate: | Not Specified | Remaining Estimate: | Not Specified |
| Σ Time Spent: | Not Specified | Time Spent: | Not Specified |
| Σ Original Estimate: | Not Specified | Original Estimate: | Not Specified |
| Issue Links: |
|
|||||||||||||||
| Sub-Tasks: |
|
|||||||||||||||
| Description |
|
Currently, when a trigger is in an unknown state, there is no alerting that happens. This is a very bad thing. There are several things that can cause a trigger to return unknown instead of problem. This fails to trigger any alerts, as no events are created, which ultimately means that monitoring has failed to do it's job (i.e. to alert us when something changes). This makes monitoring and alerting with Zabbix untrustworthy. We need the ability for Zabbix to send alerts when Items and Triggers become unknown.
Right now, we need to have everyone proactively looking for a lack of data because Zabbix is unable to alert us to this. This is a waste of man hours, and defeats the purpose of having a monitoring system. See https://www.zabbix.org/wiki/Docs/specs/ZBXNEXT-341 for detailed specification. |
| Comments |
| Comment by richlv [ 2010 Aug 26 ] |
|
related issues : |
| Comment by Bashman [ 2010 Sep 29 ] |
|
This will surely increase the number of alerts. |
| Comment by João Figueiredo [ 2010 Nov 03 ] |
|
Hi. Why not allowing in the Web Front-end Administration | General |
| Comment by Marcel Hecko [ 2010 Nov 25 ] |
|
what would suffice to add Trigger value = UNKNOWN to the Actions conditions section |
| Comment by Andrew Dike [ 2011 Feb 10 ] |
|
If I could make a "stronger" vote for this I would. I can see the idea of trying to reduce alerts, but without a solution to alert on which triggers have failed, it's a major drawback. I tried to quick hack (details in http://www.zabbix.com/forum/showthread.php?t=17458) but it didn't work. I'm attempting to replace a large nagios installation and despite the many strengths of zabbix, I find this strange weakness a serious flaw. |
| Comment by Raymond Kuiper [ 2011 May 04 ] |
|
Possible solutions (IMHO) would be the following: *adding a {TRIGGER.UNKNOWN}macro that counts the number of unknown triggers for a host (a bit like {TRIGGER.ACK}counts the number of acknowledges) only this macro should be usable in trigger expressions. We could then alert that 'there are 4 triggers in an unknown state on hostname'. *adding a trigger function like 'item.key.unsupported(0)' that can be used on critical items to alert that they have become unsupported. |
| Comment by Andrew Dike [ 2011 May 25 ] |
|
I've posted my fix for this issue on the forum. It two templates which can detect unknown triggers and unsupported items for any host. Please let me know if it helps. |
| Comment by Paul D. Walker [ 2011 Sep 26 ] |
|
I would have thought that using {item}.nodata() would detect when an item was not receiving (because of it being in an unknown state), but apparently that is not the way zabbix works? (i.e. triggers are only run when new data is received).As the original commenter says, this creates a potentially serious hole in the monitoring system which may actually fail to catch a problem while the problem is happening. - a service goes wonky - the zabbix monitoring item changes to an "unknown" state - the triggers on that item to detect a failure are not run - end result: service down, no way to know unless someone physically checks. Andrew Dike's collector helps in that it helps you focus down on finding those items that are in an unknown state, but it's not a perfect solution. A better solution would be beneficial to zabbix. Maybe a function that would cause the trigger to be run as if the item was working properly? {item} .isUnknown()=1? |
| Comment by Andrew Dike [ 2011 Sep 27 ] |
|
I too would be keen to see an integrated solution. My solution is the best work around I could think of without touching the zabbix code (also I don't really know php). Looking forward to an official update on this. |
| Comment by Stefan [ 2011 Nov 02 ] |
|
would it be integrate in zabbix in the near feature? |
| Comment by Robert Jerzak [ 2011 Nov 03 ] |
|
For hosts with working zabbix agent there is no problem - function nodata() triggers when there is no data from host. The problem is with hosts without zabbix agent, for example pure SNMP hosts. The data stops flowing (eg. somebody changed SNMP community string on host), zabbix changed item status to NOT SUPPORTED and nobody knows that host is not monitored. |
| Comment by richlv [ 2011 Nov 03 ] |
|
the problem with snmp might be solved by the new logic at https://support.zabbix.com/browse/ZBX-3469?focusedCommentId=49343#comment-49343 |
| Comment by Jochen Radmacher [ 2011 Nov 29 ] |
|
We have some APC UPSes here, which remove a whole sub tree of the snmp tree when losing the internal connection from the management board. As this includes the connection status item, we never get a connection failed status, only the connection OK status und "unsupported". Since the rest of the tree stays readable, |
| Comment by Cheezus [ 2012 Feb 01 ] |
|
I can't upvote this high enough either, wtf. Zabbix: agentd is not running on xxxxx Status UNKNOWN. Seriously? The zabbix agent isn't running which puts the trigger into a failed state that doesn't alert us. Wow... whoever thought this made sense should be kicked in the crotch. Why is this not a an option when creating an action "Trigger value = "PROBLEM"" you add "UNKNOWN" in addtion to just "OK" and "PROBLEM". WTF this aggravating after seeing such a flaw open for 2 years I'm seriously reconsidering our decision here. |
| Comment by Rob S [ 2012 Feb 17 ] |
|
Can we pay to have this implemented? |
| Comment by Oleksii Zagorskyi [ 2012 Feb 17 ] |
|
Rob, you could drop a message here http://www.zabbix.com/contact.php |
| Comment by Miguel [ 2012 Mar 09 ] |
|
Apart from the +1 to this request, it would be nice to have an internal zabbix item for zabbix[triggers_unknown] (like the one already there zabbix[items_unsupported]) so we can raise an alert if this value goes >0 |
| Comment by Simon Dircks [ 2012 Mar 11 ] |
|
Being able to trigger in any fashion on a unsupported item would be enough for production uses. |
| Comment by Simon Kowallik [ 2012 Apr 02 ] |
|
I agree with Simon. That would be enough. |
| Comment by Farzad FARID [ 2012 Apr 16 ] |
|
Miguel: the problem of having only a global zabbix[triggers_unknown] or zabbix[items_unsupported] is that on any sufficiently large IT installation you will always have unsupported items that are "normal" and that will not be fixed or hidden quickly That's because nobody will care enough to make the monitoring perfect by deleting unused items, deleting non-existings hosts from Zabbix, deactivating templated items that do not work on every host, etc. So I'm afraid that the zabbix[triggers_unknown] will often be > 0 and you won't be able to detect real issues. Last week, not knowing that this Feature Request existed, I posted a long message on the "Zabbix Troubleshooting and Problems" forum describing the same issues exposed here but nobody answered or commented on it yet: http://www.zabbix.com/forum/showthread.php?t=25798 |
| Comment by Michael [ 2012 Jul 17 ] |
|
Is this feature request applicable to zabbix 2.0? |
| Comment by Brett Lentz [ 2012 Jul 17 ] |
|
Michael: In my opinion, yes. This request is still applicable to Zabbix 2.0. I want the ability to send alerts if an item is in any state other than OK, including UNKNOWN or NOT SUPPORTED. |
| Comment by Andrew Dike [ 2012 Jul 17 ] |
|
I also believe it is still applicable because the behaviour on unsupported items is still the same. After using Zabbix in production for a year or so, I've found that two items that record the number of supported items (per host) and another item for the respective names (per host) to be sufficient. It is also keeps noise down to a minimum when multiple checks fail. |
| Comment by Michael [ 2012 Jul 17 ] |
|
It would be nice to hear from zabbix team about plans on this feature request. |
| Comment by Ethan Sommer [ 2012 Aug 27 ] |
|
I developed a fix for this, which will work to see if a specific item goes unsupported. The same concept could easily be used to see if the number of unsupported items changed for a host. 1. Create an external script with the following code (with your own password and the key of your choice of course – you will need to change the value for key_ and the password) Then create a new item in your host and/or template with the type external script and the key "filenameofscript[ {HOSTNAME}]" You can then create triggers based on that item. Problem solved. |
| Comment by Brett Lentz [ 2012 Aug 27 ] |
|
In Zabbix 2.0.x, I will note that zabbix[queue,10m] comes close to resolving this issue. I can at least throw an alert when there are items in the queue that haven't been processed in a while. The only thing I haven't yet figured out how to do with 2.0.x is to alert when an item goes from being ACTIVE to being NOT_SUPPORTED. Once I can do this, I'll consider this issue to be fully resolved. |
| Comment by Raymond Kuiper [ 2012 Aug 30 ] |
|
When an item switches from Active to Not Supported, we need to be able to trigger on it. We could use a Zabbix internal item that displays the number of unsupported items for a specified host. ( zabbix[unsupported, {HOSTNAME}] or something? ) We could then use that item on a host and define a trigger for changes or if a threshold is exceeded. |
| Comment by Sergey Z [ 2012 Nov 16 ] |
|
Is it fixed in 2.0.3 or not ? |
| Comment by Strahinja Kustudic [ 2013 Jan 13 ] |
|
I didn't notice this being fixed and if it was we would see it here. I would also like to see this get implemented, since it's a big monitoring flaw and it also makes it almost impossible to detect problems in you scripts. I was thinking to resolve this issue by monitoring the Zabbix server log for unsupported items, since that is very easy to do, but this should be possible to do out of the box. |
| Comment by Strahinja Kustudic [ 2013 Jan 16 ] |
|
I like it where you are going with this https://www.zabbix.org/wiki/Docs/specs/ZBXNEXT-341 It is a very nice idea to only send internal events to administrators only, since they are the only ones who need to know about them and who can fix them. Now the question is for what version is this planned for? |
| Comment by Marcel Hecko [ 2013 Jan 17 ] |
|
I think implementing a nodata() trigger by default for every single item would be a way to go. With a default action defined. Sending email just to admins is really not very vise - if unknow item happens in the night or when admin is out of office, this is really nowhere going. |
| Comment by Strahinja Kustudic [ 2013 Jan 17 ] |
|
That is why you should have more admins available anyway, but if you don't have enough people, nothing is stopping you to set the email account of an admin to be a group of users who usually get these notifications. That is a very easy fix for you if you don't want to have only admins getting these emails. |
| Comment by Jens Berthold [ 2013 Jan 17 ] |
|
But where is the sense in implementing such an unneccessary restriction concerning notifications? Plus: the target system admin (who e.g. knows why no data can be retrieved) doesn't neccessarily have to be a Zabbix admin. |
| Comment by Andrew Dike [ 2013 Jan 17 ] |
|
I agree with Jens. I don't see a point in treating failed items alerts as any different from a notification point of view. I've been using a single item per host to log the number of failed items and another item to list the names of the all failed items. I've found this to work very well and doesn't cause many alerts if a host goes down. |
| Comment by Raymond Kuiper [ 2013 Jan 17 ] |
|
Agreed, I think the best way to go forward with this is to know that a host is missing data and/or events. The possibility to notify on a certain item going to unknown could be useful in some cases as well but I think the focus should be on the host level. For instance, a Zabbix internal counter item for the host could be used for this. (like I stated before) |
| Comment by Paul D. Walker [ 2013 Jan 17 ] |
|
I like Andrew's suggestion. |
| Comment by Alexei Vladishev [ 2013 Jan 29 ] |
|
Let me briefly explain why we decided to make internal events visible to administrators and super-administrators only. Unknown triggers and not supported items are very often result of misconfiguration, long running user parameters or badly written trigger expressions. It's something to do with configuration, which could be fixed by administrators only. Shall we expose internal events to normal (read-only) users? My answer is 'no' since the internal events do not bring information about real problems, i.e. problems defined by triggers. Again, internal events are supposed to inform administrators about Zabbix software- and configuration-related events. I hope it makes sense. |
| Comment by Paul D. Walker [ 2013 Jan 29 ] |
|
I understand where you are coming from, but here was my use case: I had a team of people (read only) whose only job was to monitor the system and deal with the simple errors. In the case of something more complex, they'd call the higher level support people. If someone added in a new production server, misconfigured it such as no adding in the appropriate used defined parameters to the configuration file, then a failure could happen because an item was not being monitored that should have been monitored. Since we used templates, the triggers based on those user defined items would not run (unsupported). The monitoring team, even though they are read only users of the system, could report that and get someone to fix it. Exposing this information allows someone to address the problem rather than not knowing it has happened.
True, but we still want to know about it. One of my admins could change and break something. One of my user defined functions could fail. A firewall rule could be changed causing some built in tests to fail. Any number of things might happen in a running system that could cause breakage. Andrew Dike's "fix" has saved me from missing a number of problems that would have escaped our attention until the users of the system complained of a problem. |
| Comment by Andrew Dike [ 2013 Jan 29 ] |
I agree. However there are also a significant number of issues which are caused by unexpected changes in the systems monitored. For example, if I'm running a script that returns the temperature of the server room, and the script fails to execute (perhaps a permission change gone wrong, or the hardware is faulty), it may return an error string instead of the integer I was expecting. If the temperature then rises above a threshold, no one could be notified until systems started rebooting themselves. I also work in an environment the administrators do not check the monitoring systems themselves, there's another 24x7 team for that. And if the temperature monitoring stops working during the night, they would need to alert us about that. The trouble with making the alerts on visible to administrators is that it assume something about the workflow of the company which can be different to what you expect. Perhaps unsupported items would have a severity level 'UNKNOWN' which could be filtered out for certain user groups. |
| Comment by richlv [ 2013 May 11 ] |
|
this was solved by |
| Comment by richlv [ 2014 Feb 19 ] |
|
this functionality might not solve all usecases - see |
| Comment by Richard Ostrochovský [ 2021 Apr 09 ] |
|
story continuation: ZBXNEXT-6607 |
[ZBXNEXT-117] Add comments to graphs Created: 2009 Nov 04 Updated: 2024 Mar 16 |
|
| Status: | Open |
| Project: | ZABBIX FEATURE REQUESTS |
| Component/s: | Frontend (F) |
| Affects Version/s: | None |
| Fix Version/s: | None |
| Type: | New Feature Request | Priority: | Minor |
| Reporter: | Robin Holtet | Assignee: | Unassigned |
| Resolution: | Unresolved | Votes: | 120 |
| Labels: | events, graphs | ||
| Remaining Estimate: | Not Specified | ||
| Time Spent: | Not Specified | ||
| Original Estimate: | Not Specified | ||
| Attachments: |
|
||||||||||||||||||||||||||||||||||||||||||||||||
| Issue Links: |
|
||||||||||||||||||||||||||||||||||||||||||||||||
| Description |
|
How about the possibility to add comments to graphs? For example, when we have some issue and the graphs look different than normal, it would be nice if we could somehow attach a comment to that specific graph and time. For example "interface failed, internet connection down, DOS attack, etc". Then, when we later look at trends and wonder what happened, we see the comment. The comment could be displayed above the graph in the picture, listed below as text or as a popup together with small symbols in the graph, like !1, !2 etc. Or maybe somebody else have an even better idea... |
| Comments |
| Comment by João Figueiredo [ 2009 Nov 04 ] |
|
Though this kind of clashes with Godzilla's Graph color change suggestion I do see some usefulness in this, better than a blank Graph, specially in Item's Graphs that have dependencies on other Item's Ex: Graph for an Oracle DB current sessions -> "IP Connection not possible" or "Server is down" depending on existing Triggers |
| Comment by Robin Holtet [ 2009 Nov 09 ] |
|
I don't really think it clashes with Godzilla's suggestion. I was not thinking about using triggers, although that might also be a good idea. My suggestion is more like a system for manually adding comments that might be useful when looking at trends for capacity planning etc. I made a simple example, which I'll try to attach. |
| Comment by Simon [ 2010 Nov 02 ] |
|
I really think this kind of functionality could be very beneficial to Zabbix and could really make it superior to other monitoring tools. My 2 cents. |
| Comment by João Figueiredo [ 2011 Feb 15 ] |
|
Is this been considered for a next 1.9.x release? Thanks |
| Comment by Tristan Rivoallan [ 2011 Mar 09 ] |
|
Yes this would be very useful and give Zabbix something most competitors do not have. Enabling it to build more business intelligence into the technical monitoring. |
| Comment by Joseph Bell [ 2012 Sep 28 ] |
|
Are features considered for the next release by votes? The comments-on-graph feature is incredibly desirable, just completed a maintenance operation for performance and our Zabbix monitors immediately started showing results - it would be very useful to add this annotation for future reference! |
| Comment by Volker Fröhlich [ 2012 Sep 28 ] |
|
Votes are considered. You could also suggest how you think it should behave in detail. That'd be helpful. |
| Comment by Alexei Vladishev [ 2012 Oct 11 ] |
|
I like it very much. Also we may consider implementing a new operation, "add a label". In this case, for example, application version changes could be created automatically by Zabbix itself. |
| Comment by Cristian [ 2013 Jan 19 ] |
|
The annotations should be assigned at:
or other abstraction levels. But to have options to convert the annotations between levels or display all the annotations no matter of level. A sample: we could do some tuning on a db server and we mark the change on one of the graphs for that db server. If we are reviewing the http servers graphs and we see a load change to be able to make visible all annotations so we see that the load change on http was because of the change on the db server. That's just a sample but we are currently using Nagios/Cacti and I am looking for a replacement tool to have this features. When working either on equipments or at application level there are a lot of changes made and is hard to track what change has made the impact on graphs. Using this will help a lot. I am currently using this kind of feature on Google Analytics and is very useful. Is shame none of monitoring tools I checked doesn't have this kind of things. |
| Comment by Cristian [ 2013 Jan 19 ] |
|
As well some ways to share the annotations between groups (I am not sure if groups on Zabbix are hierarchically based to share base on hierarchy; I am not yet a Zabbix user I would like to be able to specify what type of user is able to view/edit/delete the graphs (sample: customer accounts to not be able to do certain things on annotations). |
| Comment by Jurgen Weber [ 2013 Feb 08 ] |
|
this feature would be amasing, so you can annotate events, changes so you do not have to remember them in our head. |
| Comment by Andy Goldschmidt [ 2013 Mar 13 ] |
|
very useful, please implement. |
| Comment by Juho Mäkinen [ 2013 Apr 24 ] |
|
Also upvote from here. It would be really good to be able to have an API which could be used to annotate timeline for example when a new build has been updated into production. |
| Comment by Maxim Krušina [ 2013 May 06 ] |
|
For sure, annotation should be mapped not only to graph, but to higher levels, as discussed above. Graphs are changing, but these note should stay in DB and should be visible on other places... |
| Comment by Cristian [ 2013 Jun 02 ] |
|
An interesting idea would be to have kind of "user input" item, which means the user can enter for a precise date&time some text (somehow similar with a Character item). This text could be the label/comment to be displayed on graphs. Additional to this idea is to have some items (otherwise not having input from user but rather from host monitored) acting similar with the "user input" items. A sample item could be "service restarted" (based on uptime got from the service monitored), so on the graphs to be displayed a label/comment: "Service restarted". Of course, we should still have the option to share the "user input" between all host graphs / host groups graphs and be available as well for proper permission filtering. |
| Comment by Cristian [ 2013 Jun 02 ] |
|
Btw, what do you think guys, should I raise the idea with "service restarted" kind of items raising labels on graphs as a separated Feature Request ? |
| Comment by richlv [ 2013 Jun 02 ] |
|
"event timeline" (or showing events on graphs) is ZBXNEXT-414 |
| Comment by Cristian [ 2013 Jun 02 ] |
|
Thanks richlv, I see a good connection with your "event timeline". |
| Comment by Strahinja Kustudic [ 2013 Nov 25 ] |
|
Since my task was a duplitcate to this one, here is my recomendation how to implement this feature. This could be implemented by adding a separate tab called "Date Markers" (or whatever) and on that tab you will be able to add a new date marker by giving it a:
The graphs should also have a check-box somewhere in the interface to enable/disable the display of those markers. I don't think there is a need to assign markers on graph level, since when you change something on a particular server, the whole server is impacted and it should be possible to hide markers (as suggested in the previouse sentence) on graphs, so if a change didn't have any impact on that graph you can always hide it. |
| Comment by Gareth Brown [ 2014 Feb 13 ] |
|
Bump. Can we raise the priority of this? There are a number of other services already offering this and it is a very useful triage feature. |
| Comment by Volker Fröhlich [ 2014 Jun 19 ] |
|
Just for reference: https://www.zabbix.org/wiki/Docs/comment_for_logstash |
| Comment by Max N [ 2015 Apr 07 ] |
|
This feature would be veeery useful. |
| Comment by Jeroen van den Berg [ 2015 May 13 ] |
|
Would be very, very nice to have. |
| Comment by Ricardo Lopes [ 2015 Sep 24 ] |
|
Hi, this is a must guys! Please do it! |
| Comment by Sergey Grechin [ 2016 Mar 13 ] |
|
I was surprised to find out there is no such thing, I mean, it simply must be there. |
| Comment by richlv [ 2016 Sep 23 ] |
|
more visualisation for inspiration : http://piwik.org/docs/annotations/ |
| Comment by Ricardo Lopes [ 2016 Sep 23 ] |
|
Holy crap! This Piwik is awesome ! That's precisely what we need. Because Zabbix monitoring is about events and performance monitoring. It is a must to add notes for certain graphs, for certain events. Note that these coments would only show up if they belong to the selected data! This is a very long request... already years. any roadmap including this feature? Can product owner prioritize it ? |
| Comment by Marc [ 2016 Sep 23 ] |
|
you can find the roadmap here: http://zabbix.org/wiki/Docs/roadmap (Co-)sponsoring development is the preferred way to prioritize a ZBXNEXT |
| Comment by richlv [ 2016 Sep 23 ] |
|
vapochilled, what okkuv9xh said - but keep in mind that zabbix team has stopped publishing official roadmap, the linked one is unofficial |
| Comment by Jeroen van den Berg [ 2017 Mar 08 ] |
|
Was so excited when you put this into a sprint, so sad now you removed it |
| Comment by RECASENS Xavier [ 2017 Mar 16 ] |
|
Marker on timeline is very important for us, we hesitate to change solution only cause of this feature. I hope Zabbix team will add this feature soon. |
| Comment by emi [ 2018 Feb 28 ] |
|
For completeness: |
| Comment by dimir [ 2021 Aug 02 ] |
|
|
| Comment by Brian van Baekel [ 2021 Aug 03 ] |
|
I agree with @dimir that |
| Comment by Rodrigo P [ 2022 Apr 13 ] |
|
What amazing feature. Hope to see it available soon. |
| Comment by Luciano Alves [ 2024 Jan 31 ] |
|
Hi Guys,
I think that with the evolution of Zabbix and the idea of using dashboards as the source/core for scheduled reports (in PDF), it is VERY relevant to revisit this topic to offer more options and features to Zabbix users/customers. One way we can benefit from this may align with the ideas here: http://speakingppt.com/10-rules-for-graph-annotations/ & https://www.storytellingwithdata.com/blog/2018/1/22/88-annotated-line-graphs ... in this case, the comments would be VISIBLE on the graph itself (optional?).
So ... the reports (in PDF) will give users and decision-makers all the info we've got in Zabbix (Comments/descriptions on triggers? Acknowledged comments? Graph comments? Item descriptions? Host descriptions? Macros? TAGs ? Etc, etc).
[]s, Luciano |
| Comment by LivreAcesso.Pro [ 2024 Mar 16 ] |
|
A "label" can be placed when a trigger is activated. It can be more clear than the current dotted-line of the triggers. |
[ZBX-18306] BUG Single Problem event generation mode Created: 2020 Aug 27 Updated: 2020 Sep 02 Resolved: 2020 Sep 02 |
|
| Status: | Closed |
| Project: | ZABBIX BUGS AND ISSUES |
| Component/s: | Agent (G), Frontend (F), Server (S) |
| Affects Version/s: | 5.0.2, 5.0.3 |
| Fix Version/s: | None |
| Type: | Problem report | Priority: | Trivial |
| Reporter: | Gabriel | Assignee: | Zabbix Support Team |
| Resolution: | Won't fix | Votes: | 0 |
| Labels: | events, multiple, problems, zabbix5.0, zabbix_server | ||
| Remaining Estimate: | Not Specified | ||
| Time Spent: | Not Specified | ||
| Original Estimate: | Not Specified | ||
| Attachments: |
|
| Description |
|
Steps to reproduce:
Result: Item screenshot
Problem screenshot
Expected: Only one Event should show in Problem dashboard. This functionality is like "Multiple" type of trigger. I tested the same with Zabbix4.0, and Zabbix3.0 and work correctly.
I created too a post in forum " Zabbix Troubleshooting and Problems". |
| Comments |
| Comment by Edgars Melveris [ 2020 Aug 31 ] |
|
Hello Gabriel.
grep fail /var/log/zabbix/zabbix_server.log
Additionally, it doesn't look like you are getting a new problem for each received value, as the problems are created less frequently. Can you check, when do you actually get new values (attach latest data as text) |
| Comment by Gabriel [ 2020 Sep 02 ] |
|
Hi Edgards! Thank you for your answer. We can close the ticket, the problem is solved. 2. On AWS IFR -> We had two zabbix_servers ON, so, we got the same data on Events two times. Sorry for inconvenience and again, thank you. |
| Comment by Gabriel [ 2020 Sep 02 ] |
|
1. On Kubernetes IFR -> I had problems with communication between the haproxy and postgresql. This caused communication errors and the same data being entered multiple times. 2. On AWS IFR -> We had two zabbix_servers ON, so, we got the same data on Events two times. |
| Comment by dimir [ 2020 Sep 02 ] |
|
Resolution "Fixed" can be used only when something was done on Zabbix side. Closing as "Won't Fix". |
[ZBX-16925] Deadlocks on events when table is big and housekeeper runing Created: 2019 Nov 15 Updated: 2020 Jun 03 |
|
| Status: | Confirmed |
| Project: | ZABBIX BUGS AND ISSUES |
| Component/s: | Server (S) |
| Affects Version/s: | 4.2.8 |
| Fix Version/s: | None |
| Type: | Problem report | Priority: | Trivial |
| Reporter: | Elina Kuzyutkina (Inactive) | Assignee: | Zabbix Development Team |
| Resolution: | Unresolved | Votes: | 4 |
| Labels: | events, housekeeper | ||
| Remaining Estimate: | Not Specified | ||
| Time Spent: | Not Specified | ||
| Original Estimate: | Not Specified | ||
| Issue Links: |
|
||||
| Story Points: | 1 | ||||
| Description |
|
Mysql is backend DB. And there is two points to review: *** (1) TRANSACTION: TRANSACTION 208532068729, ACTIVE 1 sec inserting mysql tables in use 1, locked 1 LOCK WAIT 4 lock struct(s), heap size 1136, 2 row lock(s), undo log entries 2 MySQL thread id 55502371, OS thread handle 48238530000640, query id 11973893554 some IP zabbix_server update insert into problem (eventid,source,object,objectid,clock,ns,name,severity) values (.....) *** (1) WAITING FOR THIS LOCK TO BE GRANTED: RECORD LOCKS space id 17517 page no 4384 n bits 1160 index problem_3 of table `zabbix`.`problem` trx id 208532068729 lock_mode X locks gap before rec insert intention waiting *** (2) TRANSACTION: TRANSACTION 208531990205, ACTIVE 565 sec fetching rows mysql tables in use 1, locked 1 20493 lock struct(s), heap size 2203856, 3433920 row lock(s), undo log entries 76042 MySQL thread id 56387211, OS thread handle 48238574192384, query id 11972947767 some IP zabbix_server updating delete from events where (eventid between ...... *** (2) HOLDS THE LOCK(S): RECORD LOCKS space id 17517 page no 4384 n bits 1160 index problem_3 of table `zabbix`.`problem` trx id 208531990205 lock mode S locks gap before rec *** (2) WAITING FOR THIS LOCK TO BE GRANTED: RECORD LOCKS space id 17876 page no 23305 n bits 168 index PRIMARY of table `zabbix`.`events` trx id 208531990205 lock_mode X waiting *** WE ROLL BACK TRANSACTION (1) 2. Storage period for internal events is configured to 1 day, but there is also alot of unsupported items. So houskeeper will not delete ones that are in problem state (still unsupported). It might make sense to review internal event storage. It is even possible to remove the generation of recovery events for internal data elements for the sake of being able to delete them after a set period (1day)? |
| Comments |
| Comment by Vladislavs Sokurenko [ 2019 Nov 15 ] |
|
If talking about second part of the issue it would be nice not to generate internal events if checked in cache that there are no actions to be executed for them. |
[ZBX-16021] Basic trigger stuck on Problem state yet item data doesn't match expression Created: 2019 Apr 17 Updated: 2019 Apr 18 Resolved: 2019 Apr 18 |
|
| Status: | Closed |
| Project: | ZABBIX BUGS AND ISSUES |
| Component/s: | Server (S) |
| Affects Version/s: | None |
| Fix Version/s: | None |
| Type: | Incident report | Priority: | Critical |
| Reporter: | Jerome | Assignee: | Edmunds Vesmanis |
| Resolution: | Unsupported version | Votes: | 0 |
| Labels: | events, problems, triggers | ||
| Remaining Estimate: | Not Specified | ||
| Time Spent: | Not Specified | ||
| Original Estimate: | Not Specified | ||
| Environment: |
zabbix_server (Zabbix) 3.4.1 Revision 71734 (under Debian), database on a separate debian host. I monitor multiple windows and linux hosts (mostly virtual hosts). |
||
| Description |
|
Hello, I have an issue that is starting to repeat itself on several items.
Here's my situation : I have triggers that used to work fine but sometimes some of them stay stuck in problem state even after the issue is resolved and what is weird is that the data of the item associated to the trigger is correct and normally collected. It seems to always be a templated/discovered trigger of a windows host (to confirm). Example: This templated/discovered trigger expression : {hostname:service_state[_*Service Name*_].last()}<>0 the related item is of type "Zabbix agent (active)" _"_OK event generation" is set on "Expression" "PROBLEM event generation mode" is set on "single"
When the service is running the item returns 0, today the service has stopped for a while then went back up, which is confirmed by the graph of the item, yet the trigger is stuck on problem state... restarting agent and server didn't help, clearing history/trends, disabling/re-enabling the item or the trigger didn't help either, only fix i have found so far is deleting the discovered item (or trigger i don't remember and I didn't fix today's issue to understand how to fix this behavior permanently), then when it gets created again by the discovery, it solves the issue.
The server is running a quite old version (3.4.1 rev 71734) and I've seen similar issues on this JIRA but on server version 3.2, i've read those issues should be fixed in the verison I run. But still, I have tried this query : update triggers set value=0 where value=1 and triggerid not in (select distinct objectid from problem); And it did not solved the issue as the said triggers didn't appear in the list of affected rows anyway.
So I don't know what to look for here... any help would be greatly appreciated, thanks. |
| Comments |
| Comment by Edmunds Vesmanis [ 2019 Apr 18 ] |
|
Hi, Jerome What's stopping you from updating to latest release or I would even recommend to use 4.0.x (LTS - Long Term Support) version. Regards, |
| Comment by Jerome [ 2019 Apr 18 ] |
|
Hello, Yeah upgrading may be the answer, my team got shy about this because none of us where there when the server got installed so it might be a bit risky for us but if that's the only way then we'll be forced to.. So you're saying that ticket won't be resolved anyway because of the fact it is not supported anymore ? Best regards |
[ZBX-16005] Simple macros containing regsub in event names are upgraded to *UNKNOWN* Created: 2019 Apr 16 Updated: 2024 Apr 10 Resolved: 2019 May 01 |
|
| Status: | Closed |
| Project: | ZABBIX BUGS AND ISSUES |
| Component/s: | Server (S) |
| Affects Version/s: | 4.0.6, 4.2.0, 4.4.0alpha1, 4.4 (plan) |
| Fix Version/s: | 4.0.8rc1, 4.2.2rc1, 4.4.0alpha1, 4.4 (plan) |
| Type: | Problem report | Priority: | Trivial |
| Reporter: | Vladislavs Sokurenko | Assignee: | Vladislavs Sokurenko |
| Resolution: | Fixed | Votes: | 0 |
| Labels: | events, triggers, unknown, upgrade | ||
| Remaining Estimate: | Not Specified | ||
| Time Spent: | Not Specified | ||
| Original Estimate: | Not Specified | ||
| Issue Links: |
|
||||||||
| Team: | |
||||||||
| Sprint: | Sprint 51 (Apr 2019) | ||||||||
| Story Points: | 0.5 | ||||||||
| Description |
|
Generate problem event with following trigger in 3.4 and value 13:
trap1_trig {ITEM.VALUE} {ITEM.LASTVALUE} {{ITEM.VALUE}.regsub("([0-9])", \0)}
Perform upgrade to 4.0: See: trap1_trig 13 13 *UNKNOWN* Expected: trap1_trig 13 13 1 regsub is not handled properly |
| Comments |
| Comment by Vladislavs Sokurenko [ 2019 Apr 16 ] |
|
Fixed in development branch: |
| Comment by Vladislavs Sokurenko [ 2019 Apr 24 ] |
|
Fixed in:
|
[ZBX-12778] Broken selection by tags in problem.get and event.get methods Created: 2017 Sep 26 Updated: 2024 Apr 10 Resolved: 2018 Jan 04 |
|
| Status: | Closed |
| Project: | ZABBIX BUGS AND ISSUES |
| Component/s: | API (A) |
| Affects Version/s: | 3.4.2, 4.0.0alpha1 |
| Fix Version/s: | 3.4.4rc1, 4.0.0alpha1, 4.0 (plan) |
| Type: | Problem report | Priority: | Critical |
| Reporter: | Ivo Kurzemnieks | Assignee: | Ivo Kurzemnieks |
| Resolution: | Fixed | Votes: | 0 |
| Labels: | api, events, problems | ||
| Remaining Estimate: | Not Specified | ||
| Time Spent: | Not Specified | ||
| Original Estimate: | Not Specified | ||
| Issue Links: |
|
||||||||
| Team: | |
||||||||
| Sprint: | Sprint 18, Sprint 19, Sprint 24 | ||||||||
| Story Points: | 4 | ||||||||
| Description |
|
1. Create a host with an item and a few triggers with tags and values:
or more if desired, but this will do enough for example. 2. Generate some problems and check the API methods problem.get and event.get:
{
    "output": ["eventid"],
    "tags": [
        {
            "tag": "Service",
            "value": "abc"
        }
    ],
    "selectTags": "extend"
}
3. Observe the broken result: "result": [ { "eventid": "167", "tags": [] }, { "eventid": "168", "tags": [] }, { "tags": [ [], [], [] ] } ] 4. Expected result: "result": [ { "eventid": "85", "tags": [ { "tag": "Service", "value": "abc" }, { "tag": "service", "value": "abcdef" } ] }, { "eventid": "86", "tags": [ { "tag": "Service", "value": "abc" } ] } ] |
| Comments |
| Comment by Ivo Kurzemnieks [ 2017 Oct 11 ] |
|
(1) No translation string changes. sasha CLOSED |
| Comment by Ivo Kurzemnieks [ 2017 Oct 11 ] |
|
RESOLVED in svn://svn.zabbix.com/branches/dev/ZBX-12778 |
| Comment by Ivo Kurzemnieks [ 2017 Oct 23 ] |
|
Fixed in:
|
| Comment by Ivo Kurzemnieks [ 2018 Jan 03 ] |
|
(3) [D] API Documentation updated: sasha Looks good to me. Thanks! CLOSED |
[ZBX-12758] Postgresql problem table missing index on r_eventid while MySQL InnoDB automatically adds it Created: 2017 Sep 21 Updated: 2024 Apr 10 Resolved: 2017 Dec 28 |
|
| Status: | Closed |
| Project: | ZABBIX BUGS AND ISSUES |
| Component/s: | Server (S) |
| Affects Version/s: | 3.2.8rc1, 3.4.2rc1 |
| Fix Version/s: | 3.4.6rc1, 4.0.0alpha2, 4.0 (plan) |
| Type: | Problem report | Priority: | Critical |
| Reporter: | JB | Assignee: | Vladislavs Sokurenko |
| Resolution: | Fixed | Votes: | 0 |
| Labels: | events, housekeeper, index, oracle, performance, postgresql, problem | ||
| Remaining Estimate: | Not Specified | ||
| Time Spent: | Not Specified | ||
| Original Estimate: | Not Specified | ||
| Environment: |
CentOS Linux release 7.3.1611 (Core) |
||
| Issue Links: |
|
||||||||
| Team: | |
||||||||
| Sprint: | Sprint 18, Sprint 19, Sprint 21, Sprint 22, Sprint 23, Sprint 24 | ||||||||
| Story Points: | 2 | ||||||||
| Description |
|
Housekeeper hangs when trying to delete old events. Manually trying to delete events take long time. Trying to delete one minute of events: zabbix=# explain analyze delete FROM events where age(to_timestamp(events.clock)) > interval '7 days 18:59:00'; QUERY PLAN ---------------------------------------------------------------------------------------------------------------------------- ---------------------- Delete on events (cost=0.00..212828.92 rows=1978096 width=6) (actual time=12120.870..12120.870 rows=0 loops=1) -> Seq Scan on events (cost=0.00..212828.92 rows=1978096 width=6) (actual time=5015.858..12119.974 rows=282 loops=1) Filter: (age((('now'::cstring)::date)::timestamp with time zone, to_timestamp((clock)::double precision)) > '7 days 18:59:00'::interval) Rows Removed by Filter: 5919455 Trigger for constraint c_acknowledges_2: time=3.971 calls=282 Trigger for constraint c_alerts_2: time=3.933 calls=282 Trigger for constraint c_event_tag_1: time=3.530 calls=282 Trigger for constraint c_problem_1: time=4.266 calls=282 Trigger for constraint c_event_recovery_1: time=5.458 calls=282 Trigger for constraint c_event_recovery_2: time=4.280 calls=282 Trigger for constraint c_problem_2: time=17571.926 calls=282 Trigger for constraint c_event_recovery_3: time=12.291 calls=282 Trigger for constraint c_alerts_5: time=4.937 calls=282 Total runtime: 29736.092 ms Added a new index, and was able to delete 1 hour of data faster than 1 minute without the index: zabbix=# create index problem_3 on problem(r_eventid); zabbix=# explain analyze delete FROM events where age(to_timestamp(events.clock)) > interval '7 days 18:00:00'; QUERY PLAN ---------------------------------------------------------------------------------------------------------------------------- ---------------------- Delete on events (cost=0.00..214479.72 rows=1993439 width=6) (actual time=12327.789..12327.789 rows=0 loops=1) -> Seq Scan on events (cost=0.00..214479.72 rows=1993439 width=6) (actual time=5173.513..12297.065 rows=26258 loops=1) Filter: (age((('now'::cstring)::date)::timestamp with time zone, to_timestamp((clock)::double precision)) > '7 days 18:00:00'::interval) Rows Removed by Filter: 5930573 Trigger for constraint c_acknowledges_2: time=166.392 calls=26258 Trigger for constraint c_alerts_2: time=183.011 calls=26258 Trigger for constraint c_event_tag_1: time=163.226 calls=26258 Trigger for constraint c_problem_1: time=184.327 calls=26258 Trigger for constraint c_event_recovery_1: time=210.511 calls=26258 Trigger for constraint c_event_recovery_2: time=200.982 calls=26258 Trigger for constraint c_problem_2: time=188.991 calls=26258 Trigger for constraint c_event_recovery_3: time=183.742 calls=26258 Trigger for constraint c_alerts_5: time=185.132 calls=26258 Total runtime: 14012.007 ms (14 rows) |
| Comments |
| Comment by JB [ 2017 Sep 21 ] | ||||||||
|
After adding the index the housekeeper finish in no time! | ||||||||
| Comment by Vladislavs Sokurenko [ 2017 Sep 21 ] | ||||||||
|
could you please be so kind and do | ||||||||
| Comment by JB [ 2017 Sep 21 ] | ||||||||
zabbix=# \d+ problem
                                   Table "public.problem"
    Column     |  Type   |         Modifiers          | Storage | Stats target | Description
---------------+---------+----------------------------+---------+--------------+-------------
 eventid       | bigint  | not null                   | plain   |              |
 source        | integer | not null default 0         | plain   |              |
 object        | integer | not null default 0         | plain   |              |
 objectid      | bigint  | not null default 0::bigint | plain   |              |
 clock         | integer | not null default 0         | plain   |              |
 ns            | integer | not null default 0         | plain   |              |
 r_eventid     | bigint  |                            | plain   |              |
 r_clock       | integer | not null default 0         | plain   |              |
 r_ns          | integer | not null default 0         | plain   |              |
 correlationid | bigint  |                            | plain   |              |
 userid        | bigint  |                            | plain   |              |
Indexes:
    "problem_pkey" PRIMARY KEY, btree (eventid)
    "problem_1" btree (source, object, objectid)
    "problem_2" btree (r_clock)
    "problem_3" btree (r_eventid)
Foreign-key constraints:
    "c_problem_1" FOREIGN KEY (eventid) REFERENCES events(eventid) ON DELETE CASCADE
    "c_problem_2" FOREIGN KEY (r_eventid) REFERENCES events(eventid) ON DELETE CASCADE
Referenced by:
    TABLE "problem_tag" CONSTRAINT "c_problem_tag_1" FOREIGN KEY (eventid) REFERENCES problem(eventid) ON DELETE CASCADE
Has OIDs: no
| ||||||||
| Comment by Vladislavs Sokurenko [ 2017 Sep 21 ] | ||||||||
|
Thank you very much for your report, please note that issue does not occur in InnoDB because it will create indexes automatically, that's why it was missed! | ||||||||
| Comment by JB [ 2017 Sep 21 ] | ||||||||
|
Thank you for quick response! | ||||||||
| Comment by Valdis Kauķis (Inactive) [ 2017 Dec 05 ] | ||||||||
|
Successfully tested, including fixed conflicts in r75416, | ||||||||
| Comment by Vladislavs Sokurenko [ 2017 Dec 28 ] | ||||||||
|
Fixed in:
| ||||||||
| Comment by Brian Beaulieu [ 2017 Dec 28 ] | ||||||||
|
Had this index missing in 3.4.5 on MySQL.. installing/updating from RPM. | ||||||||
| Comment by Vladislavs Sokurenko [ 2017 Dec 29 ] | ||||||||
|
Could you please be so kind and provide output of: show create table problem; No, there are no post-update SQL, on MySQL index is created automatically. | ||||||||
| Comment by Brian Beaulieu [ 2017 Dec 29 ] | ||||||||
|
Hello, Index didn't help
No partitioning. Haven't had any issues with housekeeping until 3.4.5 CREATE TABLE `problem` ( `eventid` bigint(20) unsigned NOT NULL, `source` int(11) NOT NULL DEFAULT '0', `object` int(11) NOT NULL DEFAULT '0', `objectid` bigint(20) unsigned NOT NULL DEFAULT '0', `clock` int(11) NOT NULL DEFAULT '0', `ns` int(11) NOT NULL DEFAULT '0', `r_eventid` bigint(20) unsigned DEFAULT NULL, `r_clock` int(11) NOT NULL DEFAULT '0', `r_ns` int(11) NOT NULL DEFAULT '0', `correlationid` bigint(20) unsigned DEFAULT NULL, `userid` bigint(20) unsigned DEFAULT NULL, PRIMARY KEY (`eventid`), KEY `problem_1` (`source`,`object`,`objectid`), KEY `problem_2` (`r_clock`), KEY `problem_3` (`r_eventid`), CONSTRAINT `c_problem_1` FOREIGN KEY (`eventid`) REFERENCES `events` (`eventid`) ON DELETE CASCADE, CONSTRAINT `c_problem_2` FOREIGN KEY (`r_eventid`) REFERENCES `events` (`eventid`) ON DELETE CASCADE ) ENGINE=InnoDB DEFAULT CHARSET=utf8 | ||||||||
| Comment by Brian Beaulieu [ 2017 Dec 29 ] | ||||||||
mysql> select count(*) from events; +----------+ | count(*) | +----------+ | 14245852 | +----------+ 1 row in set (16.20 sec) mysql> show create table events; CREATE TABLE `events` ( `eventid` bigint(20) unsigned NOT NULL, `source` int(11) NOT NULL DEFAULT '0', `object` int(11) NOT NULL DEFAULT '0', `objectid` bigint(20) unsigned NOT NULL DEFAULT '0', `clock` int(11) NOT NULL DEFAULT '0', `value` int(11) NOT NULL DEFAULT '0', `acknowledged` int(11) NOT NULL DEFAULT '0', `ns` int(11) NOT NULL DEFAULT '0', PRIMARY KEY (`eventid`), KEY `events_1` (`source`,`object`,`objectid`,`clock`), KEY `events_2` (`source`,`object`,`clock`) ) ENGINE=InnoDB DEFAULT CHARSET=utf8 | | ||||||||
| Comment by Vladislavs Sokurenko [ 2017 Dec 29 ] | ||||||||
|
It would be great to see whole query that is slow if possible please, you could also do explain on the query, but it looks like you simply have lots of events, how many problems do you have ? Please also provide MySQL version | ||||||||
| Comment by Ronald Schaten [ 2017 Dec 29 ] | ||||||||
|
Same problem here, after update from 3.2.6 to 3.4.5. My tables look like Brian described, the full query is: select min(clock) from events where events.source=3 and events.object=0 and not exists (select null from problem where events.eventid=problem.eventid or events.eventid=problem.r_eventid) The events table has 132463031 rows, problem table has 766423 rows. MySQL is "Ver 14.14 Distrib 5.7.20, for Linux (x86_64) using EditLine wrapper", running on Ubuntu 16.04. mysql> explain select min(clock) from events where events.source=3 and events.object=0 and not exists (select null from problem where events.eventid=problem.eventid or events.eventid=problem.r_eventid)\G
*************************** 1. row ***************************
id: 1
select_type: PRIMARY
table: events
partitions: NULL
type: ref
possible_keys: events_1,events_2
key: events_2
key_len: 8
ref: const,const
rows: 15964577
filtered: 100.00
Extra: Using where; Using index
*************************** 2. row ***************************
id: 2
select_type: DEPENDENT SUBQUERY
table: problem
partitions: NULL
type: ALL
possible_keys: PRIMARY,c_problem_2
key: NULL
key_len: NULL
ref: NULL
rows: 708846
filtered: 19.00
Extra: Range checked for each record (index map: 0x9)
2 rows in set, 3 warnings (0,00 sec)
The database is partitioned, but events and problem tables are not. Upgrade notes for 3.4.0 recommend to decrease storage period for some events from 365d to 1d. Coming from Zabbix 3.2, I did that on my system. But only after doing the update, so of course the tables still contain quite many rows. | ||||||||
| Comment by Vladislavs Sokurenko [ 2017 Dec 29 ] | ||||||||
|
Could you please also attach show create table problem; ? | ||||||||
| Comment by Ronald Schaten [ 2017 Dec 29 ] | ||||||||
|
As mentioned, to me it looks like the one Brian attached this morning: CREATE TABLE `problem` ( `eventid` bigint(20) unsigned NOT NULL, `source` int(11) NOT NULL DEFAULT '0', `object` int(11) NOT NULL DEFAULT '0', `objectid` bigint(20) unsigned NOT NULL DEFAULT '0', `clock` int(11) NOT NULL DEFAULT '0', `ns` int(11) NOT NULL DEFAULT '0', `r_eventid` bigint(20) unsigned DEFAULT NULL, `r_clock` int(11) NOT NULL DEFAULT '0', `r_ns` int(11) NOT NULL DEFAULT '0', `correlationid` bigint(20) unsigned DEFAULT NULL, `userid` bigint(20) unsigned DEFAULT NULL, PRIMARY KEY (`eventid`), KEY `problem_1` (`source`,`object`,`objectid`), KEY `problem_2` (`r_clock`), KEY `c_problem_2` (`r_eventid`), CONSTRAINT `c_problem_1` FOREIGN KEY (`eventid`) REFERENCES `events` (`eventid`) ON DELETE CASCADE, CONSTRAINT `c_problem_2` FOREIGN KEY (`r_eventid`) REFERENCES `events` (`eventid`) ON DELETE CASCADE ) ENGINE=InnoDB DEFAULT CHARACTER SET utf8mb4 COLLATE utf8mb4_bin | ||||||||
| Comment by Vladislavs Sokurenko [ 2017 Dec 29 ] | ||||||||
|
Can you try this please explain select min(clock) from events where events.source=3 and events.object=0 and not exists (select null from problem where events.eventid=problem.eventid) and not exists (select null from problem where events.eventid=problem.r_eventid)\G | ||||||||
| Comment by Ronald Schaten [ 2017 Dec 29 ] | ||||||||
mysql> explain select min(clock) from events where events.source=3 and events.object=0 and not exists (select null from problem where events.eventid=problem.eventid) and not exists (select null from problem where events.eventid=problem.r_eventid)\G
*************************** 1. row ***************************
           id: 1
  select_type: PRIMARY
        table: events
   partitions: NULL
         type: ref
possible_keys: events_1,events_2
          key: events_2
      key_len: 8
          ref: const,const
         rows: 15973658
     filtered: 100.00
        Extra: Using where; Using index
*************************** 2. row ***************************
           id: 3
  select_type: DEPENDENT SUBQUERY
        table: problem
   partitions: NULL
         type: ref
possible_keys: c_problem_2
          key: c_problem_2
      key_len: 9
          ref: zabbix.events.eventid
         rows: 1
     filtered: 100.00
        Extra: Using index
*************************** 3. row ***************************
           id: 2
  select_type: DEPENDENT SUBQUERY
        table: problem
   partitions: NULL
         type: eq_ref
possible_keys: PRIMARY
          key: PRIMARY
      key_len: 8
          ref: zabbix.events.eventid
         rows: 1
     filtered: 100.00
        Extra: Using index
3 rows in set, 3 warnings (0,00 sec)
| ||||||||
| Comment by Vladislavs Sokurenko [ 2017 Dec 29 ] | ||||||||
|
Thanks, Can you confirm that second query is faster ? select min(clock) from events where events.source=3 and events.object=0 and not exists (select null from problem where events.eventid=problem.eventid or events.eventid=problem.r_eventid); select min(clock) from events where events.source=3 and events.object=0 and not exists (select null from problem where events.eventid=problem.eventid) and not exists (select null from problem where events.eventid=problem.r_eventid); | ||||||||
| Comment by Ronald Schaten [ 2017 Dec 29 ] | ||||||||
|
Yes. The second query took less than 18 minutes, the original one ran more than eight hours before I terminated it. | ||||||||
| Comment by Vladislavs Sokurenko [ 2017 Dec 29 ] | ||||||||
|
Thanks allot created | ||||||||
| Comment by Oleksii Zagorskyi [ 2018 Feb 19 ] | ||||||||
|
I'm on mysql and started my zabbix from 3.4. KEY `c_problem_2` (`r_eventid`), KEY `problem_3` (`r_eventid`), Before upgrade I had only `c_problem_2` index. Maybe the procedure should be more smart to not create duplicated indexes for mysql? vso this procedure does not create duplicate indexes, you can run patch multiple times and it will no longer create index with the name 'problem_3'. Could you please attach outout of show create table problem; ? zalex_ua those 2 lines are from the such output. I did already "drop index c_problem_2 on problem;" as it's a production database, which I had to dump and restore to maintain it, there was a reason. static int DBpatch_3040006(void) { if (FAIL == DBindex_exists("problem", "problem_3")) return DBcreate_index("problem", "problem_3", "r_eventid", 0); Ahh, I had db backup (because I had to manage it), here is schema before I ran 3.4.6 after 3.4.5:
mysql> show create table problem \G
*************************** 1. row ***************************
Table: problem
Create Table: CREATE TABLE `problem` (
`eventid` bigint(20) unsigned NOT NULL,
`source` int(11) NOT NULL DEFAULT '0',
`object` int(11) NOT NULL DEFAULT '0',
`objectid` bigint(20) unsigned NOT NULL DEFAULT '0',
`clock` int(11) NOT NULL DEFAULT '0',
`ns` int(11) NOT NULL DEFAULT '0',
`r_eventid` bigint(20) unsigned DEFAULT NULL,
`r_clock` int(11) NOT NULL DEFAULT '0',
`r_ns` int(11) NOT NULL DEFAULT '0',
`correlationid` bigint(20) unsigned DEFAULT NULL,
`userid` bigint(20) unsigned DEFAULT NULL,
PRIMARY KEY (`eventid`),
KEY `problem_1` (`source`,`object`,`objectid`),
KEY `problem_2` (`r_clock`),
KEY `c_problem_2` (`r_eventid`),
CONSTRAINT `c_problem_1` FOREIGN KEY (`eventid`) REFERENCES `events` (`eventid`) ON DELETE CASCADE,
CONSTRAINT `c_problem_2` FOREIGN KEY (`r_eventid`) REFERENCES `events` (`eventid`) ON DELETE CASCADE
) ENGINE=InnoDB DEFAULT CHARACTER SET utf8mb4 COLLATE utf8mb4_bin
1 row in set (0.00 sec)
Strange, I performed a clean test: created DB schema+images+data from 3.4.5 sources, upgrade it by 3.4.7 binary, what I had and received `c_problem_2` index magically replaced by `problem_3` index.
mysql> show create table problem \G
*************************** 1. row ***************************
Table: problem
Create Table: CREATE TABLE `problem` (
`eventid` bigint(20) unsigned NOT NULL,
`source` int(11) NOT NULL DEFAULT '0',
`object` int(11) NOT NULL DEFAULT '0',
`objectid` bigint(20) unsigned NOT NULL DEFAULT '0',
`clock` int(11) NOT NULL DEFAULT '0',
`ns` int(11) NOT NULL DEFAULT '0',
`r_eventid` bigint(20) unsigned DEFAULT NULL,
`r_clock` int(11) NOT NULL DEFAULT '0',
`r_ns` int(11) NOT NULL DEFAULT '0',
`correlationid` bigint(20) unsigned DEFAULT NULL,
`userid` bigint(20) unsigned DEFAULT NULL,
PRIMARY KEY (`eventid`),
KEY `problem_1` (`source`,`object`,`objectid`),
KEY `problem_2` (`r_clock`),
  KEY `c_problem_2` (`r_eventid`),
  KEY `problem_3` (`r_eventid`),
CONSTRAINT `c_problem_1` FOREIGN KEY (`eventid`) REFERENCES `events` (`eventid`) ON DELETE CASCADE,
CONSTRAINT `c_problem_2` FOREIGN KEY (`r_eventid`) REFERENCES `events` (`eventid`) ON DELETE CASCADE
) ENGINE=InnoDB DEFAULT CHARSET=utf8 COLLATE=utf8_bin
1 row in set (0.00 sec)
For both DBs (just created from schema+images+data SQLs and recovered from dump), upgrade debug log is identical: z345: 20173:20180219:125955.039 starting automatic database upgrade 20173:20180219:125955.039 query [txnlev:1] [begin;] 20173:20180219:125955.039 query [txnlev:1] [show index from problem where key_name='problem_3'] 20173:20180219:125955.040 query [txnlev:1] [create index problem_3 on problem (r_eventid)] 20173:20180219:125955.058 query [txnlev:1] [update dbversion set optional=3040006] 20173:20180219:125955.059 query [txnlev:1] [commit;] 20173:20180219:125955.059 completed 100% of database upgrade 20173:20180219:125955.059 database upgrade fully completed z345recovered: 20351:20180219:130053.868 starting automatic database upgrade 20351:20180219:130053.868 query [txnlev:1] [begin;] 20351:20180219:130053.868 query [txnlev:1] [show index from problem where key_name='problem_3'] 20351:20180219:130053.869 query [txnlev:1] [create index problem_3 on problem (r_eventid)] 20351:20180219:130053.886 query [txnlev:1] [update dbversion set optional=3040006] 20351:20180219:130053.887 query [txnlev:1] [commit;] 20351:20180219:130053.887 completed 100% of database upgrade 20351:20180219:130053.887 database upgrade fully completed Of course mysqldump, taken from created database, contains a line KEY `c_problem_2` (`r_eventid`), while schema.sql does not. Fuhh, probably it should not be ignored, as it really happened in production vso this is very unfortunate that MySQL acts differently when you restore backup, we could add another condition for 'c_problem_2' and would have to rename this index if it exists. zalex_ua maybe. Please take care on it further. And probably 3.4.6 schema should be checked the same way, because you have added the index creation explicitly to schema.sql. vso It's best if you create a separate bug report. |
[ZBX-12696] An event does not occur when the item becomes "not supported" by monitoring via proxy. Created: 2017 Sep 08 Updated: 2024 Apr 10 Resolved: 2017 Sep 11 |
|
| Status: | Closed |
| Project: | ZABBIX BUGS AND ISSUES |
| Component/s: | Proxy (P), Server (S) |
| Affects Version/s: | 2.2.19, 3.0.10, 3.2.7, 3.4.1 |
| Fix Version/s: | 2.2.20rc1, 3.0.11rc1, 3.2.8rc1, 3.4.2rc1, 4.0.0alpha1, 4.0 (plan) |
| Type: | Incident report | Priority: | Blocker |
| Reporter: | Kazuo Ito | Assignee: | Vladislavs Sokurenko |
| Resolution: | Fixed | Votes: | 0 |
| Labels: | events, notsupported | ||
| Remaining Estimate: | Not Specified | ||
| Time Spent: | Not Specified | ||
| Original Estimate: | Not Specified | ||
| Attachments: |
|
||||
| Issue Links: |
|
||||
| Team: | |
||||
| Sprint: | Sprint 16 | ||||
| Story Points: | 2 | ||||
| Description |
|
This problem occurs when data is accumulated while Zabbix server and Zabbix proxy are unable to communicate and the item becomes "not supported" at the end. 1) Monitoring via Zabbix proxy Register host 'test'. 4) Execute the following from Zabbix proxy. ]# /usr/bin/zabbix_sender -vv -z 127.0.0.1 -s test -k test -o 0
zabbix_sender [2151]: DEBUG: answer [{"response":"success","info":"processed: 1; failed: 0; total: 1; seconds spent: 0.001339"}]
info from server: "processed: 1; failed: 0; total: 1; seconds spent: 0.001339"
sent: 1; skipped: 0; total: 1
]# /usr/bin/zabbix_sender -vv -z 127.0.0.1 -s test -k test -o 1
zabbix_sender [2153]: DEBUG: answer [{"response":"success","info":"processed: 1; failed: 0; total: 1; seconds spent: 0.000044"}]
info from server: "processed: 1; failed: 0; total: 1; seconds spent: 0.000044"
sent: 1; skipped: 0; total: 1
]# /usr/bin/zabbix_sender -vv -z 127.0.0.1 -s test -k test -o 0
zabbix_sender [2155]: DEBUG: answer [{"response":"success","info":"processed: 1; failed: 0; total: 1; seconds spent: 0.000043"}]
info from server: "processed: 1; failed: 0; total: 1; seconds spent: 0.000043"
sent: 1; skipped: 0; total: 1
5) Communication disconnection between Zabbix server and Zabbix proxy. 6) Execute the following from Zabbix proxy. ]# /usr/bin/zabbix_sender -vv -z 127.0.0.1 -s test -k test -o 0
zabbix_sender [2162]: DEBUG: answer [{"response":"success","info":"processed: 1; failed: 0; total: 1; seconds spent: 0.000053"}]
info from server: "processed: 1; failed: 0; total: 1; seconds spent: 0.000053"
sent: 1; skipped: 0; total: 1
]# /usr/bin/zabbix_sender -vv -z 127.0.0.1 -s test -k test -o 1
zabbix_sender [2164]: DEBUG: answer [{"response":"success","info":"processed: 1; failed: 0; total: 1; seconds spent: 0.000044"}]
info from server: "processed: 1; failed: 0; total: 1; seconds spent: 0.000044"
sent: 1; skipped: 0; total: 1
]# /usr/bin/zabbix_sender -vv -z 127.0.0.1 -s test -k test -o "a"
zabbix_sender [2166]: DEBUG: answer [{"response":"success","info":"processed: 0; failed: 1; total: 1; seconds spent: 0.000084"}]
info from server: "processed: 0; failed: 1; total: 1; seconds spent: 0.000084"
sent: 1; skipped: 0; total: 1
]#
7) Communication recovery between Zabbix server and Zabbix proxy.
No event occurs. |
| Comments |
| Comment by Alexander Vladishev [ 2017 Sep 08 ] |
|
Confirmed on latest 2.2 r72324 wiper trunk seems to be working properly. Either there is more more complicated setup, or it was accentally fixed in some version (probably 3.4). JKKim FYI : I confirmed this problem has occur on Zabbix 3.2.7. I have not check 3.4 yet, but maybe Zabbix 3.4 has another Issue from vso I also confirm on 2.2 |
| Comment by Andris Zeila [ 2017 Sep 11 ] |
|
Successfully tested However this will not properly work with vso added sub issue there. |
| Comment by Vladislavs Sokurenko [ 2017 Sep 11 ] |
|
Fixed in:
|
[ZBX-12191] Timeline on Monitoring->Events does not keep selected time period Created: 2017 May 17 Updated: 2024 Apr 10 Resolved: 2017 Oct 10 |
|
| Status: | Closed |
| Project: | ZABBIX BUGS AND ISSUES |
| Component/s: | Frontend (F) |
| Affects Version/s: | 3.0.9 |
| Fix Version/s: | 3.0.12rc1 |
| Type: | Patch request | Priority: | Minor |
| Reporter: | Alexey Pustovalov | Assignee: | Unassigned |
| Resolution: | Fixed | Votes: | 0 |
| Labels: | events, pagination | ||
| Remaining Estimate: | Not Specified | ||
| Time Spent: | Not Specified | ||
| Original Estimate: | Not Specified | ||
| Issue Links: |
|
||||||||||||
| Team: | |
||||||||||||
| Sprint: | Sprint 9, Sprint 10, Sprint 14, Sprint 15, Sprint 16, Sprint 17, Sprint 18 | ||||||||||||
| Story Points: | 0.5 | ||||||||||||
| Description |
|
| Comments |
| Comment by Miks Kronkalns [ 2017 Sep 11 ] |
|
(1) No translation strings changes vmurzins CLOSED |
| Comment by Miks Kronkalns [ 2017 Oct 03 ] |
|
Fixed:
|
[ZBX-12023] Trigger permissions don't work properly Created: 2017 Apr 07 Updated: 2024 Apr 10 Resolved: 2018 Feb 16 |
|
| Status: | Closed |
| Project: | ZABBIX BUGS AND ISSUES |
| Component/s: | API (A) |
| Affects Version/s: | 3.0.7 |
| Fix Version/s: | 2.2.19rc1, 3.0.10rc1, 3.2.7rc1, 3.4.0alpha1 |
| Type: | Incident report | Priority: | Major |
| Reporter: | Maksims Tarleckis (Inactive) | Assignee: | Unassigned |
| Resolution: | Fixed | Votes: | 0 |
| Labels: | events, graphprototypes, graphs, permissions, triggerprototypes, triggers | ||
| Remaining Estimate: | Not Specified | ||
| Time Spent: | Not Specified | ||
| Original Estimate: | Not Specified | ||
| Attachments: |
|
| Team: | |
| Story Points: | 14 |
| Description |
|
Triggers was not allowed for user if even one of related hosts in expression is not included to host group for that user. Steps to reproduce for
ACTUAL RESULT: curl --request POST \ --url http://localhost/zabbix30/api_jsonrpc.php \ --header 'cache-control: no-cache' \ --header 'content-type: application/json' \ --data '{\n "jsonrpc": "2.0",\n "method": "event.get",\n "params": {\n "output": "extend",\n "select_acknowledges": "extend",\n "selectTags": "extend",\n "sortfield": ["clock", "eventid"],\n "sortorder": "DESC",\n "limit": 10\n },\n "auth": "d806c25e68ae49c591b6e0de4f63b854",\n "id": 1\n}' but can't see triggers curl --request POST \ --url http://localhost/zabbix30/api_jsonrpc.php \ --header 'cache-control: no-cache' \ --header 'content-type: application/json' \ --data '{\n "jsonrpc": "2.0",\n "method": "trigger.get",\n "params": {\n "output": "extend",\n "select_acknowledges": "extend",\n "selectTags": "extend",\n "limit": 10\n },\n "auth": "5e5feacab92f9a8f335ba1310be6b4a3",\n "id": 1\n}' EXPECTED RESULT: |
| Comments |
| Comment by Alexander Vladishev [ 2017 Jun 01 ] |
|
Permissions in triggers.get() method works as expected. event.get() and problem.get() methods are fixed with
event.get() method is fixed in:
|
| Comment by Ivo Kurzemnieks [ 2018 Feb 14 ] |
|
(1) No translation string changes. sasha CLOSED |
| Comment by Ivo Kurzemnieks [ 2018 Feb 14 ] |
|
(2) [D] API documentation has no mentions about this. And changelog "fixed permission issue with event.get method" is just too cryptic for any user to understand what has been fixed. I understand that the issue was that event.get (and problem.get) returned events that were generated from triggers that belong to multiple groups and user had permissions to only one group. If that is so, why not write that in changelog and API documentation? sasha WON'T FIX |
[ZBX-11861] Accessing "Events" from a global search result may not show related events Created: 2017 Feb 28 Updated: 2024 Apr 10 Resolved: 2018 Jun 16 |
|
| Status: | Closed |
| Project: | ZABBIX BUGS AND ISSUES |
| Component/s: | Frontend (F) |
| Affects Version/s: | 3.0.7 |
| Fix Version/s: | 3.0.19rc1, 4.0 (plan) |
| Type: | Problem report | Priority: | Minor |
| Reporter: | Marc | Assignee: | Andrejs Griščenko |
| Resolution: | Fixed | Votes: | 0 |
| Labels: | events, filter, globalsearch | ||
| Remaining Estimate: | Not Specified | ||
| Time Spent: | Not Specified | ||
| Original Estimate: | Not Specified | ||
| Team: | |
| Sprint: | Sprint 33, Sprint 34, Sprint 35, Sprint 36 |
| Story Points: | 0.125 |
| Description |
|
When doing a global search for "foo" and then choosing "Events" for a host group "foobar", events are listed for trigger "baz" - for which the filter was manually set before the search. |
| Comments |
| Comment by Andrejs Griščenko [ 2018 May 24 ] |
|
(1) No translation strings changes. Miks.Kronkalns CLOSED |
| Comment by Andrejs Griščenko [ 2018 May 24 ] |
|
Fixed in development branch svn://svn.zabbix.com/branches/dev/ZBX-11861 |
| Comment by Andrejs Griščenko [ 2018 Jun 15 ] |
|
Fixed in 3.0.19rc1 r81939 |
[ZBX-11768] "cannot find open problem events for triggerid" message appears in zabbix_server.log after upgrade to 3.2.2 Created: 2017 Feb 02 Updated: 2024 Apr 10 Resolved: 2017 Nov 22 |
|
| Status: | Closed |
| Project: | ZABBIX BUGS AND ISSUES |
| Component/s: | Server (S) |
| Affects Version/s: | 3.2.2, 3.4.0alpha1 |
| Fix Version/s: | None |
| Type: | Problem report | Priority: | Major |
| Reporter: | Oleksii Zagorskyi | Assignee: | Unassigned |
| Resolution: | Duplicate | Votes: | 3 |
| Labels: | delay, events, problems, proxy, timer | ||
| Remaining Estimate: | Not Specified | ||
| Time Spent: | Not Specified | ||
| Original Estimate: | Not Specified | ||
| Issue Links: |
|
||||||||
| Team: | |
||||||||
| Sprint: | Sprint 14, Sprint 15, Sprint 16, Sprint 17, Sprint 18, Sprint 19, Sprint 20, Sprint 21 | ||||||||
| Story Points: | 0 | ||||||||
| Description |
|
This a a followup of
cannot find open problem events for triggerid:812922, lastchange:1480003403
The |
| Comments |
| Comment by Stefan Priebe [ 2017 Apr 18 ] |
|
I'm running zabbix_server (Zabbix) 3.2.4 and i'm seeing the same issue: |
| Comment by Alexander Vladishev [ 2017 Aug 10 ] |
|
Related issue: |
| Comment by Vladislavs Sokurenko [ 2017 Aug 10 ] |
|
Please zalex_ua next time check if housekeeper was executed between trigger entered into problem state and this message you mention was displayed, also please check if there were any failed queries that could cause history synchronization transaction to fail. As I see in original issue you say
So I believe there is more possibility that it is related to |
| Comment by Vladislavs Sokurenko [ 2017 Nov 22 ] |
|
It has been reported that issue is still present in 3.4.4 so closing as duplicate of |
[ZBX-11705] Global event correlation is broken when using database other than MYSQL Created: 2017 Jan 16 Updated: 2017 May 30 Resolved: 2017 Jan 31 |
|
| Status: | Closed |
| Project: | ZABBIX BUGS AND ISSUES |
| Component/s: | Server (S) |
| Affects Version/s: | 3.2.3 |
| Fix Version/s: | 3.2.4rc1, 3.4.0alpha1 |
| Type: | Incident report | Priority: | Blocker |
| Reporter: | Andris Zeila | Assignee: | Unassigned |
| Resolution: | Fixed | Votes: | 0 |
| Labels: | correlation, events | ||
| Remaining Estimate: | Not Specified | ||
| Time Spent: | Not Specified | ||
| Original Estimate: | Not Specified | ||
| Comments |
| Comment by Andris Zeila [ 2017 Jan 16 ] |
|
Fixed in development branch svn://svn.zabbix.com/branches/dev/ZBX-11705 |
| Comment by Andris Zeila [ 2017 Jan 18 ] |
|
To reproduce the problem create event correlation rule with conditions using old and new events. |
| Comment by Viktors Tjarve [ 2017 Jan 26 ] |
|
Successfully tested with PostgreSQL and Oracle DB. |
| Comment by Andris Zeila [ 2017 Jan 27 ] |
|
Released in:
|
| Comment by richlv [ 2017 Feb 20 ] |
|
(1) nitpicking, but changelog entries follow correct capitalisation for acronyms, names etc - thus "other than mysql" might be worth changing into "other than MySQL" |
[ZBX-11538] "Cannot acknowledge problem: event is not in PROBLEM state. " on page Monitoring->Overview Created: 2016 Nov 29 Updated: 2017 May 30 Resolved: 2017 Mar 07 |
|
| Status: | Closed |
| Project: | ZABBIX BUGS AND ISSUES |
| Component/s: | Frontend (F) |
| Affects Version/s: | 3.2.0 |
| Fix Version/s: | 3.2.4rc1, 3.4.0alpha1 |
| Type: | Incident report | Priority: | Major |
| Reporter: | Gunars Pujats (Inactive) | Assignee: | Unassigned |
| Resolution: | Fixed | Votes: | 0 |
| Labels: | acknowledgements, events | ||
| Remaining Estimate: | Not Specified | ||
| Time Spent: | Not Specified | ||
| Original Estimate: | Not Specified | ||
| Description |
|
"Cannot acknowledge problem: event is not in PROBLEM state. " on pages: |
| Comments |
| Comment by Gunars Pujats (Inactive) [ 2016 Nov 29 ] |
|
Created from |
| Comment by Gunars Pujats (Inactive) [ 2016 Nov 29 ] |
|
(1) No translation strings changed iivs CLOSED |
| Comment by Gunars Pujats (Inactive) [ 2016 Nov 29 ] |
|
RESOLVED in development branch svn://svn.zabbix.com/branches/dev/ZBX-11538 |
| Comment by Ivo Kurzemnieks [ 2016 Dec 12 ] |
|
(2)
gunarspujats RESOLVED in r64419 iivs CLOSED |
| Comment by Ivo Kurzemnieks [ 2016 Dec 12 ] |
|
(3) triggers.inc.php: L2174 The SELECT statement contains acknowledged column, but we can turn acknowledgements off in configuration and then that field becomes redundant. gunarspujats RESOLVED in r64419 iivs CLOSED |
| Comment by Ivo Kurzemnieks [ 2016 Dec 12 ] |
|
(4)
gunarspujats RESOLVED in r64419 iivs CLOSED |
| Comment by Ivo Kurzemnieks [ 2016 Dec 12 ] |
|
(5) Please, check API trigger.get option "selectLastEvent". There is a duplicate piece of code. gunarspujats RESOLVED in r64419 iivs CLOSED |
| Comment by Ivo Kurzemnieks [ 2016 Dec 23 ] |
|
(6) gunarspujats RESOLVED in r64706 iivs CLOSED |
| Comment by Ivo Kurzemnieks [ 2016 Dec 28 ] |
|
TESTED |
| Comment by Gunars Pujats (Inactive) [ 2016 Dec 28 ] |
|
Fixed in:
|
| Comment by Dmitry Verkhoturov [ 2017 Feb 13 ] |
|
Since this change following errors reported. example.org/zabbix/screens.php Undefined index: lastEvent [screens.php:147 → CView->render() → include() → CScreenBuilder->show() → CScreenHostgroupTriggers->get() → make_latest_issues() → make_popup_eventlist() in include/events.inc.php:441] example.org/zabbix/zabbix.php?action=dashboard.view Undefined index: lastEvent [zabbix.php:21 → require_once() → ZBase->run() → ZBase->processRequest() → CView->getOutput() → include() → make_latest_issues() → make_popup_eventlist() in include/events.inc.php:441] Problem introduced in r64769, please, take a look. |
| Comment by Catherine Barry [ 2017 Mar 08 ] |
|
I am running version 3.2.4 and I am getting similar error which is caused by old events that have No events under ACK. For every old event the Undefined index: line is repeated on the dashboard Undefined index: lastEvent [zabbix.php:21 → require_once() → ZBase->run() → ZBase->processRequest() → CView->getOutput() → include() → make_latest_issues() → make_popup_eventlist() in include/events.inc.php:441] |
[ZBX-11454] Force OK events to update trigger value even if there are no open problems Created: 2016 Nov 10 Updated: 2017 May 30 Resolved: 2016 Nov 17 |
|
| Status: | Closed |
| Project: | ZABBIX BUGS AND ISSUES |
| Component/s: | Server (S) |
| Affects Version/s: | 3.2.1 |
| Fix Version/s: | 3.2.2rc1, 3.4.0alpha1 |
| Type: | Incident report | Priority: | Blocker |
| Reporter: | Andris Zeila | Assignee: | Unassigned |
| Resolution: | Fixed | Votes: | 0 |
| Labels: | events, problems | ||
| Remaining Estimate: | Not Specified | ||
| Time Spent: | Not Specified | ||
| Original Estimate: | Not Specified | ||
| Issue Links: |
|
||||||||
| Description |
|
This issue must deal with the situation that occurs due to housekeeper ( There can be situation when trigger is in problem state, but there are no corresponding records in problem table. In this situation no event - recovery event links are generated and trigger value is not updated. 1) when processing normal recovery event (not created by correlation and coming from trigger with correlation_mode none) the trigger value must be updated, even if no event - recovery event links were created |
| Comments |
| Comment by Andris Zeila [ 2016 Nov 10 ] |
|
Fixed in development branch svn://svn.zabbix.com/branches/dev/ZBX-11454 |
| Comment by Sandis Neilands (Inactive) [ 2016 Nov 11 ] |
|
(1) [S] A nasty coding error - it compiles just fine. if (0 != events_num)
DBbegin();
{
flush_events();
update_trigger_changes(&trigger_diff);
DBupdate_itservices(&trigger_diff);
DCconfig_triggers_apply_changes(&trigger_diff);
zbx_save_trigger_changes(&trigger_diff);
DBcommit();
clean_events();
}
RESOLVED in r63736. wiper Thanks, CLOSED |
| Comment by Sandis Neilands (Inactive) [ 2016 Nov 16 ] |
|
Run trough the trigger scenarios (with and without correlation). Didn't notice anything suspicious. Valgrind: OK. |
| Comment by Andris Zeila [ 2016 Nov 16 ] |
|
Released in:
|
| Comment by Oleksii Zagorskyi [ 2016 Nov 24 ] |
|
A nightly build was applied on a production: # egrep "cannot find open problem|Starting" zabbix_server.log 2655:20161124:140043.608 Starting Zabbix Server. Zabbix 3.2.2rc1 (revision 63865). 4337:20161124:140132.379 cannot find open problem events for triggerid:972701, lastchange:1480003260 4301:20161124:140134.650 cannot find open problem events for triggerid:871032, lastchange:1480003276 4261:20161124:140206.925 cannot find open problem events for triggerid:671777, lastchange:1480003324 4248:20161124:140207.028 cannot find open problem events for triggerid:671906, lastchange:1480003326 4329:20161124:140324.585 cannot find open problem events for triggerid:812532, lastchange:1480003403 4329:20161124:140324.587 cannot find open problem events for triggerid:812533, lastchange:1480003403 4329:20161124:140324.587 cannot find open problem events for triggerid:812921, lastchange:1480003403 4329:20161124:140324.587 cannot find open problem events for triggerid:812922, lastchange:1480003403 4307:20161124:140356.794 cannot find open problem events for triggerid:920221, lastchange:1480003434 4256:20161124:140356.915 cannot find open problem events for triggerid:920222, lastchange:1480003434 4256:20161124:140357.482 cannot find open problem events for triggerid:920537, lastchange:1480003435 4256:20161124:140357.482 cannot find open problem events for triggerid:920538, lastchange:1480003435 4243:20161124:150330.949 cannot find open problem events for triggerid:985384, lastchange:1480007010 4243:20161124:150330.949 cannot find open problem events for triggerid:985398, lastchange:1480007010 4306:20161124:153039.766 cannot find open problem events for triggerid:915009, lastchange:1480008638 4346:20161124:153040.773 cannot find open problem events for triggerid:834416, lastchange:1480008640 4346:20161124:153040.773 cannot find open problem events for triggerid:915021, lastchange:1480008639 4278:20161124:153043.688 cannot find open problem events for triggerid:1026144, lastchange:1480008641 4345:20161124:153044.829 cannot find open problem events for triggerid:834429, lastchange:1480008642 4337:20161124:153045.809 cannot find open problem events for triggerid:915107, lastchange:1480008644 4283:20161124:153046.786 cannot find open problem events for triggerid:915119, lastchange:1480008645 4285:20161124:153047.788 cannot find open problem events for triggerid:834455, lastchange:1480008646 4243:20161124:153100.501 cannot find open problem events for triggerid:778145, lastchange:1480008660 4243:20161124:153100.597 cannot find open problem events for triggerid:874614, lastchange:1480008660 4243:20161124:153100.598 cannot find open problem events for triggerid:874640, lastchange:1480008660 4243:20161124:153100.598 cannot find open problem events for triggerid:876273, lastchange:1480008660 4243:20161124:153100.598 cannot find open problem events for triggerid:876285, lastchange:1480008660 4243:20161124:153100.598 cannot find open problem events for triggerid:897745, lastchange:1480008660 4243:20161124:153100.598 cannot find open problem events for triggerid:897759, lastchange:1480008660 4243:20161124:153100.598 cannot find open problem events for triggerid:897786, lastchange:1480008660 4243:20161124:153100.598 cannot find open problem events for triggerid:897800, lastchange:1480008660 4243:20161124:153100.598 cannot find open problem events for triggerid:897827, lastchange:1480008660 4243:20161124:153100.598 cannot find open problem events for triggerid:897841, lastchange:1480008660 4243:20161124:153100.598 cannot find open problem events for triggerid:897868, lastchange:1480008660 4243:20161124:153100.598 cannot find open problem events for triggerid:897882, lastchange:1480008660 4243:20161124:153100.598 cannot find open problem events for triggerid:899382, lastchange:1480008660 4243:20161124:153100.598 cannot find open problem events for triggerid:907612, lastchange:1480008660 4243:20161124:153100.598 cannot find open problem events for triggerid:911774, lastchange:1480008660 4243:20161124:153100.598 cannot find open problem events for triggerid:925282, lastchange:1480008660 4243:20161124:153100.598 cannot find open problem events for triggerid:925294, lastchange:1480008660 4243:20161124:153100.598 cannot find open problem events for triggerid:925306, lastchange:1480008660 4243:20161124:153100.598 cannot find open problem events for triggerid:925318, lastchange:1480008660 4243:20161124:153100.598 cannot find open problem events for triggerid:958031, lastchange:1480008660 4243:20161124:153100.598 cannot find open problem events for triggerid:962547, lastchange:1480008660 4243:20161124:153100.598 cannot find open problem events for triggerid:962561, lastchange:1480008660 4243:20161124:153100.598 cannot find open problem events for triggerid:972715, lastchange:1480008660 4243:20161124:153100.598 cannot find open problem events for triggerid:972729, lastchange:1480008660 4243:20161124:153100.696 cannot find open problem events for triggerid:1088007, lastchange:1480008660 4243:20161124:153331.427 cannot find open problem events for triggerid:915009, lastchange:1480008810 4243:20161124:153331.427 cannot find open problem events for triggerid:915021, lastchange:1480008810 4243:20161124:153400.380 cannot find open problem events for triggerid:897745, lastchange:1480008840 4243:20161124:155707.242 cannot find open problem events for triggerid:834403, lastchange:1480010220
# grep "cannot find open problem" zabbix_server.log | cut -d " " -f10 | sort | uniq -dc
      2 triggerid:897745,
      2 triggerid:915009,
      2 triggerid:915021,
first and last from the filtering: Housekeeper is configured to keep 180 days of trigger events. trying to investigate it, if possible .... |
| Comment by Ram Amar [ 2016 Nov 26 ] |
|
Hi, --rami |
| Comment by Oleksii Zagorskyi [ 2016 Nov 27 ] |
|
@Ram, you can try "Pre-3.2.2rc1 (stable)" taken here http://www.zabbix.com/developers and compile it to workaround, or eliminate negative effect of this issue. |
| Comment by Oleksii Zagorskyi [ 2016 Dec 07 ] |
|
Will post in this issue because it's probable most suitable place for now. For now I see only one pattern where it's still happening - 100% if those hosts are monitored by zabbix proxy, snmp item, 60 seconds interval triggers with nodata(120) (only!) function. grep "cannot find open problem" /opt/logs/zabbix/zabbix_server.log 4243:20161201:174330.684 cannot find open problem events for triggerid:834429, lastchange: 1480621410 4243:20161206:082330.268 cannot find open problem events for triggerid:834429, lastchange: 1481019810 mysql> select *, from_unixtime(clock) from events where objectid=834429 and clock > unix_timestamp('2016-11-22') order by eventid; +-----------+--------+--------+----------+------------+-------+--------------+-----------+----------------------+ | eventid | source | object | objectid | clock | value | acknowledged | ns | from_unixtime(clock) | +-----------+--------+--------+----------+------------+-------+--------------+-----------+----------------------+ | 209905586 | 0 | 0 | 834429 | 1480621380 | 1 | 0 | 524576258 | 2016-12-01 17:43:00 | | 209905638 | 0 | 0 | 834429 | 1480621374 | 0 | 0 | 319742588 | 2016-12-01 17:42:54 | | 209905712 | 0 | 0 | 834429 | 1480621410 | 0 | 0 | 670604958 | 2016-12-01 17:43:30 | -- | 210154215 | 0 | 0 | 834429 | 1481019780 | 1 | 0 | 802815052 | 2016-12-06 08:23:00 | | 210154272 | 0 | 0 | 834429 | 1481019779 | 0 | 0 | 493398486 | 2016-12-06 08:22:59 | | 210154376 | 0 | 0 | 834429 | 1481019810 | 0 | 0 | 72114657 | 2016-12-06 08:23:30 | (pattern is 100% similar for all warning message cases ~600 times for 2 weeks, 100 different triggers, delay between problem and ok - 0-5 seconds)
mysql> select *, from_unixtime(clock) from problem where objectid=834429 and clock > unix_timestamp('2016-12-01') order by eventid;
+-----------+--------+--------+----------+------------+-----------+-----------+------------+-----------+---------------+--------+----------------------+
| eventid   | source | object | objectid | clock      | ns        | r_eventid | r_clock    | r_ns      | correlationid | userid | from_unixtime(clock) |
+-----------+--------+--------+----------+------------+-----------+-----------+------------+-----------+---------------+--------+----------------------+
| 210154215 |      0 |      0 |   834429 | 1481019780 | 802815052 | 210154272 | 1481019779 | 493398486 |          NULL |      0 | 2016-12-06 08:23:00  |
mysql> SELECT er.* FROM event_recovery er JOIN events e ON er.eventid=e.eventid WHERE e.objectid=834429 AND e.clock > unix_timestamp('2016-12-01') ORDER BY er.eventid;
+-----------+-----------+-----------+---------------+--------+
| eventid   | r_eventid | c_eventid | correlationid | userid |
+-----------+-----------+-----------+---------------+--------+
| 210154215 | 210154272 |      NULL |          NULL |   NULL |
(problem recovered 24h ago - already deleted here)
I see it this way: I have much more gathered info but don't want to spam it here all. (the case which was defected before applying current ZBX fix is different - zabbix agent, monitored by server directly, nodata() function. I'm not sure it worth to take it into account. I did my best to try to notice something wrong there, but I could not. Here is debug collected info as is, with notes as is): mysql> select * from problem where objectid = '13678'; <- taken 18.11.2016, now returns empty result
+-----------+--------+--------+----------+------------+-----------+-----------+------------+-----------+---------------+--------+
| eventid | source | object | objectid | clock | ns | r_eventid | r_clock | r_ns | correlationid | userid |
+-----------+--------+--------+----------+------------+-----------+-----------+------------+-----------+---------------+--------+
| 208812111 | 3 | 0 | 13678 | 1479429660 | 229016680 | 208824752 | 1479429960 | 257035687 | NULL | 0 | 2016-11-17 22:41:00.000000
| 208824751 | 0 | 0 | 13678 | 1479429960 | 257035687 | 208827113 | 1479429974 | 850335001 | NULL | 0 | 2016-11-17 22:46:00.000000
+-----------+--------+--------+----------+------------+-----------+-----------+------------+-----------+---------------+--------+
mysql> select * from event_recovery where eventid in (208812111, 208824751, 208824752, 208827113);
+-----------+-----------+-----------+---------------+--------+
| eventid | r_eventid | c_eventid | correlationid | userid |
+-----------+-----------+-----------+---------------+--------+
| 208812111 | 208824752 | NULL | NULL | NULL |
| 208824751 | 208827113 | NULL | NULL | NULL |
+-----------+-----------+-----------+---------------+--------+
mysql> select from_unixtime(e.clock),e.* from events e WHERE objectid = '13678' and clock > unix_timestamp('2016-11-14') and clock < unix_timestamp('2016-11-18') order by eventid ASC LIMIT 20;
+------------------------+-----------+--------+--------+----------+------------+-------+--------------+-----------+
| from_unixtime(e.clock) | eventid | source | object | objectid | clock | value | acknowledged | ns |
+------------------------+-----------+--------+--------+----------+------------+-------+--------------+-----------+
| 2016-11-14 11:22:00 | 208526994 | 3 | 0 | 13678 | 1479129720 | 1 | 0 | 831832815 | unk
| 2016-11-14 11:27:00 | 208539500 | 0 | 0 | 13678 | 1479130020 | 1 | 0 | 873724159 | problem
| 2016-11-14 11:27:00 | 208539501 | 3 | 0 | 13678 | 1479130020 | 0 | 0 | 873724159 | +normal
| 2016-11-14 11:33:30 | 208564220 | 0 | 0 | 13678 | 1479130410 | 0 | 0 | 399919561 | OK - NOT an issue this time
| 2016-11-16 22:07:30 | 208712922 | 3 | 0 | 13678 | 1479341250 | 1 | 0 | 365547597 | unk
| 2016-11-16 22:09:31 | 208716253 | 3 | 0 | 13678 | 1479341371 | 0 | 0 | 190077982 | normal
| 2016-11-17 01:31:00 | 208754642 | 3 | 0 | 13678 | 1479353460 | 1 | 0 | 803560978 | unk
| 2016-11-17 01:31:38 | 208758886 | 3 | 0 | 13678 | 1479353498 | 0 | 0 | 765698080 | normal
| 2016-11-17 22:41:00 | 208812111 | 3 | 0 | 13678 | 1479429660 | 1 | 0 | 229016680 | unk
| 2016-11-17 22:46:00 | 208824751 | 0 | 0 | 13678 | 1479429960 | 1 | 0 | 257035687 | problem
| 2016-11-17 22:46:00 | 208824752 | 3 | 0 | 13678 | 1479429960 | 0 | 0 | 257035687 | +normal
| 2016-11-17 22:46:14 | 208827113 | 0 | 0 | 13678 | 1479429974 | 0 | 0 | 850335001 | OK - IS issue. why this time it's so ???? ....
| 2016-11-17 22:47:00 | 208829078 | 0 | 0 | 13678 | 1479430020 | 0 | 0 | 335871815 |
| 2016-11-17 22:47:30 | 208829577 | 0 | 0 | 13678 | 1479430050 | 0 | 0 | 651707751 |
| 2016-11-17 22:48:00 | 208830175 | 0 | 0 | 13678 | 1479430080 | 0 | 0 | 869772675 |
| 2016-11-17 22:48:30 | 208830621 | 0 | 0 | 13678 | 1479430110 | 0 | 0 | 509568386 |
| 2016-11-17 22:48:57 | 208831014 | 0 | 0 | 13678 | 1479430137 | 0 | 0 | 195234921 |
| 2016-11-17 22:49:00 | 208831030 | 0 | 0 | 13678 | 1479430140 | 0 | 0 | 154315250 |
| 2016-11-17 22:49:30 | 208831275 | 0 | 0 | 13678 | 1479430170 | 0 | 0 | 477458468 |
| 2016-11-17 22:49:49 | 208831610 | 0 | 0 | 13678 | 1479430189 | 0 | 0 | 181722451 |
+------------------------+-----------+--------+--------+----------+------------+-------+--------------+-----------+
mysql> select count(*) from events where eventid between 208812000 and 208829000;
+----------+
| count(*) |
+----------+
| 17001 |
+----------+
|
| Comment by Oleksii Zagorskyi [ 2016 Dec 07 ] |
|
Trying to reproduce it on my test lab ... mysql> select *, from_unixtime(clock) from events; +---------+--------+--------+----------+------------+-------+--------------+-----------+----------------------+ | eventid | source | object | objectid | clock | value | acknowledged | ns | from_unixtime(clock) | +---------+--------+--------+----------+------------+-------+--------------+-----------+----------------------+ | 14 | 0 | 0 | 13570 | 1481107740 | 1 | 0 | 752350548 | 2016-12-07 12:49:00 | | 15 | 0 | 0 | 13570 | 1481107696 | 0 | 0 | 675957485 | 2016-12-07 12:48:16 | | 16 | 0 | 0 | 13570 | 1481111040 | 1 | 0 | 914455965 | 2016-12-07 13:44:00 | | 17 | 0 | 0 | 13570 | 1481110996 | 0 | 0 | 43085330 | 2016-12-07 13:43:16 | | 18 | 0 | 0 | 13570 | 1481111220 | 1 | 0 | 940446042 | 2016-12-07 13:47:00 | | 19 | 0 | 0 | 13570 | 1481111176 | 0 | 0 | 65400030 | 2016-12-07 13:46:16 | mysql> select *, from_unixtime(clock) from problem; +---------+--------+--------+----------+------------+-----------+-----------+------------+-----------+---------------+--------+----------------------+ | eventid | source | object | objectid | clock | ns | r_eventid | r_clock | r_ns | correlationid | userid | from_unixtime(clock) | +---------+--------+--------+----------+------------+-----------+-----------+------------+-----------+---------------+--------+----------------------+ | 14 | 0 | 0 | 13570 | 1481107740 | 752350548 | 15 | 1481107696 | 675957485 | NULL | 0 | 2016-12-07 12:49:00 | | 16 | 0 | 0 | 13570 | 1481111040 | 914455965 | 17 | 1481110996 | 43085330 | NULL | 0 | 2016-12-07 13:44:00 | | 18 | 0 | 0 | 13570 | 1481111220 | 940446042 | 19 | 1481111176 | 65400030 | NULL | 0 | 2016-12-07 13:47:00 | so I cannot reproduce it yet. More details about production: on the active proxy pollers spike to 100% every 10 minutes (big snmp devices are monitored there) and these spikes are exactly related to values gathered sometimes not at scheduled(calculated) time. Sometimes the delay is more than 60 seconds so single value is even skipped. Any idea how to troubleshoot this issue further ? |
| Comment by Andris Zeila [ 2016 Dec 07 ] |
|
No, currently I have no ideas. I have been reviewing/testing the code, but cannot see how it could happen (except the obvious case when events are removed). Just to clarify - there are no event correlation used or custom patches (disabling trigger locking in configuration cache) used ? |
| Comment by Oleksii Zagorskyi [ 2016 Dec 07 ] |
|
No, "events correlation" feature is not used at all yet. Basically 3.2 is running as is after upgrade from 3.0. |
| Comment by Oleksii Zagorskyi [ 2016 Dec 12 ] |
|
Update: decreasing syncers to 8, NVPS is 3,5K, syncers are ~6% busy. |
| Comment by Andris Zeila [ 2016 Dec 13 ] |
|
Just a note - it would be better to continue discussion and posting new findings in |
| Comment by Oleksii Zagorskyi [ 2017 Feb 02 ] |
|
|
[ZBX-11439] 3.2 server could not close PROBLEM events Created: 2016 Nov 08 Updated: 2017 May 30 Resolved: 2017 Feb 06 |
|
| Status: | Closed |
| Project: | ZABBIX BUGS AND ISSUES |
| Component/s: | Server (S) |
| Affects Version/s: | 3.2.1 |
| Fix Version/s: | None |
| Type: | Incident report | Priority: | Critical |
| Reporter: | Oleksii Zagorskyi | Assignee: | Unassigned |
| Resolution: | Duplicate | Votes: | 4 |
| Labels: | events, problems | ||
| Remaining Estimate: | Not Specified | ||
| Time Spent: | Not Specified | ||
| Original Estimate: | Not Specified | ||
| Issue Links: |
|
||||||||||||||||||||||||
| Description |
|
Our server upgraded to 3.2.0 a month ago and a few days ago we got an issue. During the issue we upgraded to 3.2.1 but it did not help. We use GTID-based master-master replication on MySQL. (mysql Ver 15.1 Distrib 10.0.25-MariaDB, for Linux (x86_64) using readline 5.1) During investigation it gets clear that many triggers are in PROBLEM state (value=1 in "triggers") generate OK events each time when get new value or when being recalculated by timer. The picture looks this way - if you visit Problems page - you see nothing bad, i.e you see nothing, in any view mode. Difference in debug log:
 17023:20161108:153349.436 End of DCget_nextid() table:'events' [96:95]
 17023:20161108:153349.436 query [txnlev:1] [insert into events (eventid,source,object,objectid,clock,ns,value) values (95,0,0,13569,1478612028,511579021,0);
]
 17023:20161108:153349.436 In process_actions() events_num:1
 17023:20161108:153349.436 In zbx_dc_get_actions_eval()
 17023:20161108:153349.436 End of zbx_dc_get_actions_eval() actions:1
 17023:20161108:153349.436 End of process_actions()
 17023:20161108:153349.436 In DBupdate_itservices()
 17023:20161108:153349.436 End of DBupdate_itservices():SUCCEED
 17023:20161108:153349.436 End of process_trigger_events() processed:1
 17023:20161108:153349.436 In zbx_save_trigger_changes()
 17023:20161108:153349.436 query [txnlev:1] [update triggers set lastchange=1478612028 where triggerid=13569;
]
another, not affected zabbix: 6242:20161108:103022.270 End of DCget_nextid() table:'events' [85:84] 6242:20161108:103022.270 query [txnlev:1] [insert into events (eventid,source,object,objectid,clock,ns,value) values (84,0,0,13569,1478593821,591608632,0); ] 6242:20161108:103022.271 query [txnlev:1] [insert into event_recovery (eventid,r_eventid,correlationid,c_eventid,userid) values (83,84,null,null,null); ] 6242:20161108:103022.271 query [txnlev:1] [update problem set r_eventid=84,r_clock=1478593821,r_ns=591608632,userid=0 where eventid=83; ] 6242:20161108:103022.272 In process_actions() events_num:1 6242:20161108:103022.272 In zbx_dc_get_actions_eval() 6242:20161108:103022.272 End of zbx_dc_get_actions_eval() actions:1 6242:20161108:103022.272 query [txnlev:1] [select actionid,eventid,escalationid from escalations where eventid=83] 6242:20161108:103022.272 query [txnlev:1] [update escalations set r_eventid=84 where escalationid=1; ] We resolved the issue using this direct SQL: update triggers set value=0 where value=1 and triggerid not in (select distinct objectid from problem); Question why this issue appeared is still opened, but I think about 2 points: This issue is somehow similar to Below is some collected information, just in case: MariaDB [zabbix]> SELECT *, FROM_UNIXTIME(clock) FROM events WHERE objectid=129403 AND clock>=unix_timestamp('2016-11-08 09:55:00') AND clock<=unix_timestamp('2016-11-08 10:00:00') ORDER BY clock DESC;
+-----------+--------+--------+----------+------------+-------+--------------+-----------+----------------------+
| eventid | source | object | objectid | clock | value | acknowledged | ns | FROM_UNIXTIME(clock) |
+-----------+--------+--------+----------+------------+-------+--------------+-----------+----------------------+
| 279907078 | 0 | 0 | 129403 | 1478595600 | 0 | 0 | 26280341 | 2016-11-08 10:00:00 |
| 279906763 | 0 | 0 | 129403 | 1478595574 | 0 | 0 | 6126234 | 2016-11-08 09:59:34 |
| 279906657 | 0 | 0 | 129403 | 1478595570 | 0 | 0 | 977226025 | 2016-11-08 09:59:30 |
| 279906092 | 0 | 0 | 129403 | 1478595544 | 0 | 0 | 993842012 | 2016-11-08 09:59:04 |
...
| 279901329 | 0 | 0 | 129403 | 1478595334 | 0 | 0 | 65403047 | 2016-11-08 09:55:34 |
| 279900981 | 0 | 0 | 129403 | 1478595330 | 0 | 0 | 249855840 | 2016-11-08 09:55:30 |
| 279900642 | 0 | 0 | 129403 | 1478595304 | 0 | 0 | 64580586 | 2016-11-08 09:55:04 |
| 279900299 | 0 | 0 | 129403 | 1478595300 | 0 | 0 | 438725918 | 2016-11-08 09:55:00 |
+-----------+--------+--------+----------+------------+-------+--------------+-----------+----------------------+
MariaDB [zabbix]> select * from triggers where triggerid=129403\G
*************************** 1. row ***************************
          triggerid: 129403
         expression: {321462}=0 or {321463}=1
        description: ESXi is unreachable
                url: http://some
             status: 0
              value: 1
           priority: 5
         lastchange: 1478601964
           comments:
              error:
         templateid: 129305
               type: 0
              state: 0
              flags: 0
      recovery_mode: 0
recovery_expression:
   correlation_mode: 0
    correlation_tag:
       manual_close: 1
1 row in set (0.00 sec)
MariaDB [zabbix]> SELECT DATE(FROM_UNIXTIME(p.clock)) AS date, HOUR(FROM_UNIXTIME(p.clock)) AS hour, p.source, count(*) FROM problem p JOIN triggers t ON p.objectid = t.triggerid WHERE p.object='0' AND p.source='0' AND p.clock>=unix_timestamp('2016-11-01 00:00:00') AND p.clock<=unix_timestamp('2016-11-08 18:00:00') GROUP BY 1,2,3 ORDER BY p.clock DESC,p.eventid DESC;
+------------+------+--------+----------+
| date       | hour | source | count(*) |
+------------+------+--------+----------+
| 2016-11-08 |   10 |      0 |      160 |
| 2016-11-08 |    9 |      0 |      280 |
...
| 2016-11-07 |   11 |      0 |      392 |
| 2016-11-07 |   10 |      0 |      431 |
| 2016-11-07 |    9 |      0 |      104 |
| 2016-11-07 |    8 |      0 |       60 |
| 2016-11-07 |    7 |      0 |       61 |
| 2016-11-07 |    6 |      0 |       61 |
| 2016-11-07 |    5 |      0 |       60 |
...
| 2016-11-06 |    9 |      0 |       60 |
| 2016-11-06 |    8 |      0 |       60 |
| 2016-11-06 |    7 |      0 |       61 |
| 2016-11-06 |    6 |      0 |       60 |
| 2016-11-06 |    5 |      0 |       60 |
| 2016-11-06 |    4 |      0 |       46 |
| 2016-11-05 |   22 |      0 |        1 |
| 2016-11-05 |   14 |      0 |        1 |
| 2016-11-05 |    6 |      0 |        1 |
| 2016-11-05 |    2 |      0 |        1 |
...
| 2016-11-03 |   11 |      0 |        1 |
| 2016-11-03 |    9 |      0 |        1 |
| 2016-11-02 |   21 |      0 |        2 |
| 2016-11-02 |   16 |      0 |        1 |
| 2016-11-01 |    9 |      0 |        1 |
+------------+------+--------+----------+
MariaDB [zabbix]> SELECT DATE(FROM_UNIXTIME(e.clock)) AS date, HOUR(FROM_UNIXTIME(e.clock)) AS hour, e.source, count(*) FROM events e JOIN triggers t ON e.objectid = t.triggerid WHERE e.object='0' AND e.source='0' AND e.clock>=unix_timestamp('2016-11-01 00:00:00') AND e.clock<=unix_timestamp('2016-11-08 18:00:00') GROUP BY 1,2,3 ORDER BY e.clock DESC,e.eventid DESC;
+------------+------+--------+----------+
| date       | hour | source | count(*) |
+------------+------+--------+----------+
| 2016-11-08 |   10 |      0 |    46782 |
| 2016-11-08 |    9 |      0 |    72477 |
| 2016-11-08 |    8 |      0 |    72392 |
| 2016-11-08 |    7 |      0 |    72258 |
...
| 2016-11-04 |   13 |      0 |    53050 |
| 2016-11-04 |   12 |      0 |    53467 |
| 2016-11-04 |   11 |      0 |    53062 |
| 2016-11-04 |   10 |      0 |    38379 |
| 2016-11-04 |    9 |      0 |     3502 |
| 2016-11-04 |    8 |      0 |      510 |
| 2016-11-04 |    7 |      0 |      424 |
| 2016-11-04 |    6 |      0 |      325 |
...
| 2016-11-03 |   19 |      0 |      447 |
| 2016-11-03 |   18 |      0 |      515 |
| 2016-11-03 |   17 |      0 |      531 |
+------------+------+--------+----------+
MariaDB [zabbix]> select from_unixtime(min(clock)) from problem;
+---------------------------+
| from_unixtime(min(clock)) |
+---------------------------+
| 2015-11-09 13:47:09       |
+---------------------------+
MariaDB [zabbix]> select from_unixtime(min(clock)) from events where objectid=129403; +---------------------------+ | from_unixtime(min(clock)) | +---------------------------+ | 2016-02-17 15:19:04 | +---------------------------+ MariaDB [zabbix]> select count(*) from problem where objectid=129403; +----------+ | count(*) | +----------+ | 0 | +----------+ MariaDB [zabbix]> select count(*) from triggers where value=1 and triggerid not in (select distinct objectid from events); +----------+ | count(*) | +----------+ | 573 | +----------+ MariaDB [zabbix]> select count(*) from triggers where value=1 and triggerid not in (select distinct objectid from events where source=0 and value=1); +----------+ | count(*) | +----------+ | 577 | +----------+ MariaDB [zabbix]> update triggers set value=0 where value=1 and triggerid not in (select distinct objectid from problem); Query OK, 887 rows affected (1 min 36.75 sec) Rows matched: 887 Changed: 887 Warnings: 0 MariaDB [zabbix]> select description, from_unixtime(lastchange) from triggers where value=1 and triggerid not in (select distinct objectid from events); Empty set (2.70 sec) |
| Comments |
| Comment by Aleksandrs Saveljevs [ 2016 Nov 08 ] |
|
zalex_ua It's duplicate of current issue. |
| Comment by Andris Zeila [ 2016 Nov 10 ] |
|
|
| Comment by Oleksii Zagorskyi [ 2016 Nov 11 ] |
|
Got it reproduced accidentally on my home raspberry pi with NVPS ~1. PROBLEM event for the trigger is missing: select *, from_unixtime(clock) from events where objectid=13625; ... | 5042 | 0 | 0 | 13625 | 1478433621 | 0 | 0 | 409672413 | 2016-11-06 14:00:21 | | 5092 | 0 | 0 | 13625 | 1478804421 | 0 | 0 | 950535274 | 2016-11-10 21:00:21 | | 5094 | 0 | 0 | 13625 | 1478804481 | 0 | 0 | 822419357 | 2016-11-10 21:01:21 | | 5095 | 0 | 0 | 13625 | 1478804541 | 0 | 0 | 875781585 | 2016-11-10 21:02:21 | | 5096 | 0 | 0 | 13625 | 1478804601 | 0 | 0 | 276318916 | 2016-11-10 21:03:21 | | 5097 | 0 | 0 | 13625 | 1478804661 | 0 | 0 | 228924257 | 2016-11-10 21:04:21 | | 5098 | 0 | 0 | 13625 | 1478804721 | 0 | 0 | 499307034 | 2016-11-10 21:05:21 | | 5099 | 0 | 0 | 13625 | 1478804781 | 0 | 0 | 146053814 | 2016-11-10 21:06:21 | | 5100 | 0 | 0 | 13625 | 1478804841 | 0 | 0 | 257003020 | 2016-11-10 21:07:21 | | 5101 | 0 | 0 | 13625 | 1478804901 | 0 | 0 | 865698839 | 2016-11-10 21:08:21 | | 5102 | 0 | 0 | 13625 | 1478804961 | 0 | 0 | 328427889 | 2016-11-10 21:09:21 | ... problem record is missing too: mysql> select *, from_unixtime(clock) from problem where objectid=13625; Empty set (0.01 sec) trigger, item settings:
mysql> select triggerid, expression, from_unixtime(lastchange) from triggers where value=1 and triggerid not in (select distinct objectid from problem);
+-----------+------------+---------------------------+
| triggerid | expression | from_unixtime(lastchange) |
+-----------+------------+---------------------------+
|     13625 | {13238}=0  | 2016-11-11 00:55:21       |
+-----------+------------+---------------------------+
1 row in set (0.01 sec)
mysql> select * from functions where functionid=13238;
+------------+--------+-----------+----------+-----------+
| functionid | itemid | triggerid | function | parameter |
+------------+--------+-----------+----------+-----------+
|      13238 |  24141 |     13625 | last     |           |
+------------+--------+-----------+----------+-----------+
1 row in set (0.01 sec)
mysql> select * from items where itemid=24141\G
*************************** 1. row ***************************
               itemid: 24141
                 type: 0
       snmp_community:
             snmp_oid:
               hostid: 10113
                 name: Number of "$1"  processes running
                 key_: proc.num[znc]
                delay: 60
              history: 3
               trends: 7
               status: 0
           value_type: 3
        trapper_hosts:
                units:
           multiplier: 0
                delta: 0
  snmpv3_securityname:
 snmpv3_securitylevel: 0
snmpv3_authpassphrase:
snmpv3_privpassphrase:
              formula: 1
                error:
          lastlogsize: 0
           logtimefmt:
           templateid: NULL
           valuemapid: NULL
           delay_flex:
               params:
          ipmi_sensor:
            data_type: 0
             authtype: 0
             username:
             password:
            publickey:
           privatekey:
                mtime: 0
                flags: 0
          interfaceid: 10
                 port:
          description:
       inventory_link: 0
             lifetime: 30
  snmpv3_authprotocol: 0
  snmpv3_privprotocol: 0
                state: 0
   snmpv3_contextname:
             evaltype: 0
1 row in set (0.00 sec)
server log before and after: 1308:20161110:153703.248 executing housekeeper 1308:20161110:153723.456 housekeeper [deleted 487 hist/trends, 0 items, 0 events, 0 problems, 0 sessions, 0 alarms, 0 audit items in 20.204430 sec, idle for 1 hour(s)] 1308:20161110:163724.249 executing housekeeper 1308:20161110:163743.647 housekeeper [deleted 489 hist/trends, 0 items, 0 events, 0 problems, 0 sessions, 0 alarms, 0 audit items in 19.394272 sec, idle for 1 hour(s)] 1308:20161110:173744.283 executing housekeeper 1308:20161110:173750.671 housekeeper [deleted 487 hist/trends, 0 items, 0 events, 0 problems, 0 sessions, 0 alarms, 0 audit items in 6.383478 sec, idle for 1 hour(s)] 1308:20161110:183751.335 executing housekeeper 1308:20161110:183816.057 housekeeper [deleted 487 hist/trends, 0 items, 0 events, 0 problems, 0 sessions, 0 alarms, 0 audit items in 24.718003 sec, idle for 1 hour(s)] 1315:20161110:195019.151 item "Hikvision:hikvision[storage,status]" became supported 1315:20161110:200019.514 item "Hikvision:hikvision[storage,capacity]" became supported 1315:20161110:200023.446 item "Hikvision:hikvision[storage,freeSpace]" became supported >>>> POWER LOSS HERE <<<<<< 750:19700101:030024.246 Starting Zabbix Server. Zabbix 3.3.0 (revision 63524). 750:19700101:030024.304 ****** Enabled features ****** 750:19700101:030024.304 SNMP monitoring: YES 750:19700101:030024.304 IPMI monitoring: YES 750:19700101:030024.305 Web monitoring: YES 750:19700101:030024.305 VMware monitoring: YES 750:19700101:030024.306 SMTP authentication: YES 750:19700101:030024.306 Jabber notifications: YES 750:19700101:030024.306 Ez Texting notifications: YES 750:19700101:030024.307 ODBC: YES 750:19700101:030024.307 SSH2 support: YES 750:19700101:030024.307 IPv6 support: YES 750:19700101:030024.308 TLS support: NO 750:19700101:030024.308 ****************************** 750:19700101:030024.309 using configuration file: /etc/zabbix/zabbix_server.conf 750:19700101:030024.418 [Z3001] connection to database 'trunk' failed: [2002] Can't connect to local MySQL server through socket '/var/run/mysqld/mysqld.sock' (2) 750:19700101:030024.575 database is down: reconnecting in 10 seconds 750:19700101:030034.601 [Z3001] connection to database 'trunk' failed: [2002] Can't connect to local MySQL server through socket '/var/run/mysqld/mysqld.sock' (2) 750:19700101:030034.782 database is down: reconnecting in 10 seconds 750:19700101:030044.804 database connection re-established 750:19700101:030044.875 current database version (mandatory/optional): 03030011/03030011 750:19700101:030044.876 required mandatory version: 03030011 750:19700101:030045.486 server #0 started [main process] 1301:19700101:030045.507 server #1 started [configuration syncer #1] 1302:19700101:030045.511 server #2 started [db watchdog #1] 1303:19700101:030045.525 server #3 started [poller #1] 1304:19700101:030045.548 server #4 started [unreachable poller #1] 1306:19700101:030045.555 server #5 started [trapper #1] 1307:19700101:030045.629 server #6 started [icmp pinger #1] 1309:19700101:030045.685 server #7 started [alerter #1] 1312:19700101:030045.749 server #9 started [timer #1] 1311:19700101:030045.784 server #8 started [housekeeper #1] 1313:19700101:030045.819 server #10 started [http poller #1] 1314:19700101:030045.861 server #11 started [discoverer #1] 1317:19700101:030045.869 server #12 started [history syncer #1] 1320:19700101:030045.952 server #13 started [escalator #1] 1323:19700101:030046.019 server #14 started [self-monitoring #1] 1324:19700101:030046.055 server #15 started [task manager #1] 1317:20161110:201422.488 item "trim became not supported: Timeout while executing a shell script. 1317:20161110:201517.281 item "trim" became supported 1311:20161110:204245.780 executing housekeeper 1311:20161110:204349.036 housekeeper [deleted 35212 hist/trends, 0 items, 17 events, 0 problems, 0 sessions, 0 alarms, 0 audit items in 63.250406 sec, idle for 1 hour(s)] 1320:20161110:204358.446 escalation cancelled: event id:5083 deleted. 1311:20161110:214349.682 executing housekeeper 1311:20161110:214419.415 housekeeper [deleted 1991 hist/trends, 0 items, 4 events, 0 problems, 0 sessions, 0 alarms, 0 audit items in 29.728824 sec, idle for 1 hour(s)] 1311:20161110:224420.104 executing housekeeper 1311:20161110:224436.646 housekeeper [deleted 1991 hist/trends, 0 items, 0 events, 0 problems, 0 sessions, 0 alarms, 0 audit items in 16.538540 sec, idle for 1 hour(s)] 1311:20161110:234437.439 executing housekeeper 1311:20161110:234452.312 housekeeper [deleted 2003 hist/trends, 0 items, 0 events, 0 problems, 0 sessions, 0 alarms, 0 audit items in 14.868972 sec, idle for 1 hour(s)] 1311:20161111:004453.004 executing housekeeper 1311:20161111:004500.611 housekeeper [deleted 885 hist/trends, 0 items, 0 events, 1 problems, 0 sessions, 0 alarms, 0 audit items in 7.602953 sec, idle for 1 hour(s)] 750:20161111:005842.912 Got signal [signal:15(SIGTERM),sender_pid:23345,sender_uid:0,reason:0]. Exiting ... 750:20161111:005845.026 syncing history data... 750:20161111:005845.027 syncing history data done 750:20161111:005845.027 syncing trend data... 750:20161111:005845.081 syncing trend data done 750:20161111:005845.083 Zabbix Server stopped. Zabbix 3.3.0 (revision 63524). >>>> the trigger value manually fixed here, server started <<<<<<<< 23362:20161111:012846.181 executing housekeeper 23362:20161111:012948.102 housekeeper [deleted 11367 hist/trends, 746 items, 0 events, 0 problems, 0 sessions, 0 alarms, 0 audit items in 61.916295 sec, idle for 1 hour(s)] 23362:20161111:022948.845 executing housekeeper 23362:20161111:023035.515 housekeeper [deleted 11613 hist/trends, 0 items, 0 events, 0 problems, 0 sessions, 0 alarms, 0 audit items in 46.665632 sec, idle for 1 hour(s)] 23362:20161111:033036.249 executing housekeeper 23362:20161111:033119.040 housekeeper [deleted 11623 hist/trends, 0 items, 0 events, 0 problems, 0 sessions, 0 alarms, 0 audit items in 42.786623 sec, idle for 1 hour(s)] 23362:20161111:043119.895 executing housekeeper 23362:20161111:043157.343 housekeeper [deleted 11605 hist/trends, 0 items, 0 events, 0 problems, 0 sessions, 0 alarms, 0 audit items in 37.444627 sec, idle for 1 hour(s)] 23362:20161111:053157.964 executing housekeeper 23362:20161111:053316.655 housekeeper [deleted 11598 hist/trends, 0 items, 0 events, 0 problems, 0 sessions, 0 alarms, 0 audit items in 78.687485 sec, idle for 1 hour(s)] number of deleted history before/in/after restart, hmmm, while NVPS is very stable =1.02 and all items have full history/trends .... strange ... the item history: mysql> select *, from_unixtime(clock) from history_uint where itemid=24141 and clock > unix_timestamp('2016-11-10 19:56:00') and clock < unix_timestamp('2016-11-10 21:03:00') order by clock asc;
+--------+------------+-------+-----------+----------------------+
| itemid | clock | value | ns | from_unixtime(clock) |
+--------+------------+-------+-----------+----------------------+
| 24141 | 1478800581 | 1 | 796263667 | 2016-11-10 19:56:21 |
| 24141 | 1478800641 | 1 | 433648777 | 2016-11-10 19:57:21 |
| 24141 | 1478800701 | 1 | 594466441 | 2016-11-10 19:58:21 |
| 24141 | 1478800762 | 1 | 215624657 | 2016-11-10 19:59:22 |
| 24141 | 1478800821 | 1 | 404095308 | 2016-11-10 20:00:21 |
| 24141 | 1478801638 | 0 | 117522365 | 2016-11-10 20:13:58 |
| 24141 | 1478801664 | 0 | 897324614 | 2016-11-10 20:14:24 |
| 24141 | 1478801721 | 0 | 693859126 | 2016-11-10 20:15:21 |
| 24141 | 1478801781 | 0 | 864936317 | 2016-11-10 20:16:21 |
trim
| 24141 | 1478804181 | 0 | 904726744 | 2016-11-10 20:56:21 |
| 24141 | 1478804241 | 0 | 984643395 | 2016-11-10 20:57:21 |
| 24141 | 1478804301 | 0 | 355551816 | 2016-11-10 20:58:21 |
| 24141 | 1478804363 | 0 | 112497073 | 2016-11-10 20:59:23 |
| 24141 | 1478804421 | 1 | 950535274 | 2016-11-10 21:00:21 |
| 24141 | 1478804481 | 1 | 822419357 | 2016-11-10 21:01:21 |
| 24141 | 1478804541 | 1 | 875781585 | 2016-11-10 21:02:21 |
+--------+------------+-------+-----------+----------------------+
55 rows in set (0.01 sec)
syslog: Jan 1 03:00:34 kot2 mysqld: 700101 3:00:34 [Warning] Using unique option prefix myisam-recover instead of myisam-recover-options is deprecated and will be removed in a future release. Please use the full name instead. Jan 1 03:00:35 kot2 mysqld: 700101 3:00:35 [Note] Plugin 'FEDERATED' is disabled. Jan 1 03:00:35 kot2 mysqld: 700101 3:00:35 InnoDB: The InnoDB memory heap is disabled Jan 1 03:00:35 kot2 mysqld: 700101 3:00:35 InnoDB: Mutexes and rw_locks use GCC atomic builtins Jan 1 03:00:35 kot2 mysqld: 700101 3:00:35 InnoDB: Compressed tables use zlib 1.2.8 Jan 1 03:00:35 kot2 mysqld: 700101 3:00:35 InnoDB: Using Linux native AIO Jan 1 03:00:35 kot2 mysqld: 700101 3:00:35 InnoDB: Initializing buffer pool, size = 128.0M Jan 1 03:00:35 kot2 mysqld: 700101 3:00:35 InnoDB: Completed initialization of buffer pool Jan 1 03:00:35 kot2 mysqld: 700101 3:00:35 InnoDB: highest supported file format is Barracuda. Jan 1 03:00:35 kot2 mysqld: InnoDB: Log scan progressed past the checkpoint lsn 30017775804 Jan 1 03:00:35 kot2 mysqld: 700101 3:00:35 InnoDB: Database was not shut down normally! Jan 1 03:00:35 kot2 mysqld: InnoDB: Starting crash recovery. Jan 1 03:00:35 kot2 mysqld: InnoDB: Reading tablespace information from the .ibd files... Jan 1 03:00:35 kot2 mysqld: InnoDB: Restoring possible half-written data pages from the doublewrite Jan 1 03:00:35 kot2 mysqld: InnoDB: buffer... Jan 1 03:00:36 kot2 mysqld: InnoDB: Doing recovery: scanned up to log sequence number 30017777223 Jan 1 03:00:37 kot2 mysqld: 700101 3:00:37 InnoDB: Starting an apply batch of log records to the database... Jan 1 03:00:37 kot2 mysqld: InnoDB: Progress in percents: 29 30 31 32 33 34 35 36 37 38 39 40 41 42 43 44 45 46 47 48 49 50 51 52 53 54 55 56 57 58 59 60 61 62 63 64 65 66 67 68 69 70 71 72 73 74 75 76 77 78 79 80 81 82 83 84 85 86 87 88 89 90 91 92 93 94 95 96 97 98 99 Jan 1 03:00:37 kot2 mysqld: InnoDB: Apply batch completed Jan 1 03:00:37 kot2 mysqld: 700101 3:00:37 InnoDB: Waiting for the background threads to start Jan 1 03:00:37 kot2 kernel: [ 37.888198] cfg80211: Calling CRDA to update world regulatory domain Jan 1 03:00:38 kot2 mysqld: 700101 3:00:38 InnoDB: 5.5.52 started; log sequence number 30017777223 Jan 1 03:00:38 kot2 mysqld: 700101 3:00:38 [Note] Server hostname (bind-address): '0.0.0.0'; port: 3306 Jan 1 03:00:38 kot2 mysqld: 700101 3:00:38 [Note] - '0.0.0.0' resolves to '0.0.0.0'; Jan 1 03:00:38 kot2 mysqld: 700101 3:00:38 [Note] Server socket created on IP: '0.0.0.0'. Jan 1 03:00:39 kot2 mysqld: 700101 3:00:39 [Note] Event Scheduler: Loaded 0 events Jan 1 03:00:39 kot2 mysqld: 700101 3:00:39 [Note] /usr/sbin/mysqld: ready for connections. Jan 1 03:00:39 kot2 mysqld: Version: '5.5.52-0+deb8u1' socket: '/var/run/mysqld/mysqld.sock' port: 3306 (Raspbian) Jan 1 03:00:40 kot2 mysql[402]: Starting MySQL database server: mysqld . . . . . . . . .. Jan 1 03:00:40 kot2 mysql[402]: Checking for tables which need an upgrade, are corrupt or were Jan 1 03:00:40 kot2 systemd[1]: Started LSB: Start and stop the mysql database server daemon. Jan 1 03:00:40 kot2 mysql[402]: not closed cleanly.. Jan 1 03:00:40 kot2 systemd[1]: Starting Multi-User System. Jan 1 03:00:40 kot2 systemd[1]: Reached target Multi-User System. Jan 1 03:00:40 kot2 systemd[1]: Starting Graphical Interface. Jan 1 03:00:40 kot2 systemd[1]: Reached target Graphical Interface. Jan 1 03:00:40 kot2 systemd[1]: Starting Update UTMP about System Runlevel Changes... Jan 1 03:00:40 kot2 /etc/mysql/debian-start[1258]: Upgrading MySQL tables if necessary. Jan 1 03:00:40 kot2 systemd[1]: Started Update UTMP about System Runlevel Changes. Jan 1 03:00:40 kot2 systemd[1]: Startup finished in 2.514s (kernel) + 38.023s (userspace) = 40.538s. Jan 1 03:00:40 kot2 kernel: [ 41.048227] cfg80211: Calling CRDA to update world regulatory domain Jan 1 03:00:41 kot2 /etc/mysql/debian-start[1265]: /usr/bin/mysql_upgrade: the '--basedir' option is always ignored Jan 1 03:00:41 kot2 /etc/mysql/debian-start[1265]: Looking for 'mysql' as: /usr/bin/mysql Jan 1 03:00:41 kot2 /etc/mysql/debian-start[1265]: Looking for 'mysqlcheck' as: /usr/bin/mysqlcheck Jan 1 03:00:41 kot2 /etc/mysql/debian-start[1265]: This installation of MySQL is already upgraded to 5.5.52, use --force if you still need to run mysql_upgrade Jan 1 03:00:41 kot2 /etc/mysql/debian-start[1277]: Checking for insecure root accounts. Jan 1 03:00:41 kot2 /etc/mysql/debian-start[1282]: WARNING: mysql.user contains 4 root accounts without password! Jan 1 03:00:41 kot2 /etc/mysql/debian-start[1283]: Triggering myisam-recover for all MyISAM tables Jan 1 03:00:43 kot2 ntpd_intres[469]: host name not found: 1.debian.pool.ntp.org Jan 1 03:00:43 kot2 ntpd_intres[469]: DNS 2.debian.pool.ntp.org -> 195.138.82.247 Jan 1 03:00:43 kot2 ntpd_intres[469]: DNS 3.debian.pool.ntp.org -> 78.154.163.166 Jan 1 03:00:44 kot2 kernel: [ 44.208998] cfg80211: Calling CRDA to update world regulatory domain Jan 1 03:00:47 kot2 kernel: [ 47.368453] cfg80211: Calling CRDA to update world regulatory domain Jan 1 03:00:50 kot2 kernel: [ 50.528469] cfg80211: Calling CRDA to update world regulatory domain Jan 1 03:00:53 kot2 kernel: [ 53.688559] cfg80211: Exceeded CRDA call max attempts. Not calling CRDA Nov 10 20:13:56 kot2 systemd[1]: Time has been changed This case could be more close to already mentioned I had another power lost today, but the trigger recovered to OK before first housekeeper activity, so our "problem" did not appear. |
| Comment by Dawid Mos [ 2016 Dec 06 ] |
|
Same issue here, but it wasn't preceded by any system or hardware crash. Temporary solved by UPDATE listed above, but I did it already two times and it happens again, so it looks like a bug. |
| Comment by Pradeep Patil [ 2016 Dec 21 ] |
|
Hello, Since it is not sending "OK" alert I believe Actions also will not happen for these events right? |
| Comment by Oleksii Zagorskyi [ 2016 Dec 22 ] |
|
Pradeep, hmm, didn't pay attention as for alerts of such OK events. I cannot recall them in my real case. |
| Comment by Oleksii Zagorskyi [ 2017 Jan 23 ] |
|
I think that we need to close this one as duplicate of |
| Comment by Alexander Vladishev [ 2017 Feb 06 ] |
|
Closed as duplicate of |
[ZBX-11435] Date on datepicker always go to "now" after switch page Created: 2016 Nov 07 Updated: 2017 May 30 Resolved: 2016 Nov 08 |
|
| Status: | Closed |
| Project: | ZABBIX BUGS AND ISSUES |
| Component/s: | Frontend (F) |
| Affects Version/s: | 3.0.4 |
| Fix Version/s: | None |
| Type: | Incident report | Priority: | Major |
| Reporter: | Joao Juvenal Vitorino Junior | Assignee: | Unassigned |
| Resolution: | Duplicate | Votes: | 0 |
| Labels: | date, events, frontend, usability | ||
| Remaining Estimate: | Not Specified | ||
| Time Spent: | Not Specified | ||
| Original Estimate: | Not Specified | ||
| Environment: |
OS: ORacle Linux 7, Apache 2.4.6, PHP 5.4.6 |
||
| Attachments: |
|
||||||||
| Issue Links: |
|
||||||||
| Description |
|
In Zabbix Monitoring > Events after choose the date (different from "now") in the datepicker and the "Zoom Period" and click in another page (like page 2) the date backs to "now". This make annoying to check passed events. |
| Comments |
| Comment by Aleksandrs Saveljevs [ 2016 Nov 08 ] |
|
Closing as a duplicate of |
[ZBX-11426] Events removed by housekeeper can cause trigger to be stuck in problem state Created: 2016 Nov 04 Updated: 2024 Apr 10 Resolved: 2017 Nov 28 |
|
| Status: | Closed |
| Project: | ZABBIX BUGS AND ISSUES |
| Component/s: | Server (S) |
| Affects Version/s: | 3.2.1 |
| Fix Version/s: | 3.2.9rc1, 3.2.11rc1, 3.4.3rc1, 3.4.5rc1, 4.0.0alpha1, 4.0 (plan) |
| Type: | Problem report | Priority: | Critical |
| Reporter: | Andris Zeila | Assignee: | Andrea Biscuola (Inactive) |
| Resolution: | Fixed | Votes: | 6 |
| Labels: | events, housekeeper | ||
| Remaining Estimate: | Not Specified | ||
| Time Spent: | Not Specified | ||
| Original Estimate: | Not Specified | ||
| Issue Links: |
|
||||||||||||||||||||||||||||||||
| Team: | |
||||||||||||||||||||||||||||||||
| Sprint: | Sprint 14, Sprint 15, Sprint 16, Sprint 17, Sprint 19, Sprint 21, Sprint 22 | ||||||||||||||||||||||||||||||||
| Story Points: | 3.5 | ||||||||||||||||||||||||||||||||
| Description |
|
When housekeeper removes open problem event the trigger value/problem count is not updated. If this was the last open problem event then trigger will be stuck in problem state and keep generating recovery events. To fix the current situation recovery events must update trigger value/problem count event if there were no open problems To avoid this from happening in future housekeeper must not remove open problem events. |
| Comments |
| Comment by Oleksii Zagorskyi [ 2016 Nov 08 ] |
|
|
| Comment by Aleksandrs Saveljevs [ 2016 Nov 08 ] |
|
|
| Comment by Andris Zeila [ 2016 Nov 10 ] |
|
|
| Comment by Alexander Vladishev [ 2017 Aug 10 ] |
|
|
| Comment by Andrea Biscuola (Inactive) [ 2017 Sep 20 ] |
|
Fixed in svn://svn.zabbix.com/branches/dev/ZBX-11426 Modified the filters in the housekeeping_events() function for checking through a subquery if an event have an associated problem in the problem table. Remove only the events without a corresponding record (open or closed). |
| Comment by Andris Zeila [ 2017 Sep 20 ] |
|
Successfully tested, please review minor changes in r72783 abs Looks good. CLOSED |
| Comment by Andrea Biscuola (Inactive) [ 2017 Sep 26 ] |
|
Released in:
|
| Comment by richlv [ 2017 Sep 28 ] |
|
this might be worth documenting in the housekeeper section (and maybe also in the upgrade notes for 3.2.9 and 3.4.3) |
| Comment by Andrea Biscuola (Inactive) [ 2017 Sep 29 ] |
|
Maybe a good idea, as now the housekeeper behaviour is explicit regarding how some types of events are kept or deleted. The issue itself was already mitigated in the past through another task and this is just the completion of that work. |
| Comment by richlv [ 2017 Oct 06 ] |
|
indeed, currently the behaviour seems to be completely undocumented |
| Comment by Andris Zeila [ 2017 Oct 13 ] |
|
With event housekeeping period set to 1d (or close to it) there is a danger of recovery events being removed while the recovered events are still in problem table. I'm not sure if it's worth adding more complexity to event deleting queries (although it would be the safest way). I think acceptable workaround would be to call housekeeping_problems() before housekeeping_events() function. As the event housekeeping period cannot be less than problem cleanup period (24h) this would ensure that problems are removed from problem table before corresponding events are removed from events table. wiper So it was decided to have proper fix. To do it we need to add problem.r_eventid index and also check for r_eventid when removing events. |
| Comment by Andrea Biscuola (Inactive) [ 2017 Nov 14 ] |
|
Fixed in svn://svn.zabbix.com/branches/dev/ZBX-11426 Swap the calls to housekeeping_problems() and housekeeping_events(). Also added a filter to the events delete queries for checking the |
| Comment by Andris Zeila [ 2017 Nov 16 ] |
|
Successfully tested, please review coding style fixes in r74679 abs style fix ok. CLOSED |
| Comment by Andrea Biscuola (Inactive) [ 2017 Nov 17 ] |
|
Released in:
|
| Comment by Andrea Biscuola (Inactive) [ 2017 Nov 17 ] |
|
The housekeeper final behaviour after this change is that an event Also, now the housekeeper will delete problems first and events |
[ZBX-11405] Treeview button is enabled even if there are no events to show Created: 2016 Oct 28 Updated: 2024 Apr 10 Resolved: 2017 May 09 |
|
| Status: | Closed |
| Project: | ZABBIX BUGS AND ISSUES |
| Component/s: | Frontend (F) |
| Affects Version/s: | 3.0.5, 3.2.1 |
| Fix Version/s: | 3.0.10rc1, 3.2.7rc1, 3.4.0alpha1 |
| Type: | Incident report | Priority: | Trivial |
| Reporter: | Gunars Pujats (Inactive) | Assignee: | Unassigned |
| Resolution: | Fixed | Votes: | 0 |
| Labels: | events, filter, triggers | ||
| Remaining Estimate: | Not Specified | ||
| Time Spent: | Not Specified | ||
| Original Estimate: | Not Specified | ||
| Team: | |
| Sprint: | Sprint 4, Sprint 5, Sprint 6, Sprint 7 |
| Story Points: | 0.2 |
| Description |
|
In Monitoring -> Triggers page treeview button is shown for triggers when there are no events to show. To reproduce: Treeview button for selected trigger is available, but there are no events. |
| Comments |
| Comment by Miks Kronkalns [ 2017 Mar 31 ] |
|
(1) no translation string changes sasha CLOSED |
| Comment by Miks Kronkalns [ 2017 Mar 31 ] |
|
RESOLVED in |
| Comment by Alexander Vladishev [ 2017 Apr 08 ] |
|
(2) These changes must be reverted. Main button in the header must be displayed if "Show all (N days)" or "Show unacknowledged (N days)" are selected.
@@ -364,8 +364,10 @@
        }
 }

+$events = null;
 if ($showEvents == EVENTS_OPTION_ALL || $showEvents == EVENTS_OPTION_NOT_ACK) {
        foreach ($triggers as &$trigger) {
@@ -440,12 +455,12 @@
 $switcherName = 'trigger_switchers';

 if ($showEvents == EVENTS_OPTION_ALL || $showEvents == EVENTS_OPTION_NOT_ACK) {
-       $showHideAllButton = (new CColHeader(
+       $showHideAllButton = $events ? (new CColHeader(
                (new CSimpleButton())
                        ->addClass(ZBX_STYLE_TREEVIEW)
                        ->setId($switcherName)
                        ->addItem((new CSpan())->addClass(ZBX_STYLE_ARROW_RIGHT))
-       ))->addClass(ZBX_STYLE_CELL_WIDTH);
+       ))->addClass(ZBX_STYLE_CELL_WIDTH) : '';
 }
 else {
        $showHideAllButton = null;
Miks.Kronkalns RESOLVED in svn://svn.zabbix.com/branches/dev/ZBX-11405-32 r67284 sasha CLOSED |
| Comment by Miks Kronkalns [ 2017 May 09 ] |
|
Fixed:
|
[ZBX-11376] Events view: pagination and timeline Created: 2016 Oct 20 Updated: 2017 May 30 Resolved: 2016 Oct 24 |
|
| Status: | Closed |
| Project: | ZABBIX BUGS AND ISSUES |
| Component/s: | Frontend (F) |
| Affects Version/s: | 3.0.4 |
| Fix Version/s: | None |
| Type: | Incident report | Priority: | Major |
| Reporter: | Johannes Petz | Assignee: | Unassigned |
| Resolution: | Duplicate | Votes: | 0 |
| Labels: | events | ||
| Remaining Estimate: | Not Specified | ||
| Time Spent: | Not Specified | ||
| Original Estimate: | Not Specified | ||
| Issue Links: |
|
||||||||
| Description |
|
In the view "Monitoring->Events" I have a problem with the timeline and pagination feature. 1. Move to "Monitoring->Events" and select a group with a lot of events so the pagination is displayed. I thought that this is only a view bug (timeline moves without effects). But the events are filtered like the timeline shows. So this is a real problem. This bug is very annoying when you are searching for some problems in the past. Can you please fix it soon? I tested the bug in Zabbix 3.0.4. We have no other Zabbix Versions here sorry. Maybe someone else can test it. Best regards Johannes |
| Comments |
| Comment by Aleksandrs Saveljevs [ 2016 Oct 24 ] |
|
Closing as a duplicate of |
[ZBX-11366] CLONE - Getting first event for non-Super-Admin user is slow on Monitoring->Events page Created: 2016 Oct 17 Updated: 2017 May 30 Resolved: 2016 Oct 17 |
|
| Status: | Closed |
| Project: | ZABBIX BUGS AND ISSUES |
| Component/s: | Frontend (F) |
| Affects Version/s: | None |
| Fix Version/s: | None |
| Type: | Incident report | Priority: | Blocker |
| Reporter: | Александр Богданчиков | Assignee: | Unassigned |
| Resolution: | Won't fix | Votes: | 0 |
| Labels: | events, oracle, performance | ||
| Remaining Estimate: | Not Specified | ||
| Time Spent: | Not Specified | ||
| Original Estimate: | Not Specified | ||
| Environment: |
Oracle, MySQL |
||
| Issue Links: |
|
||||||||
| Description |
|
Zabbix frontend gets the oldest eventid in any cases using the next call: 5. event->get [events.php:390]
Parameters:
Array
(
[source] => 0
[object] => 0
[output] => extend
[objectids] =>
[sortfield] => Array
(
[0] => clock
)
[sortorder] => ASC
[limit] => 1
)
Result:
Array
(
[0] => Array
(
[eventid] => 219
[source] => 0
[object] => 0
[objectid] => 13628
[clock] => 1401317490
[value] => 0
[acknowledged] => 0
[ns] => 365969275
)
)
query looks like:
|
[ZBX-11220] Last event is not visible when "All" is selected in time slider Created: 2016 Sep 16 Updated: 2017 May 30 Resolved: 2016 Sep 29 |
|
| Status: | Closed |
| Project: | ZABBIX BUGS AND ISSUES |
| Component/s: | Frontend (F) |
| Affects Version/s: | 3.0.4 |
| Fix Version/s: | 3.0.5rc2 |
| Type: | Incident report | Priority: | Blocker |
| Reporter: | Kodai Terashima | Assignee: | Unassigned |
| Resolution: | Fixed | Votes: | 0 |
| Labels: | events | ||
| Remaining Estimate: | Not Specified | ||
| Time Spent: | Not Specified | ||
| Original Estimate: | Not Specified | ||
| Attachments: |
|
||||||||
| Issue Links: |
|
||||||||
| Description |
|
As attached screenshot, the last event exists when "1h", '2h", "1d" is selected in time slider. However, that event is not visible when "All" is selected. |
| Comments |
| Comment by richlv [ 2016 Sep 16 ] |
|
there's some possibility that this is a duplicate of |
| Comment by Oleksii Zagorskyi [ 2016 Sep 16 ] |
|
It reminds me about |
| Comment by Kodai Terashima [ 2016 Sep 21 ] |
|
I agree that this issue is same as |
| Comment by Alexander Vladishev [ 2016 Sep 29 ] |
|
Seems this problem is not related to Reopened. |
| Comment by Alexander Vladishev [ 2016 Sep 29 ] |
|
Fixed in development branch svn://svn.zabbix.com/branches/dev/ZBX-11220 |
| Comment by Gunars Pujats (Inactive) [ 2016 Sep 29 ] |
|
(1) No translation strings changed CLOSED |
| Comment by Gunars Pujats (Inactive) [ 2016 Sep 29 ] |
|
Successfully tested |
| Comment by richlv [ 2016 Sep 29 ] |
|
interesting, what was the cause here ? |
| Comment by Alexander Vladishev [ 2016 Sep 29 ] |
|
It was regression in version 3.0.0. It can happen, when filtering more than 1000 elements ( Search/Filter elements limit). In this case frontend requests 1001 element (to show + character in table footer) and removes one extra record but from wrong "side". |
| Comment by Alexander Vladishev [ 2016 Sep 29 ] |
|
Fixed in pre-3.0.5rc2 r62853. |
| Comment by Oleksii Zagorskyi [ 2016 Sep 29 ] |
|
in |
| Comment by richlv [ 2016 Sep 29 ] |
|
sasha, thanks a lot for the explanation. the following are somewhat similar : |
[ZBX-11183] Only SINGLE Problem from trigger (with multiple option) is shown on the Dashboard Created: 2016 Sep 09 Updated: 2024 Apr 10 Resolved: 2017 Aug 04 |
|
| Status: | Closed |
| Project: | ZABBIX BUGS AND ISSUES |
| Component/s: | Frontend (F) |
| Affects Version/s: | 3.2.0beta2, 3.2.0rc1 |
| Fix Version/s: | 3.4.0alpha1 |
| Type: | Incident report | Priority: | Major |
| Reporter: | Vitaly Zhuravlev | Assignee: | Unassigned |
| Resolution: | Fixed | Votes: | 0 |
| Labels: | events | ||
| Remaining Estimate: | Not Specified | ||
| Time Spent: | Not Specified | ||
| Original Estimate: | Not Specified | ||
| Attachments: |
|
||||||||
| Issue Links: |
|
||||||||
| Team: | |
||||||||
| Sprint: | Sprint 1, Sprint 4, Sprint 5, Sprint 6, Sprint 7 | ||||||||
| Story Points: | 20 | ||||||||
| Description |
|
Only SINGLE Problem from trigger (with multiple option) is shown on the Dashboard: And there is more. If the problem with index 12 is resolved then on the dashboard it will still be shown (meanwhile now interface 11 is the last problem from this trigger) : To reproduce: run from cli: snmptrap -Y clientaddr=127.0.0.1 -v 2c -c public localhost '' IF-MIB::linkDown IF-MIB::ifIndex i 10 IF-MIB::ifIndex i 1 IF-MIB::ifIndex i 2 snmptrap -Y clientaddr=127.0.0.1 -v 2c -c public localhost '' IF-MIB::linkDown IF-MIB::ifIndex i 11 IF-MIB::ifIndex i 1 IF-MIB::ifIndex i 2 snmptrap -Y clientaddr=127.0.0.1 -v 2c -c public localhost '' IF-MIB::linkDown IF-MIB::ifIndex i 12 IF-MIB::ifIndex i 1 IF-MIB::ifIndex i 2 And then to resolve with index 12:
snmptrap -Y clientaddr=127.0.0.1 -v 2c -c public localhost '' IF-MIB::linkUp IF-MIB::ifIndex i 12 IF-MIB::ifIndex i 1 IF-MIB::ifIndex i 1
The trigger config is (can be found in template) |
| Comments |
| Comment by Alexander Vladishev [ 2017 Jun 30 ] |
|
Fixed in dev branch svn://svn.zabbix.com/branches/dev/ZBXNEXT-3921 r69669 |
| Comment by Alexander Vladishev [ 2017 Aug 04 ] |
|
Already fixed in pre-3.4.0 under |
[ZBX-10762] event.get may generate huge SQL query which never is finished. Created: 2016 May 09 Updated: 2019 Mar 25 Resolved: 2019 Mar 25 |
|
| Status: | Closed |
| Project: | ZABBIX BUGS AND ISSUES |
| Component/s: | API (A) |
| Affects Version/s: | 2.4.8 |
| Fix Version/s: | None |
| Type: | Incident report | Priority: | Critical |
| Reporter: | Andrei Gushchin (Inactive) | Assignee: | Zabbix Development Team |
| Resolution: | Duplicate | Votes: | 2 |
| Labels: | api, events, performance | ||
| Remaining Estimate: | Not Specified | ||
| Time Spent: | Not Specified | ||
| Original Estimate: | Not Specified | ||
| Description |
|
Not sure how reproduce that. Just found that DB execute about 1000 similar queries which listed for 50+ pages in processlist:
 ID: 28006
   USER: zabbix
   HOST: X.X.X.X:60838
     DB: zabbix
COMMAND: Query
   TIME: 12316
  STATE: Sending data
   INFO: SELECT e.eventid,i.hostid FROM events e,functions f,items i WHERE (e.eve
ntid BETWEEN '30295710' AND '30295714' OR e.eventid BETWEEN '30342776' AND '30342
781' OR e.eventid BETWEEN '30367772' AND '30367778' OR e.eventid BETWEEN '3036824
3' AND '30368248' OR e.eventid BETWEEN '30368310' AND '30368317' OR e.eventid BET
WEEN '30368364' AND '30368368' OR e.eventid BETWEEN '30368745' AND '30368749' OR
e.eventid BETWEEN '30368953' AND '30368958' OR e.eventid BETWEEN '30369155' AND '
30369159' OR e.eventid BETWEEN '30369734' AND '30369741' OR e.eventid BETWEEN '30
372212' AND '30372218' OR e.even
....................
...........
|
| Comments |
| Comment by Oleksii Zagorskyi [ 2016 May 18 ] |
|
We ended up that the query has been generated by event.get API method when "selectHosts" property is defined.
{
    "sortfield": [
        "clock",
        "eventid"
    ],
    "time_from": 1460505867,
    "selectHosts": "extend",
    "selectRelatedObject": "extend",
    "select_acknowledges": "extend",
    "output": "extend"
}
Someone wrote it and it's actually wrong. The request involved 308714 events and tried to get host names for these events by single SQL. We have a few ZBXes here where some get request may be a performance killer. |
| Comment by Alexander Vladishev [ 2019 Mar 25 ] |
|
This issue has been fixed together with |
[ZBX-10606] Frontend Monitoring->Events section "Event Detail" do not show "name of actions" Created: 2016 Apr 01 Updated: 2017 May 30 Resolved: 2016 Apr 04 |
|
| Status: | Closed |
| Project: | ZABBIX BUGS AND ISSUES |
| Component/s: | Frontend (F) |
| Affects Version/s: | 2.0.16, 2.2.11, 2.4.7, 3.0.1 |
| Fix Version/s: | None |
| Type: | Incident report | Priority: | Trivial |
| Reporter: | Dimitri Bellini | Assignee: | Unassigned |
| Resolution: | Duplicate | Votes: | 0 |
| Labels: | actions, events | ||
| Remaining Estimate: | Not Specified | ||
| Time Spent: | Not Specified | ||
| Original Estimate: | Not Specified | ||
| Environment: |
Centos 7.0 X64 |
||
| Attachments: |
|
||||||||
| Issue Links: |
|
||||||||
| Description |
|
Many times i thought that would be a good feature to show who have made a specific "action". For example in a wrong action that fire when they do not have to fire. |
| Comments |
| Comment by Aleksandrs Saveljevs [ 2016 Apr 04 ] |
|
Closing as a duplicate of ZBXNEXT-1636. |
[ZBX-10466] events.php page without "hostid" parameter would not show the proper trigger Created: 2016 Feb 29 Updated: 2017 May 30 Resolved: 2016 Mar 16 |
|
| Status: | Closed |
| Project: | ZABBIX BUGS AND ISSUES |
| Component/s: | Frontend (F) |
| Affects Version/s: | 2.4.7, 3.0.1 |
| Fix Version/s: | 3.0.2rc1, 3.2.0alpha1 |
| Type: | Incident report | Priority: | Major |
| Reporter: | Alexander Vladishev | Assignee: | Unassigned |
| Resolution: | Fixed | Votes: | 0 |
| Labels: | events | ||
| Remaining Estimate: | Not Specified | ||
| Time Spent: | Not Specified | ||
| Original Estimate: | Not Specified | ||
| Description |
|
Originally posted as comment by ejames in events.php?triggerid={TRIGGER.ID}&filter_set=1 without hostid parameter would not show the proper trigger. According documentation hostid parameter is not required |
| Comments |
| Comment by Gunars Pujats (Inactive) [ 2016 Mar 04 ] |
|
(1) No translation strings changed. iivs CLOSED |
| Comment by Gunars Pujats (Inactive) [ 2016 Mar 04 ] |
|
RESOLVED in development branch svn://svn.zabbix.com/branches/dev/ZBX-10466 |
| Comment by Ivo Kurzemnieks [ 2016 Mar 09 ] |
|
(2) Changing source to Discovery and having an URL with triggerid and filter_set, shows no data. It should switch back to source Triggers. We should automatically detect it and change it. gunarspujats RESOLVED in r58955. iivs CLOSED |
| Comment by Ivo Kurzemnieks [ 2016 Mar 09 ] |
|
(3) Please, check the following places where events.php is called:
gunarspujats RESOLVED in r59013. iivs Great! Works like a charm. Thanks! |
| Comment by Gunars Pujats (Inactive) [ 2016 Mar 16 ] |
|
Fixed in:
|
| Comment by Alexander Vladishev [ 2016 Mar 16 ] |
|
(4) Seems this code is not used after this fix frontends/php/include/maps.inc.php:146:164
         // Find monitored hosts and get groups that those hosts belong to.
        $monitored_hostids = [];

        foreach ($triggers as $trigger) {
                foreach ($trigger['hosts'] as $host) {
                        if ($host['status'] == HOST_STATUS_MONITORED) {
                                $monitored_hostids[$host['hostid']] = true;
                        }
                }
        }

        if ($monitored_hostids) {
                $monitored_hosts = API::Host()->get([
                        'output' => ['hostid'],
                        'selectGroups' => ['groupid'],
                        'hostids' => array_keys($monitored_hostids),
                        'preservekeys' => true
                ]);
        }
gunarspujats RESOLVED in r59049, r59050. sasha Thank you! CLOSED |
| Comment by James Sperry [ 2016 Apr 22 ] |
|
Is this supposed to work with only <zabbix url>/events.php?triggerid= {TRIGGER.ID}Because it's still going to the wrong host unless I have <zabbix url>/events.php?triggerid={TRIGGER.ID} &filter_set=1 Currently we're on 2.2, and we only use <zabbix url>/events.php?triggerid= {TRIGGER.ID}which works fine. Moving forward, if we need to include filter_set, then I'll update all my triggers during my upgrade to 3.0.2 |
[ZBX-10277] validate tr_events.php arguments, do not display invalid data Created: 2016 Jan 18 Updated: 2019 Feb 16 Resolved: 2019 Feb 16 |
|
| Status: | Closed |
| Project: | ZABBIX BUGS AND ISSUES |
| Component/s: | Frontend (F) |
| Affects Version/s: | None |
| Fix Version/s: | None |
| Type: | Incident report | Priority: | Major |
| Reporter: | Chris Christensen | Assignee: | Zabbix Development Team |
| Resolution: | Cannot Reproduce | Votes: | 0 |
| Labels: | eventdetails, events | ||
| Remaining Estimate: | Not Specified | ||
| Time Spent: | Not Specified | ||
| Original Estimate: | Not Specified | ||
| Attachments: |
|
| Description |
|
Passing the event ID (stale/old or wrong) to /tr_events.php?triggerid=<DISABLED TRIGGER ID>&eventid=<STALE/OLD EVENT ID> will cause errors to be reported (bottom of the page) and incorrect event details to be shown. Bottom of the page error output (v2.2.4): array_merge(): Argument #2 is not an array [tr_events.php:112 ? make_event_details() ? array_merge() in /usr/share/zabbix/include/events.inc.php:182] Argument 1 passed to CMacrosResolverHelper::resolveEventDescription() must be an array, null given, called in /usr/share/zabbix/include/events.inc.php on line 182 and defined [tr_events.php:112 ? make_event_details() ? CMacrosResolverHelper::resolveEventDescription() in /usr/share/zabbix/include/classes/macros/CMacrosResolverHelper.php:329] Undefined index: acknowledged [tr_events.php:112 ? make_event_details() ? getEventAckState() in /usr/share/zabbix/include/events.inc.php:361] Undefined index: eventid [tr_events.php:112 ? make_event_details() ? getEventAckState() in /usr/share/zabbix/include/events.inc.php:362] Undefined index: objectid [tr_events.php:112 ? make_event_details() ? getEventAckState() in /usr/share/zabbix/include/events.inc.php:362] Invalid argument supplied for foreach() [tr_events.php:126 ? get_action_msgs_for_event() in /usr/share/zabbix/include/actions.inc.php:838] Invalid argument supplied for foreach() [tr_events.php:131 ? get_action_cmds_for_event() in /usr/share/zabbix/include/actions.inc.php:914] |
| Comments |
| Comment by Chris Christensen [ 2016 Jan 18 ] |
|
I imagine a simple fix would be to have some validation of arguments and show a message or different query if the event argument is passed from a disabled trigger. |
| Comment by Alexander Vladishev [ 2019 Feb 16 ] |
|
This issue is not reproducible in version 4.0. |
[ZBX-10265] Generating duplicated events after maintenance even when trigger didn't change state during real maintenance period Created: 2016 Jan 14 Updated: 2017 Oct 11 Resolved: 2017 Oct 11 |
|
| Status: | Closed |
| Project: | ZABBIX BUGS AND ISSUES |
| Component/s: | Documentation (D), Server (S) |
| Affects Version/s: | 2.2.11, 2.4.7, 3.0.0alpha6 |
| Fix Version/s: | None |
| Type: | Incident report | Priority: | Major |
| Reporter: | Andrei Gushchin (Inactive) | Assignee: | Unassigned |
| Resolution: | Duplicate | Votes: | 4 |
| Labels: | duplicates, events, maintenance | ||
| Remaining Estimate: | Not Specified | ||
| Time Spent: | Not Specified | ||
| Original Estimate: | Not Specified | ||
| Issue Links: |
|
||||||||
| Description |
|
Steps for reproduce:
You see that was generated new event and trigger become unacknowledged, it is unexpected behavior for setups where acknowledging used as indication that problem is known and somebody work on it. |
| Comments |
| Comment by Oleksii Zagorskyi [ 2016 Jan 18 ] |
|
It's known and already documented (in |
| Comment by Andrei Gushchin (Inactive) [ 2016 Jan 18 ] |
|
Hmm In For example if we have 10000+ servers few was down or broke, NOC team is ACK their trigger then create maintenance, and put bunch of hosts(with hostgroup) included that two to maintenance, after awhile get them out from maintenance manually, It will generate new events -> notifications,escalations etc. , at least NOC team should ACK them again. |
| Comment by Oleksii Zagorskyi [ 2016 Jan 18 ] |
|
Hard to believe ... but I tested and it appeared to be a true !!! A function mentioned in the /****************************************************************************** * * * Function: generate_events * * * * Purpose: generate events for triggers after maintenance period * * The events will be generated if trigger changed its state during * * the maintenance * But for PROBLEM/OK event duplicated created even if original event was created before host was switched "in maintenance" state. And it's a roulette what trigger status was before the already configured active maintenance. Problem is that we do not store real timestamps when hosts status being changed to maintenance instead we store maximal clock from maintenance ("Active since" from global or "Data", "At (hour:minute)" from periods) in hosts.maintenance_from. We could use and store timestamp of current time, i.e. now(). It would be much more correct, IMO. This issue is critical enough as we are aware of many zabbix users/etc who, using zabbix API, puts many hosts/groups to already existing very "wide time" maintenance. Even more, this bug may create multiple (more than 2) consecutive same type events, which drives us crazy long time already in ZBX-9432. Debug log (2 parts - for PROBLEM and OK events): 13687:20160118:190738.147 Starting Zabbix Server. Zabbix 2.4.7rc1 (revision 54982). 13701:20160118:190738.178 server #13 started [timer #1] ... --FOR DUPLICATED OK: 13701:20160118:191900.351 In process_maintenance() 13701:20160118:191900.351 query [txnlev:0] [select m.maintenanceid,m.maintenance_type,m.active_since,tp.timeperiod_type,tp.every,tp.month,tp.dayofweek,tp.day,tp.start_time,tp.period,tp.start_date from maintenances m,maintenances_windows mw,timeperiods tp where m.maintenanceid=mw.maintenanceid and mw.timeperiodid=tp.timeperiodid and m.active_since<=1453137540 and m.active_till>1453137540] 13701:20160118:191900.352 In process_maintenance_hosts() 13701:20160118:191900.352 query [txnlev:0] [select h.hostid,h.host,h.maintenanceid,h.maintenance_status,h.maintenance_type,h.maintenance_from from maintenances_hosts mh,hosts h where mh.hostid=h.hostid and h.status=0 and mh.maintenanceid=1] 13701:20160118:191900.353 query [txnlev:0] [select h.hostid,h.host,h.maintenanceid,h.maintenance_status,h.maintenance_type,h.maintenance_from from maintenances_groups mg,hosts_groups hg,hosts h where mg.groupid=hg.groupid and hg.hostid=h.hostid and h.status=0 and mg.maintenanceid=1] 13701:20160118:191900.354 End of process_maintenance_hosts() 13701:20160118:191900.354 In update_maintenance_hosts() 13701:20160118:191900.354 query [txnlev:1] [begin;] 13701:20160118:191900.354 query [txnlev:1] [select hostid,host,maintenance_type,maintenance_from from hosts where status=0 and flags<>2 and maintenance_status=1 and not hostid=10124] 13701:20160118:191900.355 taking host 'it0' out of maintenance 13701:20160118:191900.355 query [txnlev:1] [update hosts set maintenanceid=null,maintenance_status=0,maintenance_type=0,maintenance_from=0 where hostid=10105] 13701:20160118:191900.355 query [txnlev:1] [commit;] 13701:20160118:191900.361 In generate_events() 13701:20160118:191900.361 query [txnlev:0] [select distinct t.triggerid,t.description,t.expression,t.priority,t.type,t.lastchange,t.value from triggers t,functions f,items i where t.triggerid=f.triggerid and f.itemid=i.itemid and t.status=0 and i.status=0 and i.state=0 and i.hostid=10105] 13701:20160118:191900.363 In get_trigger_values() 13701:20160118:191900.363 get_trigger_values() from:'2016.01.01 00:00:00' 13701:20160118:191900.363 query [txnlev:0] [select value from events where source=0 and object=0 and objectid=14239 and clock<1451599200 order by eventid desc limit 1] 13701:20160118:191900.364 query [txnlev:0] [select value from events where source=0 and object=0 and objectid=14239 and clock>=1451599200 and value=1 limit 1] 13701:20160118:191900.364 End of get_trigger_values() before:0 inside:1 after:0 13701:20160118:191900.364 In process_events() events_num:1 13701:20160118:191900.364 In DCget_nextid() table:'events' num:1 13701:20160118:191900.364 End of DCget_nextid() table:'events' [246:246] 13701:20160118:191900.365 query without transaction detected 13701:20160118:191900.365 query [txnlev:0] [insert into events (eventid,source,object,objectid,clock,ns,value) values (246,0,0,14239,1453137540,0,0); ] 13701:20160118:191900.370 In process_actions() events_num:1 13701:20160118:191900.370 query [txnlev:0] [select actionid,evaltype,formula from actions where status=0 and eventsource=0] 13701:20160118:191900.371 In check_action_conditions() actionid:15 13701:20160118:191900.371 query [txnlev:0] [select conditionid,conditiontype,operator,value from conditions where actionid=15 order by conditiontype] 13701:20160118:191900.371 In check_action_condition() actionid:15 conditionid:33 cond.value:'' 13701:20160118:191900.371 In check_trigger_condition() 13701:20160118:191900.371 query [txnlev:0] [select count(*) from hosts h,items i,functions f,triggers t where h.hostid=i.hostid and h.maintenance_status=0 and i.itemid=f.itemid and f.triggerid=t.triggerid and t.triggerid=14239] 13701:20160118:191900.372 End of check_trigger_condition():SUCCEED 13701:20160118:191900.372 End of check_action_condition():SUCCEED 13701:20160118:191900.372 End of check_action_conditions():SUCCEED 13701:20160118:191900.372 In DCget_nextid() table:'escalations' num:1 13701:20160118:191900.372 End of DCget_nextid() table:'escalations' [6:6] 13701:20160118:191900.372 query without transaction detected 13701:20160118:191900.372 query [txnlev:0] [insert into escalations (escalationid,actionid,status,triggerid,itemid,eventid,r_eventid) values (6,15,0,14239,null,246,null); ] 13701:20160118:191900.377 End of process_actions() 13701:20160118:191900.377 In DBupdate_itservices() 13701:20160118:191900.377 In its_flush_updates() 13701:20160118:191900.377 In its_load_services_by_triggerids() 13701:20160118:191900.377 query [txnlev:0] [select serviceid,triggerid,status,algorithm from services where triggerid=14239] 13701:20160118:191900.378 End of its_load_services_by_triggerids() 13701:20160118:191900.378 End of its_flush_updates():SUCCEED 13701:20160118:191900.378 End of DBupdate_itservices():SUCCEED 13701:20160118:191900.378 End of process_events() 13701:20160118:191900.378 End of generate_events() 13701:20160118:191900.378 End of update_maintenance_hosts() 13701:20160118:191900.378 End of process_maintenance() 13701:20160118:191900.378 timer #1 [processed 1 triggers, 0 events in 0.002521 sec, 1 maintenances in 0.026423 sec, idle 30 sec] ... --FOR DUPLICATED PROBLEM: 13701:20160118:192200.413 In process_maintenance() 13701:20160118:192200.413 query [txnlev:0] [select m.maintenanceid,m.maintenance_type,m.active_since,tp.timeperiod_type,tp.every,tp.month,tp.dayofweek,tp.day,tp.start_time,tp.period,tp.start_date from maintenances m,maintenances_windows mw,timeperiods tp where m.maintenanceid=mw.maintenanceid and mw.timeperiodid=tp.timeperiodid and m.active_since<=1453137720 and m.active_till>1453137720] 13701:20160118:192200.414 In process_maintenance_hosts() 13701:20160118:192200.414 query [txnlev:0] [select h.hostid,h.host,h.maintenanceid,h.maintenance_status,h.maintenance_type,h.maintenance_from from maintenances_hosts mh,hosts h where mh.hostid=h.hostid and h.status=0 and mh.maintenanceid=1] 13701:20160118:192200.415 query [txnlev:0] [select h.hostid,h.host,h.maintenanceid,h.maintenance_status,h.maintenance_type,h.maintenance_from from maintenances_groups mg,hosts_groups hg,hosts h where mg.groupid=hg.groupid and hg.hostid=h.hostid and h.status=0 and mg.maintenanceid=1] 13701:20160118:192200.415 End of process_maintenance_hosts() 13701:20160118:192200.415 In update_maintenance_hosts() 13701:20160118:192200.415 query [txnlev:1] [begin;] 13701:20160118:192200.416 query [txnlev:1] [select hostid,host,maintenance_type,maintenance_from from hosts where status=0 and flags<>2 and maintenance_status=1 and not hostid=10124] 13701:20160118:192200.416 taking host 'it0' out of maintenance 13701:20160118:192200.416 query [txnlev:1] [update hosts set maintenanceid=null,maintenance_status=0,maintenance_type=0,maintenance_from=0 where hostid=10105] 13701:20160118:192200.417 query [txnlev:1] [commit;] 13701:20160118:192200.422 In generate_events() 13701:20160118:192200.422 query [txnlev:0] [select distinct t.triggerid,t.description,t.expression,t.priority,t.type,t.lastchange,t.value from triggers t,functions f,items i where t.triggerid=f.triggerid and f.itemid=i.itemid and t.status=0 and i.status=0 and i.state=0 and i.hostid=10105] 13701:20160118:192200.423 In get_trigger_values() 13701:20160118:192200.423 get_trigger_values() from:'2016.01.01 00:00:00' 13701:20160118:192200.423 query [txnlev:0] [select value from events where source=0 and object=0 and objectid=14239 and clock<1451599200 order by eventid desc limit 1] 13701:20160118:192200.424 End of get_trigger_values() before:0 inside:2 after:1 13701:20160118:192200.424 In process_events() events_num:1 13701:20160118:192200.424 In DCget_nextid() table:'events' num:1 13701:20160118:192200.424 End of DCget_nextid() table:'events' [248:248] 13701:20160118:192200.424 query without transaction detected 13701:20160118:192200.424 query [txnlev:0] [insert into events (eventid,source,object,objectid,clock,ns,value) values (248,0,0,14239,1453137720,0,1); ] 13701:20160118:192200.440 In process_actions() events_num:1 13701:20160118:192200.440 query [txnlev:0] [select actionid,evaltype,formula from actions where status=0 and eventsource=0] 13701:20160118:192200.441 In check_action_conditions() actionid:15 13701:20160118:192200.441 query [txnlev:0] [select conditionid,conditiontype,operator,value from conditions where actionid=15 order by conditiontype] 13701:20160118:192200.441 In check_action_condition() actionid:15 conditionid:33 cond.value:'' 13701:20160118:192200.441 In check_trigger_condition() 13701:20160118:192200.441 query [txnlev:0] [select count(*) from hosts h,items i,functions f,triggers t where h.hostid=i.hostid and h.maintenance_status=0 and i.itemid=f.itemid and f.triggerid=t.triggerid and t.triggerid=14239] 13701:20160118:192200.442 End of check_trigger_condition():SUCCEED 13701:20160118:192200.442 End of check_action_condition():SUCCEED 13701:20160118:192200.442 End of check_action_conditions():SUCCEED 13701:20160118:192200.442 In DCget_nextid() table:'escalations' num:1 13701:20160118:192200.442 End of DCget_nextid() table:'escalations' [8:8] 13701:20160118:192200.442 query without transaction detected 13701:20160118:192200.442 query [txnlev:0] [insert into escalations (escalationid,actionid,status,triggerid,itemid,eventid,r_eventid) values (8,15,0,14239,null,248,null); ] 13701:20160118:192200.454 End of process_actions() 13701:20160118:192200.454 In DBupdate_itservices() 13701:20160118:192200.454 In its_flush_updates() 13701:20160118:192200.454 In its_load_services_by_triggerids() 13701:20160118:192200.454 query [txnlev:0] [select serviceid,triggerid,status,algorithm from services where triggerid=14239] 13701:20160118:192200.454 End of its_load_services_by_triggerids() 13701:20160118:192200.455 End of its_flush_updates():SUCCEED 13701:20160118:192200.455 End of DBupdate_itservices():SUCCEED 13701:20160118:192200.455 End of process_events() 13701:20160118:192200.455 End of generate_events() 13701:20160118:192200.455 End of update_maintenance_hosts() 13701:20160118:192200.455 End of process_maintenance() 13701:20160118:192200.455 timer #1 [processed 1 triggers, 0 events in 0.001975 sec, 1 maintenances in 0.041823 sec, idle 30 sec] CONFIRMED |
| Comment by Oleksii Zagorskyi [ 2016 Jan 20 ] |
|
(1) Documentation. martins-v Thanks, I slightly changed the added text, trying to keep the same meaning, but perhaps more precisely. Please have a look. zalex_ua very good, thanks! Replicated to 2.4 and 2.2. 2.0 is skipped as the page is not maintained anymore. |
| Comment by Pascal Uhlmann [ 2016 Sep 30 ] |
|
This issue also exists in 2.0.12. I'd say this behaviour should be configurable as a global setting. |
| Comment by Vladislavs Sokurenko [ 2017 Oct 11 ] |
|
This should have been fixed in |
[ZBX-10231] EventID rolled over in DB for no reason Created: 2016 Jan 01 Updated: 2017 Nov 02 Resolved: 2017 Nov 02 |
|
| Status: | Closed |
| Project: | ZABBIX BUGS AND ISSUES |
| Component/s: | Server (S) |
| Affects Version/s: | 2.4.5 |
| Fix Version/s: | None |
| Type: | Incident report | Priority: | Minor |
| Reporter: | Steve Mushero | Assignee: | Unassigned |
| Resolution: | Duplicate | Votes: | 0 |
| Labels: | events, ids | ||
| Remaining Estimate: | Not Specified | ||
| Time Spent: | Not Specified | ||
| Original Estimate: | Not Specified | ||
| Environment: |
Centos 6 |
||
| Issue Links: |
|
||||||||
| Description |
|
Not sure if we have a known bug as seems fixed in 2.4.7 but might be coincidence so wanted to report this: Our 2.4.1 system suddenly rolled over the eventID in the database for no reason. As far as we can tell, it uses the max(eventid) + 1, but this is clearly not working as it went from 15,161,039 to 393 - here are the events in the event table, sorted by clock: '15161039','2','3','200','1448276685','1','0',NULL,NULL,'0','0' This makes no sense at all, nor do we understand how this continues to work as the source code seems to cache a few of these at a time, always MAX(eventiid)+1, but that should be 15,161,040 but it continues to work on the lower numbers one by one, which should be impossible. We worry this is hiding some underlying problem that is not clear, and could happen with other IDs, and of course eventually we will have collisions, which then can't be fixed. We saw this because we use this ID for integration into our ticket system and we had some DB reports that show us how fast we ACK things, average problem duration, etc. and they all started failing. Checking this now, we see that it suddenly started working fine again using the max eventid at 2015-12-03 10:31:23 - when we upgraded the server binary to 2.4.7 |
| Comments |
| Comment by Oleksii Zagorskyi [ 2016 Jan 01 ] |
|
Zabbix server (recent versions) selects max eventid on start and internally caches it for new inserted events. Those 2 events are, respectively:
Is the eventid=393 the only wrong event ? Are those shown rows from mysql dump? |
| Comment by Steve Mushero [ 2016 Jan 04 ] |
|
They are all (or mostly) passive agent IDs and we have hundreds of thousands for months - it just started at 393 and then up though probably a million until we upgraded to 2.4.7 and it went away. Those are DB mysql dump and eventid=393 had a correct clock; that's how it was so obvious. |
| Comment by Glebs Ivanovskis (Inactive) [ 2017 Nov 02 ] |
|
Thank you for report! Looks like it is the same issue that was fixed in |
[ZBX-10227] exporting events to CSV exports all host events, ignoring selected host Created: 2015 Dec 30 Updated: 2017 May 30 Resolved: 2016 Jan 28 |
|
| Status: | Closed |
| Project: | ZABBIX BUGS AND ISSUES |
| Component/s: | Frontend (F) |
| Affects Version/s: | 2.4.5 |
| Fix Version/s: | 2.4.8rc1, 3.0.0beta2 |
| Type: | Incident report | Priority: | Major |
| Reporter: | Ofir Hoffman | Assignee: | Unassigned |
| Resolution: | Fixed | Votes: | 0 |
| Labels: | csv, events, export, regression | ||
| Remaining Estimate: | Not Specified | ||
| Time Spent: | Not Specified | ||
| Original Estimate: | Not Specified | ||
| Issue Links: |
|
||||||||
| Description |
|
I've found an issue while doing an export to CSV on events page. the way I managed to work around this is re logging to the web. tried looking for this issue but couldn't find any mention of this. p.s |
| Comments |
| Comment by Oleksii Zagorskyi [ 2015 Dec 31 ] |
|
Not reproducible on latest 2.2.12rc1-57195, but reproducible on 2.4.0 release, 2.4.8rc1-57209 and current trunk, so looks like introduced somewhere during 2.4 development. Issue in short - host selection doesn't affect CVS export, event for all hosts are always exported. CONFIRMED. |
| Comment by Gunars Pujats (Inactive) [ 2016 Jan 21 ] |
|
(1) No translation strings changed. iivs CLOSED |
| Comment by Gunars Pujats (Inactive) [ 2016 Jan 21 ] |
|
RESOLVED in development branch svn://svn.zabbix.com/branches/dev/ZBX-10227 |
| Comment by Ivo Kurzemnieks [ 2016 Jan 22 ] |
|
(2) Dropdown is now broken. Select events from group A. Then select events from group B. Press "reset" on filter and notice that events are shown from group A although group B is selected in dropdown. Probably same for host dropdown. gunarspujats RESOLVED in r57967 iivs Solution is hackish. We shouldn't change global variable $page just like that in one special case. Also, as we discussed, when pressing reset the "Host" column returns even if host is selected. REOPENED gunarspujats RESOLVED in r57994. iivs Found two more problems causing Host column to appead and dissapear after changing group and filtering by events by trigger. RESOLVED in r58017 gunarspujats CLOSED |
| Comment by Ivo Kurzemnieks [ 2016 Jan 27 ] |
|
TESTED, close (2) before merging. gunarspujats Please check minor changes in r58029. iivs We never wrote this for date, but I guess it doesn't hurt to add that. |
| Comment by Gunars Pujats (Inactive) [ 2016 Jan 28 ] |
|
Fixed in:
|
| Comment by richlv [ 2016 Mar 18 ] |
|
this might have fixed |
[ZBX-10067] False positive events on the trigger containing a log item Created: 2015 Nov 11 Updated: 2017 May 30 Resolved: 2015 Dec 13 |
|
| Status: | Closed |
| Project: | ZABBIX BUGS AND ISSUES |
| Component/s: | Server (S) |
| Affects Version/s: | 3.0.0alpha4 |
| Fix Version/s: | 3.0.0alpha5 |
| Type: | Incident report | Priority: | Critical |
| Reporter: | Alexander Vladishev | Assignee: | Unassigned |
| Resolution: | Fixed | Votes: | 0 |
| Labels: | events, falsepositives, logmonitoring, triggers | ||
| Remaining Estimate: | Not Specified | ||
| Time Spent: | Not Specified | ||
| Original Estimate: | Not Specified | ||
| Description |
|
Seems to be broken in Trigger expression: {svnzbx-rw:log[/var/log/syslog,"oom-killer",,,skip].strlen()} <> 0
Log file: Nov 10 19:17:01 ********* /USR/SBIN/CRON[21216]: (root) CMD ( cd / && run-parts --report /etc/cron.hourly) Nov 10 20:17:01 ********* /USR/SBIN/CRON[21712]: (root) CMD ( cd / && run-parts --report /etc/cron.hourly) Nov 10 21:17:01 ********* /USR/SBIN/CRON[22207]: (root) CMD ( cd / && run-parts --report /etc/cron.hourly) Nov 10 22:17:01 ********* /USR/SBIN/CRON[22704]: (root) CMD ( cd / && run-parts --report /etc/cron.hourly) Nov 10 23:17:01 ********* /USR/SBIN/CRON[23199]: (root) CMD ( cd / && run-parts --report /etc/cron.hourly) Nov 11 00:17:01 ********* /USR/SBIN/CRON[23697]: (root) CMD ( cd / && run-parts --report /etc/cron.hourly) Nov 11 01:17:01 ********* /USR/SBIN/CRON[24195]: (root) CMD ( cd / && run-parts --report /etc/cron.hourly) Nov 11 02:17:01 ********* /USR/SBIN/CRON[24691]: (root) CMD ( cd / && run-parts --report /etc/cron.hourly) Nov 11 03:17:01 ********* /USR/SBIN/CRON[25359]: (root) CMD ( cd / && run-parts --report /etc/cron.hourly) Nov 11 04:06:34 ********* dhclient: DHCPREQUEST on eth0 to *********** port 67 Nov 11 04:06:34 ********* dhclient: DHCPACK from *********** Nov 11 04:06:34 ********* dhclient: bound to *********** -- renewal in 43001 seconds. Nov 11 04:17:01 ********* /USR/SBIN/CRON[25864]: (root) CMD ( cd / && run-parts --report /etc/cron.hourly) Nov 11 05:17:01 ********* /USR/SBIN/CRON[26360]: (root) CMD ( cd / && run-parts --report /etc/cron.hourly) Nov 11 06:17:01 ********* /USR/SBIN/CRON[26857]: (root) CMD ( cd / && run-parts --report /etc/cron.hourly) Nov 11 06:25:01 ********* /USR/SBIN/CRON[26936]: (root) CMD (test -x /usr/sbin/anacron || ( cd / && run-parts --report /etc/cron.daily )) Nov 11 06:25:02 ********* rsyslogd: [origin software="rsyslogd" swVersion="4.6.4" x-pid="489" x-info="http://www.rsyslog.com"] rsyslogd was HUPed, type 'lightweight'. Nov 11 07:17:01 ********* /USR/SBIN/CRON[27443]: (root) CMD ( cd / && run-parts --report /etc/cron.hourly) Nov 11 08:17:01 ********* /USR/SBIN/CRON[27939]: (root) CMD ( cd / && run-parts --report /etc/cron.hourly) Nov 11 09:17:01 ********* /USR/SBIN/CRON[28453]: (root) CMD ( cd / && run-parts --report /etc/cron.hourly) Nov 11 10:17:01 ********* /USR/SBIN/CRON[28993]: (root) CMD ( cd / && run-parts --report /etc/cron.hourly) Events:
History: +-------+--------+------------+-----------+--------+----------+----------------------------------------------------------------------------------------------------------------------------+------------+-----------+ | id | itemid | clock | timestamp | source | severity | value | logeventid | ns | +-------+--------+------------+-----------+--------+----------+----------------------------------------------------------------------------------------------------------------------------+------------+-----------+ | 14774 | 29729 | 1446733421 | 0 | | 0 | Nov 5 16:23:37 ********* kernel: [15306428.325179] zabbix_agentd invoked oom-killer: gfp_mask=0x201da, order=0, oom_adj=0 | 0 | 521845088 | +-------+--------+------------+-----------+--------+----------+----------------------------------------------------------------------------------------------------------------------------+------------+-----------+ |
| Comments |
| Comment by dimir [ 2015 Nov 12 ] |
|
Fixed in development branch svn://svn.zabbix.com/branches/dev/ZBX-10067 . |
| Comment by Andris Zeila [ 2015 Dec 07 ] |
|
Successfully tested |
| Comment by dimir [ 2015 Dec 11 ] |
|
Fixed in pre-3.0.0alpha5 (r57143). |
[ZBX-10060] Very first records from events and audit tables (with different conditions) are not displayed in frontend Created: 2015 Nov 09 Updated: 2017 May 30 Resolved: 2016 May 09 |
|
| Status: | Closed |
| Project: | ZABBIX BUGS AND ISSUES |
| Component/s: | Frontend (F) |
| Affects Version/s: | 2.4.7rc1, 3.0.0alpha3 |
| Fix Version/s: | None |
| Type: | Incident report | Priority: | Major |
| Reporter: | Oleksii Zagorskyi | Assignee: | Unassigned |
| Resolution: | Duplicate | Votes: | 0 |
| Labels: | audit, cvs, events | ||
| Remaining Estimate: | Not Specified | ||
| Time Spent: | Not Specified | ||
| Original Estimate: | Not Specified | ||
| Issue Links: |
|
||||||||
| Description |
|
Here 2 a bit different issues are described, but I suppose they are related each other. (1) A more specific detail - if you for example have already single different type audit record before creation 2 host groups and see those 2 records, then:
(2) Both subissues reproduced on Zabbix 2.4.7rc1-56357 and Zabbix 3.0.0alpha4-56321 and on Another similar issue ZBX-9497, but it includes pagination and it can be different issue, I cannot be sure here. Another possible related issue is ZBX-9993, because:
|
| Comments |
| Comment by richlv [ 2015 Nov 10 ] |
|
i had noticed last entry missing in the audit view, but assumed it's the same as |
| Comment by Oleksii Zagorskyi [ 2015 Nov 10 ] |
|
It's not reproducible if the very first row (seems affected by filter too) is not older that 3 hours. |
| Comment by richlv [ 2016 May 09 ] |
|
i believe this is a duplicate of |
| Comment by Oleksii Zagorskyi [ 2016 May 09 ] |
|
I'm absolutely ok to close it as duplicate based on your evaluation. |
[ZBX-10028] mention that the event count in ack form is the total count Created: 2015 Oct 30 Updated: 2017 May 30 |
|
| Status: | Open |
| Project: | ZABBIX BUGS AND ISSUES |
| Component/s: | Frontend (F) |
| Affects Version/s: | 3.0.0alpha3 |
| Fix Version/s: | None |
| Type: | Incident report | Priority: | Trivial |
| Reporter: | richlv | Assignee: | Unassigned |
| Resolution: | Unresolved | Votes: | 0 |
| Labels: | acknowledgements, events, usability | ||
| Remaining Estimate: | Not Specified | ||
| Time Spent: | Not Specified | ||
| Original Estimate: | Not Specified | ||
| Description |
|
acknowledge form was redesigned in
the count is actually supposed to be the total count of events that will be affected. |
| Comments |
| Comment by Alexander Vladishev [ 2015 Nov 03 ] |
|
Maybe the text should be: N events to acknowledge or N events will be acknowledged |
[ZBX-9939] wrong events (ok|problem) for item(trapper) sending via zabbix_sender in the same time Created: 2015 Oct 06 Updated: 2017 May 30 Resolved: 2016 Sep 30 |
|
| Status: | Closed |
| Project: | ZABBIX BUGS AND ISSUES |
| Component/s: | Server (S) |
| Affects Version/s: | 2.4.5 |
| Fix Version/s: | None |
| Type: | Incident report | Priority: | Blocker |
| Reporter: | Natalia Kagan | Assignee: | Unassigned |
| Resolution: | Duplicate | Votes: | 0 |
| Labels: | events, triggers | ||
| Remaining Estimate: | Not Specified | ||
| Time Spent: | Not Specified | ||
| Original Estimate: | Not Specified | ||
| Environment: |
zabbix 2.4.4 on centos 6 |
||
| Attachments: |
|
||||||||
| Issue Links: |
|
||||||||
| Description |
|
Hi, We have a problem once two text messages (first is "problem" and the second is "ok") are sending via zabbix_sender from the same host to item(trapper) in the same time, zabbix create triggers in wrong order (the last one "problem") but in latest data it appeared correct. |
| Comments |
| Comment by Oleksii Zagorskyi [ 2015 Oct 07 ] | |||||||||||||||||||||||||||||||||||||||||||||||||||||||||||||||||||||||||||||||||||||||||||||||
|
Custom trigger severity colors, a bit different style of frontend, supposedly customized. Taking into account that values are multiline ones, it's not possible to send from single input file, but still, to be sure: We don't see other possibly existing triggers and don't see full trigger name when it expanded on events page. Does this trigger have "multiple problem events generation" enabled? Please do not to hide too much information next time, to not force us to guess Could be related to ZBX-9432. | |||||||||||||||||||||||||||||||||||||||||||||||||||||||||||||||||||||||||||||||||||||||||||||||
| Comment by Natalia Kagan [ 2015 Oct 07 ] | |||||||||||||||||||||||||||||||||||||||||||||||||||||||||||||||||||||||||||||||||||||||||||||||
|
Sorry, will try to provide more details next time I am able to reproduce the issue: on host "server141" (centos 6.4) I run 2 zabbix_sender commands in the same time: %/usr/bin/zabbix_sender -c /etc/zabbix/zabbix_agentd.conf -k 'key[LPTRAP_60_]' -o severity:Warning; /usr/bin/zabbix_sender -c /etc/zabbix/zabbix_agentd.conf -k 'key[LPTRAP_60_]' -o severity:normal info from server: "processed: 1; failed: 0; total: 1; seconds spent: 0.000040" sent: 1; skipped: 0; total: 1 info from server: "processed: 1; failed: 0; total: 1; seconds spent: 0.000036" sent: 1; skipped: 0; total: 1 key[LPTRAP_60_] is a part of LLD, item type "Zabbix trapper" ,
trigger (with Multiple PROBLEM events generation):
    Warning {server141:key[LPTRAP_60_].regexp(severity:Warning)}=1
    Minor {server141:key[LPTRAP_60_].regexp(severity:Minor)}=1
    Major {server141:key[LPTRAP_60_].regexp(severity:Major)}=1
    Critical {server141:key[LPTRAP_60_].regexp(severity:Critical)}=1
in latest data I have :
in Monitoring-> triggers :
in Monitoring -> events (as you can see - trigger status is "PROBLEM" but should be "OK")::
If I send zabbix_sender separate (one after other): %/usr/bin/zabbix_sender -c /etc/zabbix/zabbix_agentd.conf -k 'key[LPTRAP_60_]' -o severity:Warning info from server: "processed: 1; failed: 0; total: 1; seconds spent: 0.000044" sent: 1; skipped: 0; total: 1 %/usr/bin/zabbix_sender -c /etc/zabbix/zabbix_agentd.conf -k 'key[LPTRAP_60_]' -o severity:normal info from server: "processed: 1; failed: 0; total: 1; seconds spent: 0.000030" sent: 1; skipped: 0; total: 1 in Monitoring -> events : there is no problem (trigger status is "OK"):
Let me know if you need more details Many Thanks for the help! | |||||||||||||||||||||||||||||||||||||||||||||||||||||||||||||||||||||||||||||||||||||||||||||||
| Comment by Oleksii Zagorskyi [ 2015 Oct 07 ] | |||||||||||||||||||||||||||||||||||||||||||||||||||||||||||||||||||||||||||||||||||||||||||||||
|
Ho many DB syncers do you have? | |||||||||||||||||||||||||||||||||||||||||||||||||||||||||||||||||||||||||||||||||||||||||||||||
| Comment by Natalia Kagan [ 2015 Oct 07 ] | |||||||||||||||||||||||||||||||||||||||||||||||||||||||||||||||||||||||||||||||||||||||||||||||
|
20 DB syncers | |||||||||||||||||||||||||||||||||||||||||||||||||||||||||||||||||||||||||||||||||||||||||||||||
| Comment by Oleksii Zagorskyi [ 2015 Oct 07 ] | |||||||||||||||||||||||||||||||||||||||||||||||||||||||||||||||||||||||||||||||||||||||||||||||
|
Do you want to say that you sent those 2 values to a zabbix_proxy? Not sure it can be related to your case, just FYI | |||||||||||||||||||||||||||||||||||||||||||||||||||||||||||||||||||||||||||||||||||||||||||||||
| Comment by Natalia Kagan [ 2015 Oct 07 ] | |||||||||||||||||||||||||||||||||||||||||||||||||||||||||||||||||||||||||||||||||||||||||||||||
|
Yes.correct. I send it to proxy. Not sure that it relevant since in latest data I see it in correct order. | |||||||||||||||||||||||||||||||||||||||||||||||||||||||||||||||||||||||||||||||||||||||||||||||
| Comment by Oleksii Zagorskyi [ 2015 Oct 07 ] | |||||||||||||||||||||||||||||||||||||||||||||||||||||||||||||||||||||||||||||||||||||||||||||||
|
Could you try to reproduce it creating only one regular item and trigger, not LLD ones ? | |||||||||||||||||||||||||||||||||||||||||||||||||||||||||||||||||||||||||||||||||||||||||||||||
| Comment by Marc [ 2015 Oct 07 ] | |||||||||||||||||||||||||||||||||||||||||||||||||||||||||||||||||||||||||||||||||||||||||||||||
|
I'm wondering whether it could be related to ZBX-6942. | |||||||||||||||||||||||||||||||||||||||||||||||||||||||||||||||||||||||||||||||||||||||||||||||
| Comment by Natalia Kagan [ 2015 Oct 08 ] | |||||||||||||||||||||||||||||||||||||||||||||||||||||||||||||||||||||||||||||||||||||||||||||||
|
it's not happened to regular item and trigger, the problem only for LLD one but it's not happened every time but very often I create the regular item and trigger on the same host and did the test : sending to LLD one : % /usr/bin/zabbix_sender -c /etc/zabbix/zabbix_agentd.conf -k 'key[LPTRAP_60_]' -o severity:Warning;/usr/bin/zabbix_sender -c /etc/zabbix/zabbix_agentd.conf -k 'key[LPTRAP_60_]' -o severity:normal;/usr/bin/zabbix_sender -c /etc/zabbix/zabbix_agentd.conf -k 'key[LPTRAP_60_]' -o severity:Warning;/usr/bin/zabbix_sender -c /etc/zabbix/zabbix_agentd.conf -k 'key[LPTRAP_60_]' -o severity:normal info from server: "processed: 1; failed: 0; total: 1; seconds spent: 0.000049" sent: 1; skipped: 0; total: 1 info from server: "processed: 1; failed: 0; total: 1; seconds spent: 0.000040" sent: 1; skipped: 0; total: 1 info from server: "processed: 1; failed: 0; total: 1; seconds spent: 0.000057" sent: 1; skipped: 0; total: 1 info from server: "processed: 1; failed: 0; total: 1; seconds spent: 0.000023" sent: 1; skipped: 0; total: 1 sending to regular item: %/usr/bin/zabbix_sender -c /etc/zabbix/zabbix_agentd.conf -k 'key[LPTRAP_60_test]' -o severity:Warning;/usr/bin/zabbix_sender -c /etc/zabbix/zabbix_agentd.conf -k 'key[LPTRAP_60_test]' -o severity:normal;/usr/bin/zabbix_sender -c /etc/zabbix/zabbix_agentd.conf -k 'key[LPTRAP_60_test]' -o severity:Warning;/usr/bin/zabbix_sender -c /etc/zabbix/zabbix_agentd.conf -k 'key[LPTRAP_60_test]' -o severity:normal info from server: "processed: 1; failed: 0; total: 1; seconds spent: 0.000053" sent: 1; skipped: 0; total: 1 info from server: "processed: 1; failed: 0; total: 1; seconds spent: 0.000146" sent: 1; skipped: 0; total: 1 info from server: "processed: 1; failed: 0; total: 1; seconds spent: 0.000036" sent: 1; skipped: 0; total: 1 info from server: "processed: 1; failed: 0; total: 1; seconds spent: 0.000040" sent: 1; skipped: 0; total: 1 in Monitoring -> events :
for regular it's ok :
Thanks | |||||||||||||||||||||||||||||||||||||||||||||||||||||||||||||||||||||||||||||||||||||||||||||||
| Comment by Oleksii Zagorskyi [ 2015 Oct 08 ] | |||||||||||||||||||||||||||||||||||||||||||||||||||||||||||||||||||||||||||||||||||||||||||||||
|
ok, please confirm as for LLD: | |||||||||||||||||||||||||||||||||||||||||||||||||||||||||||||||||||||||||||||||||||||||||||||||
| Comment by Natalia Kagan [ 2015 Oct 09 ] | |||||||||||||||||||||||||||||||||||||||||||||||||||||||||||||||||||||||||||||||||||||||||||||||
|
Correct, only for lld Thanks | |||||||||||||||||||||||||||||||||||||||||||||||||||||||||||||||||||||||||||||||||||||||||||||||
| Comment by Oleksii Zagorskyi [ 2015 Oct 09 ] | |||||||||||||||||||||||||||||||||||||||||||||||||||||||||||||||||||||||||||||||||||||||||||||||
|
When you tested with regular item/trigger - did you create also 4 triggers for the regular item? ok, one more request for test: | |||||||||||||||||||||||||||||||||||||||||||||||||||||||||||||||||||||||||||||||||||||||||||||||
| Comment by Natalia Kagan [ 2015 Oct 12 ] | |||||||||||||||||||||||||||||||||||||||||||||||||||||||||||||||||||||||||||||||||||||||||||||||
|
I created new template with lld (4 triggers) and regular item (4 triggers) assign it to the new host (reporting to the same proxy like the first host) and now I am not able to reproduce the issue (it happened only once) Thanks | |||||||||||||||||||||||||||||||||||||||||||||||||||||||||||||||||||||||||||||||||||||||||||||||
| Comment by Oleksii Zagorskyi [ 2015 Oct 12 ] | |||||||||||||||||||||||||||||||||||||||||||||||||||||||||||||||||||||||||||||||||||||||||||||||
|
Looking to your previous attachments I believe that zabbix server really did something wrong. And I don't like that. Older zabbix server versions had some issues with LLD objects creation (like Bad thing is that this issue is randomly reproducible, so most likely it cannot be related to possibly wrong data in database, but who knows .... All said - IMO. I'd happy to reproduce it but I'm afraid I'd spend a lot of time without success to reproduce it. | |||||||||||||||||||||||||||||||||||||||||||||||||||||||||||||||||||||||||||||||||||||||||||||||
| Comment by Oleksii Zagorskyi [ 2015 Oct 12 ] | |||||||||||||||||||||||||||||||||||||||||||||||||||||||||||||||||||||||||||||||||||||||||||||||
|
If you can reproduce it at least once (even if reproducible randomly) for newly created item/triggers - it's also good results for us, which forces us to consider it seriously. | |||||||||||||||||||||||||||||||||||||||||||||||||||||||||||||||||||||||||||||||||||||||||||||||
| Comment by Natalia Kagan [ 2015 Oct 12 ] | |||||||||||||||||||||||||||||||||||||||||||||||||||||||||||||||||||||||||||||||||||||||||||||||
|
ok, I have bad/good news I did the tests again with attached template (Template app trap test.xml) include : lld (4 triggers) and regular item (4 triggers) and the results are (see in attached file test_results.jpg) : lld from 211 tests trigger was wrong 3 times in order to use my template : for lld, run /usr/bin/zabbix_sender -c /etc/zabbix/zabbix_agentd.conf -k external.lptraps.discovery.test -o "{\"data\":[{\"{#TRAPKEY}\":\"LPTRAP_60_\"}]}" then run : /usr/bin/zabbix_sender -c /etc/zabbix/zabbix_agentd.conf -k 'key[LPTRAP_60_1]' -o severity:Warning; /usr/bin/zabbix_sender -c /etc/zabbix/zabbix_agentd.conf -k 'key[LPTRAP_60_1]' -o severity:normal; /usr/bin/zabbix_sender -c /etc/zabbix/zabbix_agentd.conf -k 'key[LPTRAP_60_1]' -o severity:Warning; /usr/bin/zabbix_sender -c /etc/zabbix/zabbix_agentd.conf -k 'key[LPTRAP_60_1]' -o severity:normal; /usr/bin/zabbix_sender -c /etc/zabbix/zabbix_agentd.conf -k 'key[LPTRAP_60_1]' -o severity:Warning; /usr/bin/zabbix_sender -c /etc/zabbix/zabbix_agentd.conf -k 'key[LPTRAP_60_1]' -o severity:normal; /usr/bin/zabbix_sender -c /etc/zabbix/zabbix_agentd.conf -k 'key[LPTRAP_60_1]' -o severity:Warning; /usr/bin/zabbix_sender -c /etc/zabbix/zabbix_agentd.conf -k 'key[LPTRAP_60_1]' -o severity:normal for regular item : /usr/bin/zabbix_sender -c /etc/zabbix/zabbix_agentd.conf -k 'key[LPTRAP_60_test]' -o severity:Warning; /usr/bin/zabbix_sender -c /etc/zabbix/zabbix_agentd.conf -k 'key[LPTRAP_60_test]' -o severity:normal; /usr/bin/zabbix_sender -c /etc/zabbix/zabbix_agentd.conf -k 'key[LPTRAP_60_test]' -o severity:Warning; /usr/bin/zabbix_sender -c /etc/zabbix/zabbix_agentd.conf -k 'key[LPTRAP_60_test]' -o severity:normal; /usr/bin/zabbix_sender -c /etc/zabbix/zabbix_agentd.conf -k 'key[LPTRAP_60_test]' -o severity:Warning; /usr/bin/zabbix_sender -c /etc/zabbix/zabbix_agentd.conf -k 'key[LPTRAP_60_test]' -o severity:normal; /usr/bin/zabbix_sender -c /etc/zabbix/zabbix_agentd.conf -k 'key[LPTRAP_60_test]' -o severity:Warning; /usr/bin/zabbix_sender -c /etc/zabbix/zabbix_agentd.conf -k 'key[LPTRAP_60_test]' -o severity:normal Let me know if you want me to do more tests btw, I started to work with zabbix in v2.0, then 2.2,2.4,2.4.4 Thanks! | |||||||||||||||||||||||||||||||||||||||||||||||||||||||||||||||||||||||||||||||||||||||||||||||
| Comment by Oleksii Zagorskyi [ 2015 Oct 12 ] | |||||||||||||||||||||||||||||||||||||||||||||||||||||||||||||||||||||||||||||||||||||||||||||||
|
Try please other tests: | |||||||||||||||||||||||||||||||||||||||||||||||||||||||||||||||||||||||||||||||||||||||||||||||
| Comment by Natalia Kagan [ 2015 Oct 12 ] | |||||||||||||||||||||||||||||||||||||||||||||||||||||||||||||||||||||||||||||||||||||||||||||||
|
with one trigger during 200 tests : lld didn't failed looks like it failed from time to time without dependency if it's lld or regular item and how many triggers define | |||||||||||||||||||||||||||||||||||||||||||||||||||||||||||||||||||||||||||||||||||||||||||||||
| Comment by Natalia Kagan [ 2015 Oct 12 ] | |||||||||||||||||||||||||||||||||||||||||||||||||||||||||||||||||||||||||||||||||||||||||||||||
|
with 10 triggers : lld failed 9 times | |||||||||||||||||||||||||||||||||||||||||||||||||||||||||||||||||||||||||||||||||||||||||||||||
| Comment by Oleg Ivanivskyi [ 2016 Apr 30 ] | |||||||||||||||||||||||||||||||||||||||||||||||||||||||||||||||||||||||||||||||||||||||||||||||
|
You can reproduce this issue by sending several values via Zabbix sender at the same time and using "{Zabbix server:test.strlen()}>0" trigger with enabled "Multiple PROBLEM events generation". Commands executed in one go are: zabbix_sender -z 127.0.0.1 -s "Zabbix server" -k test -o 'bal bla' zabbix_sender -z 127.0.0.1 -s "Zabbix server" -k test -o "" zabbix_sender -z 127.0.0.1 -s "Zabbix server" -k test -o "bal bla" zabbix_sender -z 127.0.0.1 -s "Zabbix server" -k test -o "" My environment - Zabbix server 2.4.7, no proxies. | |||||||||||||||||||||||||||||||||||||||||||||||||||||||||||||||||||||||||||||||||||||||||||||||
| Comment by Oleg Ivanivskyi [ 2016 Apr 30 ] | |||||||||||||||||||||||||||||||||||||||||||||||||||||||||||||||||||||||||||||||||||||||||||||||
|
In the DB: +----+--------+----------------------+---------+-----------+ | id | itemid | from_unixtime(clock) | value | ns | +----+--------+----------------------+---------+-----------+ | 9 | 23660 | 2016-04-29 21:00:43 | bal bla | 31162306 | | 10 | 23660 | 2016-04-29 21:00:43 | | 32888625 | | 11 | 23660 | 2016-04-29 21:00:43 | bal bla | 34332592 | | 12 | 23660 | 2016-04-29 21:00:43 | | 35673574 | +----+--------+----------------------+---------+-----------+
| |||||||||||||||||||||||||||||||||||||||||||||||||||||||||||||||||||||||||||||||||||||||||||||||
| Comment by Glebs Ivanovskis (Inactive) [ 2016 May 23 ] | |||||||||||||||||||||||||||||||||||||||||||||||||||||||||||||||||||||||||||||||||||||||||||||||
|
This may happen simply because it's internet and there is no guarantee that values sent with independent zabbix_sender commands will arrive and be processed by server in the same order. Things that might help:
| |||||||||||||||||||||||||||||||||||||||||||||||||||||||||||||||||||||||||||||||||||||||||||||||
| Comment by Natalia Kagan [ 2016 May 25 ] | |||||||||||||||||||||||||||||||||||||||||||||||||||||||||||||||||||||||||||||||||||||||||||||||
|
Hi, there is a problem to provide server log with DebugLevel=4 and tcp dump since I have ~6000 VPS in zabbix server. Thanks! | |||||||||||||||||||||||||||||||||||||||||||||||||||||||||||||||||||||||||||||||||||||||||||||||
| Comment by Glebs Ivanovskis (Inactive) [ 2016 May 25 ] | |||||||||||||||||||||||||||||||||||||||||||||||||||||||||||||||||||||||||||||||||||||||||||||||
|
Dear Natalia, since there is nothing specific about your installation and the issue can be reproduced there is no need to increase debug log level or capture TCP dump on 6000 NVPS installation. Thank you for the information you've already provided. My comment was addressed to Oleg, because so far I've failed to reproduce the issue myself (but I was using trunk, new history cache implemented in 3.0). I apologise for misleading you. | |||||||||||||||||||||||||||||||||||||||||||||||||||||||||||||||||||||||||||||||||||||||||||||||
| Comment by Natalia Kagan [ 2016 May 25 ] | |||||||||||||||||||||||||||||||||||||||||||||||||||||||||||||||||||||||||||||||||||||||||||||||
|
Thanks for the update! | |||||||||||||||||||||||||||||||||||||||||||||||||||||||||||||||||||||||||||||||||||||||||||||||
| Comment by Glebs Ivanovskis (Inactive) [ 2016 May 26 ] | |||||||||||||||||||||||||||||||||||||||||||||||||||||||||||||||||||||||||||||||||||||||||||||||
|
Natalia, few questions for you. As I understand, this issue is randomly reproducible with quite low probability (0-9 failures out of 200 tests) and for both ordinary, templated and LLD items/triggers. This makes me think that trigger evaluation must be correct, but sometimes pre-last value is used instead of last one to evaluate trigger.
I will be very glad to see listings from the database (ids, clocks and ns from history and events) like the one Oleg provided. I think ZBX-6942 is not related. My initial guess about TCP connections not arriving in order can explain OK/PROBLEM order swapping in ZBX-6942, but here we have a miscalculated trigger. And DB listing from Oleg shows that values arrived (and were written to DB) in order. So, minor clock adjustments or discontinuities and/or race condition between history syncers are my best guesses at the moment. | |||||||||||||||||||||||||||||||||||||||||||||||||||||||||||||||||||||||||||||||||||||||||||||||
| Comment by Natalia Kagan [ 2016 May 31 ] | |||||||||||||||||||||||||||||||||||||||||||||||||||||||||||||||||||||||||||||||||||||||||||||||
|
Hi, Sorry for delay. 1. We don't send value to server, only via proxy. We have very complex structure : zabbix agent -> proxy VIP (F5) -> proxy server -> zabbix server VIP (F5) -> zabbix server -> zabbix DB VIP (F5) -> zabbix DB server Could you provide me the query for DB (mysql 5.6) for ids, clocks and ns from history and events ? Oleg was able to reproduce the problem in your env. , so maybe it's not relate to my env. and configuration ... Thanks for your help | |||||||||||||||||||||||||||||||||||||||||||||||||||||||||||||||||||||||||||||||||||||||||||||||
| Comment by Glebs Ivanovskis (Inactive) [ 2016 May 31 ] | |||||||||||||||||||||||||||||||||||||||||||||||||||||||||||||||||||||||||||||||||||||||||||||||
|
No worries! Thank you for the information. Unfortunately, Oleg dropped his environment where he reproduced the issue and his attempt to recreate it were unsuccessful. Can I assume that you know problematic event clock and item/host which generated it? | |||||||||||||||||||||||||||||||||||||||||||||||||||||||||||||||||||||||||||||||||||||||||||||||
| Comment by Glebs Ivanovskis (Inactive) [ 2016 May 31 ] | |||||||||||||||||||||||||||||||||||||||||||||||||||||||||||||||||||||||||||||||||||||||||||||||
|
Just noticed a weird thing in | |||||||||||||||||||||||||||||||||||||||||||||||||||||||||||||||||||||||||||||||||||||||||||||||
| Comment by Natalia Kagan [ 2016 May 31 ] | |||||||||||||||||||||||||||||||||||||||||||||||||||||||||||||||||||||||||||||||||||||||||||||||
|
Yes, description(item.value) is correct but status and severity are wrong | |||||||||||||||||||||||||||||||||||||||||||||||||||||||||||||||||||||||||||||||||||||||||||||||
| Comment by Glebs Ivanovskis (Inactive) [ 2016 Jun 01 ] | |||||||||||||||||||||||||||||||||||||||||||||||||||||||||||||||||||||||||||||||||||||||||||||||
|
Hi! Sorry for a delay. Query should look like this (you need to choose appropriate history table and replace HOSTNAME, ITEM_NAME and TIMESTAMP): select e.*, hi.* from events as e, history/history_log/history_str/history_text/history_uint as hi, triggers as t, functions as f, items as i, hosts as ho where ho.name = HOSTNAME and i.name = ITEM_NAME and e.clock = TIMESTAMP and hi.itemid = i.itemid and e.clock = hi.clock and e.ns = hi.ns and e.source = 0 and e.object = 0 and e.objectid = t.triggerid and f.triggerid = t.triggerid and f.itemid = i.itemid; This will return events of all triggers for the item generated at given clock, so you might want to massage the output afterwards. Looking forward to your reply! | |||||||||||||||||||||||||||||||||||||||||||||||||||||||||||||||||||||||||||||||||||||||||||||||
| Comment by Glebs Ivanovskis (Inactive) [ 2016 Jun 01 ] | |||||||||||||||||||||||||||||||||||||||||||||||||||||||||||||||||||||||||||||||||||||||||||||||
|
There is a scenario in which it may happen:
For this to happen order must be changed twice as A and B progress along the pipeline. This is unlikely but not impossible. However, this contradicts Oleg's DB contents where timestamps are in perfect order. That's a pity we can't double-check this! With a small addition to process_hist_data() which adds extra 2 ms to non-empty values it is possible to simulate aforementioned scenario. if ('\0' != *tmp) { av->ts.ns += 2000000; if (1000000000 < av->ts.ns) { av->ts.ns -= 1000000000; av->ts.sec++; } } I send: $ src/zabbix_sender/zabbix_sender -z localhost -p 10051 -s Dummy -k test.trapper -o test && src/zabbix_sender/zabbix_sender -z localhost -p 10051 -s Dummy -k test.trapper -o '' info from server: "processed: 1; failed: 0; total: 1; seconds spent: 0.000138" sent: 1; skipped: 0; total: 1 info from server: "processed: 1; failed: 0; total: 1; seconds spent: 0.000060" sent: 1; skipped: 0; total: 1 This generates two PROBLEM events: select e.*, hi.* from events as e, history_text as hi, triggers as t, functions as f, items as i, hosts as ho where ho.name = 'Dummy' and i.name = 'Test' and hi.itemid = i.itemid and e.source = 0 and e.object = 0 and e.objectid = t.triggerid and f.triggerid = t.triggerid and f.itemid = i.itemid and e.clock = hi.clock and e.ns = hi.ns and e.clock = 1464778041;
eventid | source | object | objectid | clock | value | acknowledged | ns | id | itemid | clock | value | ns
---------+--------+--------+----------+------------+-------+--------------+-----------+-----+--------+------------+-------+-----------
302 | 0 | 0 | 13609 | 1464778041 | 1 | 0 | 960187415 | 236 | 23770 | 1464778041 | test | 960187415
303 | 0 | 0 | 13609 | 1464778041 | 1 | 0 | 959718399 | 237 | 23770 | 1464778041 | | 959718399
(2 rows)
| |||||||||||||||||||||||||||||||||||||||||||||||||||||||||||||||||||||||||||||||||||||||||||||||
| Comment by Glebs Ivanovskis (Inactive) [ 2016 Jun 06 ] | |||||||||||||||||||||||||||||||||||||||||||||||||||||||||||||||||||||||||||||||||||||||||||||||
|
Dear Natalia, contents of your DB will still be much appreciated as they can prove or disprove my hypothesis. Also I would like to ask about NTP settings and how it behaves in your setup. Does it adjust clock ticking speed or perform jumps (and how big they are)? Does "hardware clock" of proxy's virtual environment drift away from host machine's clock? | |||||||||||||||||||||||||||||||||||||||||||||||||||||||||||||||||||||||||||||||||||||||||||||||
| Comment by Natalia Kagan [ 2016 Jun 07 ] | |||||||||||||||||||||||||||||||||||||||||||||||||||||||||||||||||||||||||||||||||||||||||||||||
|
Hi, regarding NTP, we have the same ntp.conf on all hosts. %less /etc/ntp.conf | grep -v "^#" | grep -v "^$" restrict default kod nomodify notrap nopeer noquery restrict -6 default kod nomodify notrap nopeer noquery restrict 127.0.0.1 restrict -6 ::1 fudge 127.127.1.0 stratum 10 driftfile /var/lib/ntp/drift keys /etc/ntp/keys server xxx.xxx.xxx.xxx ... I don't have more information, let me know if you need more details regarding the DB data, I am try to running the test now and will update Thanks | |||||||||||||||||||||||||||||||||||||||||||||||||||||||||||||||||||||||||||||||||||||||||||||||
| Comment by Natalia Kagan [ 2016 Jun 13 ] | |||||||||||||||||||||||||||||||||||||||||||||||||||||||||||||||||||||||||||||||||||||||||||||||
|
Good morning, I am not able to reproduce the problem with my test template anymore (:- I will try to reproduce it later again and will update Thanks! | |||||||||||||||||||||||||||||||||||||||||||||||||||||||||||||||||||||||||||||||||||||||||||||||
| Comment by Glebs Ivanovskis (Inactive) [ 2016 Jun 13 ] | |||||||||||||||||||||||||||||||||||||||||||||||||||||||||||||||||||||||||||||||||||||||||||||||
|
Good morning! I'm glad that you are not experiencing the issue any more. I would recommend not to use two sender calls when the order of values is crucial. To be on a safe side it's better to put values in file and call zabbix_sender once. My thoughts on how timekeeping and NTP issues may lead to this situation and ideas how we can improve things are registered as ZBXNEXT-3298. | |||||||||||||||||||||||||||||||||||||||||||||||||||||||||||||||||||||||||||||||||||||||||||||||
| Comment by Natalia Kagan [ 2016 Jun 13 ] | |||||||||||||||||||||||||||||||||||||||||||||||||||||||||||||||||||||||||||||||||||||||||||||||
|
I am not sure that the problem not exists anymore, for real alerts we implement workaround : added "sleep 5" between zabbix_sender, I just not able to reproduce this. We have no control how many/when zabbix_sender should send the value since events are coming from application code (we have very complex solution that using lld trapper) | |||||||||||||||||||||||||||||||||||||||||||||||||||||||||||||||||||||||||||||||||||||||||||||||
| Comment by dimir [ 2016 Sep 27 ] | |||||||||||||||||||||||||||||||||||||||||||||||||||||||||||||||||||||||||||||||||||||||||||||||
OverviewWas able to reproduce the problem. Used trapper item with trigger {Zabbix server:test.strlen()}<3 (with multiple PROBLEM events generation), monitored by proxy, all components of latest 2.2 (2.2.15rc1 r62671). In my case the problem happened when the values sent were ending up in different parcels. In order to guarantee that I had to apply the following change to Zabbix proxy:
Index: include/proxy.h
===================================================================
--- include/proxy.h     (revision 62691)
+++ include/proxy.h     (working copy)
@@ -26,7 +26,8 @@
 #define ZBX_PROXYMODE_ACTIVE   0
 #define ZBX_PROXYMODE_PASSIVE  1

-#define ZBX_MAX_HRECORDS       1000
+//#define ZBX_MAX_HRECORDS     1000
+#define ZBX_MAX_HRECORDS       1

 #define AGENT_VALUE    struct zbx_agent_value_t
This guarantees the history data parcels sent from proxy to server always contain 1 value. I was feeding PROBLEM, OK values sent one by one by pairs using zabbix_sender to the proxy: while true; do for i in a bbb; do bin/zabbix_sender -z 192.168.1.100 -s "Zabbix server" -k test -o $i; done; sleep 3; done
The proxy sets value timestamps as current timestamp. Then the server, when receiving history data is adjusting every value timestamp by the time difference between proxy and server (proxy_timediff), here's what server does for each history data parcel:
Time difference between proxy and server (proxy_timediff) is supposed to guarantee the order of history data flow, but it appears in some cases (network latency) it can, on the contrary, screw the timestamps of values in separate parcels. In the following example 3 pairs of PROBLEM, OK values were sent (that's 6 parcels of "history data", 1 value per parcel). The values of the second pair (3rd and 4th parcels) end up on the server with crossed timestamps, resulting in 3rd value (which is PROBLEM) processed 2 times and 4th not processed at all. This happens because when processing the 4th value the 3rd is still the latest (greater timestamp). Simple view of the problemWhat happens on the serverThis is taken from zabbix_server.log
Detailed view of the problemHistory values sent by proxyzabbix_proxy.log: -- parcel 1 (PROBLEM value)
29682:20160927:152434.271 In send_data_to_server() [{
"request":"history data",
"host":"Zabbix proxy",
"data":[
{
"host":"Zabbix server",
"key":"test",
"clock":1474979070,
"ns":631108357,
"value":"a"}],
"clock":1474979074,
"ns":271853707}]
-- parcel 2 (OK value)
29682:20160927:152435.287 In send_data_to_server() [{
"request":"history data",
"host":"Zabbix proxy",
"data":[
{
"host":"Zabbix server",
"key":"test",
"clock":1474979070,
"ns":636563317,
"value":"bbb"}],
"clock":1474979075,
"ns":287670248}]
-- parcel 3 (PROBLEM value)
29682:20160927:152437.296 In send_data_to_server() [{
"request":"history data",
"host":"Zabbix proxy",
"data":[
{
"host":"Zabbix server",
"key":"test",
"clock":1474979073,
"ns":651108838,
"value":"a"}],
"clock":1474979077,
"ns":296742783}]
-- parcel 4 (OK value)
29682:20160927:152438.309 In send_data_to_server() [{
"request":"history data",
"host":"Zabbix proxy",
"data":[
{
"host":"Zabbix server",
"key":"test",
"clock":1474979073,
"ns":656584887,
"value":"bbb"}],
"clock":1474979078,
"ns":309290537}]
-- parcel 5 (PROBLEM value)
29682:20160927:152442.319 In send_data_to_server() [{
"request":"history data",
"host":"Zabbix proxy",
"data":[
{
"host":"Zabbix server",
"key":"test",
"clock":1474979076,
"ns":681714069,
"value":"a"}],
"clock":1474979082,
"ns":319267404}]
-- parcel 6 (OK value)
29682:20160927:152443.327 In send_data_to_server() [{
"request":"history data",
"host":"Zabbix proxy",
"data":[
{
"host":"Zabbix server",
"key":"test",
"clock":1474979076,
"ns":686862613,
"value":"bbb"}],
"clock":1474979083,
"ns":327434212}]
--
This is the part of the log where server was receiving the parcels. When receiving, server is adjusting value timestamps according to proxy_timediff. Notice how after adjustment the timestamp of 4th parcel becomes in the past from 3rd. History values received by server from proxyzabbix_server.log: -- parcel 1 (PROBLEM value)
"clock":1474979070,
"ns":631108357,
"value":"a"}],
29645:20160927:152434.280 DIMIR: proxy_timediff: 0.009 sec
29645:20160927:152434.280 DIMIR: process_hist_data() after proxy_timediff adjustment [ a] 1474979070.639617587
-- parcel 2 (OK value)
"clock":1474979070,
"ns":636563317,
"value":"bbb"}],
29644:20160927:152435.292 DIMIR: proxy_timediff: 0.005 sec
29644:20160927:152435.292 DIMIR: process_hist_data() after proxy_timediff adjustment [bbb] 1474979070.641515576 <-- all good: after proxy_timediff adjustment the second value is still in the future from the first
-- parcel 3 (PROBLEM value)
"clock":1474979073,
"ns":651108838,
"value":"a"}],
29642:20160927:152437.305 DIMIR: proxy_timediff: 0.009 sec
29642:20160927:152437.305 DIMIR: process_hist_data() after proxy_timediff adjustment [ a] 1474979073.659902111
-- parcel 4 (OK value, but after server adjusted value timestamp it ends up before 3rd value!)
"clock":1474979073,
"ns":656584887,
"value":"bbb"}],
29641:20160927:152438.311 DIMIR: proxy_timediff: 0.002 sec <-- BUG: proxy_timediff of the second parcel is much smaller than the first (0.009), the difference is 0.007 seconds, while the difference of value timestamps is just 0.005!
29641:20160927:152438.311 DIMIR: process_hist_data() after proxy_timediff adjustment [bbb] 1474979073.658875417 <-- BUG: after proxy_timediff adjustment the second value is in the past from the first!
-- parcel 5 (PROBLEM value)
"clock":1474979076,
"ns":681714069,
"value":"a"}],
29641:20160927:152442.324 DIMIR: proxy_timediff: 0.005 sec
29641:20160927:152442.324 DIMIR: process_hist_data() after proxy_timediff adjustment [ a] 1474979076.686639954
-- parcel 6 (OK value)
"clock":1474979076,
"ns":686862613,
"value":"bbb"}],
29641:20160927:152443.330 DIMIR: proxy_timediff: 0.003 sec
29641:20160927:152443.330 DIMIR: process_hist_data() after proxy_timediff adjustment [bbb] 1474979076.689605427 <-- all good: after proxy_timediff adjustment the second value is still in the future from the first
--
Proxy history tablemysql> select *,from_unixtime(clock) from proxy_history where clock between 1474979070 and 1474979076 order by clock,ns; +------+--------+------------+-----------+--------+----------+-------+------------+-----------+-------+----------------------+ | id | itemid | clock | timestamp | source | severity | value | logeventid | ns | state | from_unixtime(clock) | +------+--------+------------+-----------+--------+----------+-------+------------+-----------+-------+----------------------+ | 1719 | 23661 | 1474979070 | 0 | | 0 | a | 0 | 631108357 | 0 | 2016-09-27 15:24:30 | | 1720 | 23661 | 1474979070 | 0 | | 0 | bbb | 0 | 636563317 | 0 | 2016-09-27 15:24:30 | | 1721 | 23661 | 1474979073 | 0 | | 0 | a | 0 | 651108838 | 0 | 2016-09-27 15:24:33 | | 1722 | 23661 | 1474979073 | 0 | | 0 | bbb | 0 | 656584887 | 0 | 2016-09-27 15:24:33 | | 1723 | 23661 | 1474979076 | 0 | | 0 | a | 0 | 681714069 | 0 | 2016-09-27 15:24:36 | | 1724 | 23661 | 1474979076 | 0 | | 0 | bbb | 0 | 686862613 | 0 | 2016-09-27 15:24:36 | +------+--------+------------+-----------+--------+----------+-------+------------+-----------+-------+----------------------+ 6 rows in set (0.00 sec) Server history table (order of 3rd and 4th values is screwed)mysql> select * from history_str where clock between 1474979070 and 1474979076 order by clock,ns; +--------+------------+-------+-----------+ | itemid | clock | value | ns | +--------+------------+-------+-----------+ | 23661 | 1474979070 | a | 639617587 | | 23661 | 1474979070 | bbb | 641515576 | | 23661 | 1474979073 | bbb | 658875417 | | 23661 | 1474979073 | a | 659902111 | | 23661 | 1474979076 | a | 686639954 | | 23661 | 1474979076 | bbb | 689605427 | +--------+------------+-------+-----------+ 6 rows in set (0.00 sec) Event generation29653:20160927:152435.560 query [txnlev:1] [insert into events (eventid,source,object,objectid,clock,ns,value) values (38638,0,0,13558,1474979070,639617587,1); 29652:20160927:152440.548 query [txnlev:1] [insert into events (eventid,source,object,objectid,clock,ns,value) values (38639,0,0,13558,1474979070,641515576,0); 29652:20160927:152440.553 query [txnlev:1] [insert into events (eventid,source,object,objectid,clock,ns,value) values (38640,0,0,13558,1474979073,659902111,1); 29652:20160927:152440.556 query [txnlev:1] [insert into events (eventid,source,object,objectid,clock,ns,value) values (38641,0,0,13558,1474979073,658875417,1); <-- BUG 29652:20160927:152445.558 query [txnlev:1] [insert into events (eventid,source,object,objectid,clock,ns,value) values (38642,0,0,13558,1474979076,686639954,1); 29652:20160927:152445.565 query [txnlev:1] [insert into events (eventid,source,object,objectid,clock,ns,value) values (38643,0,0,13558,1474979076,689605427,0); Trigger changes-- 29653:20160927:152435.560 In process_trigger() triggerid:13558 value:0(0) new_value:1 29653:20160927:152435.560 query [txnlev:1] [update triggers set lastchange=1474979070,value=1 where triggerid=13558; -- 29652:20160927:152440.548 In process_trigger() triggerid:13558 value:1(0) new_value:0 29652:20160927:152440.548 query [txnlev:1] [update triggers set lastchange=1474979070,value=0 where triggerid=13558; -- 29652:20160927:152440.553 In process_trigger() triggerid:13558 value:0(0) new_value:1 29652:20160927:152440.553 query [txnlev:1] [update triggers set lastchange=1474979073,value=1 where triggerid=13558; -- 29652:20160927:152440.555 In process_trigger() triggerid:13558 value:1(0) new_value:1 29652:20160927:152440.555 query [txnlev:1] [update triggers set lastchange=1474979073 where triggerid=13558; <-- BUG, value is still 1 -- 29652:20160927:152445.558 In process_trigger() triggerid:13558 value:1(0) new_value:1 29652:20160927:152445.558 query [txnlev:1] [update triggers set lastchange=1474979076 where triggerid=13558; -- 29652:20160927:152445.565 In process_trigger() triggerid:13558 value:1(0) new_value:0 29652:20160927:152445.565 query [txnlev:1] [update triggers set lastchange=1474979076,value=0 where triggerid=13558; -- Trigger expression evaluation--
29653:20160927:152435.559 End of zbx_vc_get_value_range():SUCCEED count:1 cached:1
29653:20160927:152435.560 End of evaluate_function():SUCCEED value:'1'
29653:20160927:152435.560 zbx_substitute_functions_results() expression[0]:'{13165}<3' => '1<3'
--
29652:20160927:152440.547 End of zbx_vc_get_value_range():SUCCEED count:1 cached:1
29652:20160927:152440.547 End of evaluate_function():SUCCEED value:'3'
29652:20160927:152440.547 zbx_substitute_functions_results() expression[0]:'{13165}<3' => '3<3'
--
29652:20160927:152440.553 End of zbx_vc_get_value_range():SUCCEED count:1 cached:1
29652:20160927:152440.553 End of evaluate_function():SUCCEED value:'1'
29652:20160927:152440.553 zbx_substitute_functions_results() expression[0]:'{13165}<3' => '1<3'
--
29652:20160927:152440.555 End of zbx_vc_get_value_range():SUCCEED count:1 cached:1
29652:20160927:152440.555 End of evaluate_function():SUCCEED value:'1'
29652:20160927:152440.555 zbx_substitute_functions_results() expression[0]:'{13165}<3' => '1<3'
--
29652:20160927:152445.558 End of zbx_vc_get_value_range():SUCCEED count:1 cached:1
29652:20160927:152445.558 End of evaluate_function():SUCCEED value:'1'
29652:20160927:152445.558 zbx_substitute_functions_results() expression[0]:'{13165}<3' => '1<3'
--
29652:20160927:152445.565 End of zbx_vc_get_value_range():SUCCEED count:1 cached:1
29652:20160927:152445.565 End of evaluate_function():SUCCEED value:'3'
29652:20160927:152445.565 zbx_substitute_functions_results() expression[0]:'{13165}<3' => '3<3'
--
Monitoring ->Events
| |||||||||||||||||||||||||||||||||||||||||||||||||||||||||||||||||||||||||||||||||||||||||||||||
| Comment by dimir [ 2016 Sep 28 ] | |||||||||||||||||||||||||||||||||||||||||||||||||||||||||||||||||||||||||||||||||||||||||||||||
|
The problem happens because of inefficient proxy/server time difference calculation. I believe this was partly fixed in From the latest versions I could not reproduce my scenario on other than 2.2. | |||||||||||||||||||||||||||||||||||||||||||||||||||||||||||||||||||||||||||||||||||||||||||||||
| Comment by Veeresh K [ 2016 Sep 29 ] | |||||||||||||||||||||||||||||||||||||||||||||||||||||||||||||||||||||||||||||||||||||||||||||||
|
I am probably hitting the same issue. I have two trapper items, (numeric/unsigned), I am sending data for same via protobix (python lib). The values does get updated in zabbix, however the triggers dont generate (triggers are checking if last value is non zero). This is happening in lan env with nvps of about 37. I am on 3.0.4. However if I send the same data again, the triggers are generated. | |||||||||||||||||||||||||||||||||||||||||||||||||||||||||||||||||||||||||||||||||||||||||||||||
| Comment by Glebs Ivanovskis (Inactive) [ 2016 Sep 29 ] | |||||||||||||||||||||||||||||||||||||||||||||||||||||||||||||||||||||||||||||||||||||||||||||||
|
Dear vkhanorkar, if it's a newly created trigger you are probably not waiting enough for the server to update configuration from database. I don't think your problem is related to this one. <dimir> Moreover, this issue is already fixed (at least partly) in 3.0.4. | |||||||||||||||||||||||||||||||||||||||||||||||||||||||||||||||||||||||||||||||||||||||||||||||
| Comment by Veeresh K [ 2016 Sep 29 ] | |||||||||||||||||||||||||||||||||||||||||||||||||||||||||||||||||||||||||||||||||||||||||||||||
|
@Glebs, Let me explain further. The first time the item value changes to nonzero to zero or vice versa, the trigger is not updated. But the next time, such value is updated, the triggers gets created immediately. Regarding waiting, the trigger was observed for about 3-4 minutes, but was nt updated. However once the same value was sent again, the trigger was generated immediately. | |||||||||||||||||||||||||||||||||||||||||||||||||||||||||||||||||||||||||||||||||||||||||||||||
| Comment by Glebs Ivanovskis (Inactive) [ 2016 Sep 29 ] | |||||||||||||||||||||||||||||||||||||||||||||||||||||||||||||||||||||||||||||||||||||||||||||||
|
Dear vkhanorkar, you didn't get my point. How much time passes between creation of trigger and the moment of sending new value that is supposed to generate event. If the server wasn't aware of the existence of the trigger, that explains why it passed the value through itself without generating an event. | |||||||||||||||||||||||||||||||||||||||||||||||||||||||||||||||||||||||||||||||||||||||||||||||
| Comment by Alexander Vladishev [ 2016 Sep 30 ] | |||||||||||||||||||||||||||||||||||||||||||||||||||||||||||||||||||||||||||||||||||||||||||||||
|
Closed as duplicate of |
[ZBX-9774] Bad performance when accessing Events without permission to any hosts Created: 2015 Aug 11 Updated: 2024 Jan 23 Resolved: 2024 Jan 23 |
|
| Status: | Closed |
| Project: | ZABBIX BUGS AND ISSUES |
| Component/s: | API (A) |
| Affects Version/s: | 2.2.10, 3.0.2 |
| Fix Version/s: | None |
| Type: | Problem report | Priority: | Trivial |
| Reporter: | Marc | Assignee: | Alexander Vladishev |
| Resolution: | Duplicate | Votes: | 0 |
| Labels: | events, performance, permissions | ||
| Remaining Estimate: | Not Specified | ||
| Time Spent: | Not Specified | ||
| Original Estimate: | Not Specified | ||
| Environment: |
PostgreSQL 9.3.5 |
||
| Attachments: |
|
||||
| Issue Links: |
|
||||
| Sprint: | Sprint 4 | ||||
| Story Points: | 4 | ||||
| Description |
|
There appears to be a significant performance impact when accessing Monitoring->Events without having permission to any host. See attached query plans for details. I presume you're already aware of http://explain.depesz.com for easier interpretation of pg query plans but I mention it anyway - just in case you're not |
| Comments |
| Comment by Oleksii Zagorskyi [ 2016 Jul 19 ] |
|
There is a confirmation that it's actual on 3.0.2 too, so adding it to Affect versions. PG is 9.3 |
| Comment by Oleksii Zagorskyi [ 2016 Jul 19 ] |
|
As I see, value for "Rows Removed by Filter:" and "loops" from such explain equals value get by SQL "select count(*) from events e where e.object='0' AND e.source='0';" |
| Comment by Maksims Tarleckis (Inactive) [ 2017 Apr 05 ] |
|
Issue not only related to SQL query performance but also related to trigger permission issue Steps to reproduce:
case 1
case 2
ACTUAL RESULT: case 3
A/E RESULT: quick response without any events case 4
ACTUAL RESULT: case 5
ACTUAL RESULT: case 6
A/E: show events by trigger2 |
| Comment by Oleksii Zagorskyi [ 2017 Apr 24 ] |
|
Guys, is this issue actual only for Postgres backend or for MySQL too? |
| Comment by Maksims Tarleckis (Inactive) [ 2017 Apr 24 ] |
|
zalex_ua |
| Comment by Alexander Vladishev [ 2024 Jan 23 ] |
|
Fixed as part of |
[ZBX-9497] "All" of time slider doesn't show all events on Monitoring -> Events page Created: 2015 Apr 20 Updated: 2019 Dec 10 |
|
| Status: | Open |
| Project: | ZABBIX BUGS AND ISSUES |
| Component/s: | Frontend (F) |
| Affects Version/s: | 2.2.9 |
| Fix Version/s: | None |
| Type: | Incident report | Priority: | Trivial |
| Reporter: | Kodai Terashima | Assignee: | Unassigned |
| Resolution: | Unresolved | Votes: | 0 |
| Labels: | events, pagination, timeperiodselection | ||
| Remaining Estimate: | Not Specified | ||
| Time Spent: | Not Specified | ||
| Original Estimate: | Not Specified | ||
| Attachments: |
|
||||
| Issue Links: |
|
||||
| Description |
|
Please see the attached screenshots,
It seems that paging doesn't calculate stime or period correctly. |
| Comments |
| Comment by richlv [ 2015 Apr 20 ] |
|
maybe related to zalex_ua I don't think so (although I'm not sure) because I've just tested the dev branch (it's still waiting review) in a hope that it will fix a I think that the |
| Comment by Aleksandrs Saveljevs [ 2016 Oct 24 ] |
|
Related issue: |
[ZBX-9443] Time filter for events may jump back to current month Created: 2015 Mar 29 Updated: 2019 Dec 10 |
|
| Status: | Open |
| Project: | ZABBIX BUGS AND ISSUES |
| Component/s: | Frontend (F) |
| Affects Version/s: | 2.2.9 |
| Fix Version/s: | None |
| Type: | Incident report | Priority: | Trivial |
| Reporter: | Marc | Assignee: | Unassigned |
| Resolution: | Unresolved | Votes: | 0 |
| Labels: | events, filter, timeperiod | ||
| Remaining Estimate: | Not Specified | ||
| Time Spent: | Not Specified | ||
| Original Estimate: | Not Specified | ||
| Description |
|
When selecting a filter period that ends in the previous month on a day that is valid for the current month as well, then the filter gets set to the day in the current month while keeping the period. |
| Comments |
| Comment by Marc [ 2015 Apr 08 ] |
|
Apparently it's not reproducible anymore. Strange.... possibly it is/was a time-depending issue. |
[ZBX-9432] Multiple consecutive events the same type (OK or PROBLEM) Created: 2015 Mar 25 Updated: 2019 Dec 10 |
|
| Status: | Open |
| Project: | ZABBIX BUGS AND ISSUES |
| Component/s: | Proxy (P), Server (S) |
| Affects Version/s: | 2.4.3 |
| Fix Version/s: | None |
| Type: | Incident report | Priority: | Trivial |
| Reporter: | Maris Danne | Assignee: | Unassigned |
| Resolution: | Unresolved | Votes: | 7 |
| Labels: | delay, events, multiple, proxy | ||
| Remaining Estimate: | Not Specified | ||
| Time Spent: | Not Specified | ||
| Original Estimate: | Not Specified | ||
| Attachments: |
|
||||||||||||||||
| Issue Links: |
|
||||||||||||||||
| Description |
|
I'm monitoring hosts (discovored by host prototype) by Proxy. One day I observed that events act strange. It looks like zabbix server is just generating events, like the trigged had a check mark for multiple events generation. I'm confused because on the other zabbix server (no proxy) we monitor the same hosts with the same templates, but there is no problem with the events.
|
| Comments |
| Comment by richlv [ 2015 Mar 25 ] |
|
what's the item type for the xen.sysuptime item ? |
| Comment by Maris Danne [ 2015 Mar 25 ] |
|
It's SNMPv2 agent. |
| Comment by Oleksii Zagorskyi [ 2015 Mar 26 ] |
|
2nd column is "Host" and we see that they are different. It looks more like support request but not a bug report. |
| Comment by richlv [ 2015 Mar 26 ] |
|
i'd agree with zalex. we can't even see full hostnames to verify the source of the events. sounds like support options should be evaluated at https://www.zabbix.org/wiki/Getting_help |
| Comment by Raimonds Treimanis [ 2015 Mar 26 ] |
|
Tehere are 4 xen hosts and all of them have same problem. Thats why you see different hostnames in event source. I can attach screenshoty with full hostanmes if it helps... |
| Comment by richlv [ 2015 Mar 26 ] |
|
screenshot showing duplicate hostnames would be beneficial, yes. |
| Comment by Raimonds Treimanis [ 2015 Mar 26 ] |
|
Hostnames are not duplicate, there are something wrong with events. |
| Comment by Oleksii Zagorskyi [ 2015 Mar 26 ] |
|
So, we see 4 different hosts and 2 PROBLEM events for every host I suppose it's duplicate of |
| Comment by Raimonds Treimanis [ 2015 Mar 26 ] |
|
As i see |
| Comment by Raimonds Treimanis [ 2015 Mar 28 ] |
|
Today got more of those events, screenshots 2 and 3. 5 OK events per host followed by same amount of PROBLEM events, every minute.
|
| Comment by Oleksii Zagorskyi [ 2015 May 12 ] |
|
|
| Comment by Oleksii Zagorskyi [ 2015 Aug 13 ] |
|
Just in case , see also ZBX-8556. |
| Comment by Chris Christensen [ 2015 Dec 08 ] |
|
Observed a similar situation on our install - it looks like only OK events are being recorded multiple times, but it was on a singe host with a count item:
Raw values: 2015-12-06 15:08:10 1449439690 1 2015-12-06 15:07:10 1449439630 1 2015-12-06 15:06:09 1449439569 1 2015-12-06 15:05:09 1449439509 1 2015-12-06 15:04:09 1449439449 1 2015-12-06 15:03:09 1449439389 1 2015-12-06 15:02:09 1449439329 1 2015-12-06 15:01:10 1449439270 1 2015-12-06 15:00:09 1449439209 1 2015-12-06 14:59:09 1449439149 1 2015-12-06 14:58:09 1449439089 1 2015-12-06 14:57:09 1449439029 1 2015-12-06 14:56:09 1449438969 1 2015-12-06 14:55:09 1449438909 1 2015-12-06 14:54:09 1449438849 1 2015-12-06 14:53:09 1449438789 1 2015-12-06 14:52:09 1449438729 1 2015-12-06 14:51:09 1449438669 1 2015-12-06 14:50:09 1449438609 1 2015-12-06 14:49:10 1449438550 1 2015-12-06 14:48:09 1449438489 1 2015-12-06 14:47:09 1449438429 1 2015-12-06 14:46:09 1449438369 1 2015-12-06 14:45:09 1449438309 1 2015-12-06 14:44:09 1449438249 1 2015-12-06 14:43:09 1449438189 1 2015-12-06 14:42:09 1449438129 1 2015-12-06 14:41:09 1449438069 1 2015-12-06 14:40:09 1449438009 1 2015-12-06 14:39:09 1449437949 1 2015-12-06 14:38:09 1449437889 1 2015-12-06 14:37:10 1449437830 1 2015-12-06 14:36:09 1449437769 1 2015-12-06 14:35:09 1449437709 1 2015-12-06 14:34:09 1449437649 1 2015-12-06 14:33:09 1449437589 1 2015-12-06 14:32:09 1449437529 1 2015-12-06 14:31:09 1449437469 1 2015-12-06 14:30:09 1449437409 1 2015-12-06 14:29:09 1449437349 1 2015-12-06 14:28:09 1449437289 1 2015-12-06 14:27:09 1449437229 1 2015-12-06 14:26:09 1449437169 1 2015-12-06 14:25:09 1449437109 1 2015-12-06 14:24:09 1449437049 1 2015-12-06 14:23:10 1449436990 1 2015-12-06 14:22:10 1449436930 1 2015-12-06 14:21:09 1449436869 1 2015-12-06 14:20:09 1449436809 1 2015-12-06 14:19:09 1449436749 1 2015-12-06 14:18:09 1449436689 1 2015-12-06 14:17:10 1449436630 1 2015-12-06 14:16:09 1449436569 1 2015-12-06 14:15:09 1449436509 1 2015-12-06 14:14:09 1449436449 1 2015-12-06 14:13:09 1449436389 1 2015-12-06 14:12:10 1449436330 1 2015-12-06 14:11:09 1449436269 1 2015-12-06 14:10:09 1449436209 1 2015-12-06 14:09:09 1449436149 1 2015-12-06 14:08:09 1449436089 1 2015-12-06 14:07:09 1449436029 1 2015-12-06 14:06:09 1449435969 1 2015-12-06 14:05:09 1449435909 1 2015-12-06 14:04:09 1449435849 1 2015-12-06 14:03:09 1449435789 1 2015-12-06 14:02:09 1449435729 1 2015-12-06 14:01:09 1449435669 1 2015-12-06 14:00:09 1449435609 1 2015-12-06 13:59:10 1449435550 1 2015-12-06 13:58:09 1449435489 1 2015-12-06 13:57:09 1449435429 1 2015-12-06 13:56:09 1449435369 1 2015-12-06 13:55:09 1449435309 1 2015-12-06 13:54:09 1449435249 1 2015-12-06 13:53:09 1449435189 1 2015-12-06 13:52:09 1449435129 1 2015-12-06 13:51:09 1449435069 1 2015-12-06 13:50:09 1449435009 1 2015-12-06 13:49:09 1449434949 1 2015-12-06 13:48:09 1449434889 1 2015-12-06 13:47:09 1449434829 1 2015-12-06 13:46:09 1449434769 1 2015-12-06 13:45:09 1449434709 1 2015-12-06 13:44:09 1449434649 1 2015-12-06 13:43:09 1449434589 1 2015-12-06 13:42:09 1449434529 1 2015-12-06 13:41:10 1449434470 1 2015-12-06 13:40:09 1449434409 1 2015-12-06 13:39:09 1449434349 1 2015-12-06 13:38:09 1449434289 1 2015-12-06 13:37:09 1449434229 1 2015-12-06 13:36:09 1449434169 1 2015-12-06 13:35:09 1449434109 1 2015-12-06 13:34:10 1449434050 1 2015-12-06 13:33:10 1449433990 1 2015-12-06 13:32:09 1449433929 1 2015-12-06 13:31:09 1449433869 1 2015-12-06 13:30:09 1449433809 1 2015-12-06 13:29:09 1449433749 1 2015-12-06 13:28:09 1449433689 1 2015-12-06 13:27:09 1449433629 1 2015-12-06 13:26:09 1449433569 1 2015-12-06 13:25:09 1449433509 1 2015-12-06 13:24:10 1449433450 1 2015-12-06 13:23:09 1449433389 1 2015-12-06 13:22:09 1449433329 1 2015-12-06 13:21:09 1449433269 1 2015-12-06 13:20:09 1449433209 0 2015-12-06 13:19:09 1449433149 0 2015-12-06 13:18:09 1449433089 0 2015-12-06 13:17:10 1449433030 0 2015-12-06 13:16:09 1449432969 0 2015-12-06 13:15:09 1449432909 0 2015-12-06 13:14:09 1449432849 0 2015-12-06 13:13:09 1449432789 0 2015-12-06 13:12:09 1449432729 0 2015-12-06 13:11:10 1449432670 0 2015-12-06 13:10:09 1449432609 0 2015-12-06 13:09:09 1449432549 0 2015-12-06 13:08:09 1449432489 0 2015-12-06 13:07:09 1449432429 0 2015-12-06 13:06:09 1449432369 0 2015-12-06 13:05:09 1449432309 0 2015-12-06 13:04:09 1449432249 0 2015-12-06 13:03:09 1449432189 0 2015-12-06 13:02:09 1449432129 0 2015-12-06 13:01:09 1449432069 0 2015-12-06 13:00:09 1449432009 0 2015-12-06 12:59:09 1449431949 0 2015-12-06 12:58:09 1449431889 0 2015-12-06 12:57:10 1449431830 0 2015-12-06 12:56:09 1449431769 0 2015-12-06 12:55:10 1449431710 0 2015-12-06 12:54:09 1449431649 0 2015-12-06 12:53:09 1449431589 0 2015-12-06 12:52:09 1449431529 0 2015-12-06 12:51:09 1449431469 0 2015-12-06 12:50:09 1449431409 0 2015-12-06 12:49:09 1449431349 0 2015-12-06 12:48:09 1449431289 0 2015-12-06 12:47:09 1449431229 0 2015-12-06 12:46:09 1449431169 0 2015-12-06 12:45:09 1449431109 0 2015-12-06 12:44:09 1449431049 0 2015-12-06 12:43:09 1449430989 0 2015-12-06 12:42:09 1449430929 0 2015-12-06 12:41:09 1449430869 0 2015-12-06 12:40:09 1449430809 0 2015-12-06 12:39:09 1449430749 0 2015-12-06 12:38:09 1449430689 0 2015-12-06 12:37:10 1449430630 0 2015-12-06 12:36:09 1449430569 0 2015-12-06 12:35:10 1449430510 0 2015-12-06 12:34:10 1449430450 0 2015-12-06 12:33:09 1449430389 0 2015-12-06 12:32:10 1449430330 0 2015-12-06 12:31:10 1449430270 0 2015-12-06 12:30:10 1449430210 0 2015-12-06 12:29:09 1449430149 0 2015-12-06 12:28:09 1449430089 0 2015-12-06 12:27:09 1449430029 0 2015-12-06 12:26:09 1449429969 0 2015-12-06 12:25:09 1449429909 0 2015-12-06 12:24:09 1449429849 0 2015-12-06 12:23:09 1449429789 0 2015-12-06 12:22:09 1449429729 0 2015-12-06 12:21:09 1449429669 0 2015-12-06 12:20:09 1449429609 0 2015-12-06 12:19:09 1449429549 0 2015-12-06 12:18:09 1449429489 0 2015-12-06 12:17:09 1449429429 0 2015-12-06 12:16:09 1449429369 0 2015-12-06 12:15:09 1449429309 0 2015-12-06 12:14:09 1449429249 0 2015-12-06 12:13:09 1449429189 0 2015-12-06 12:12:09 1449429129 0 2015-12-06 12:11:09 1449429069 0 2015-12-06 12:10:09 1449429009 0 2015-12-06 12:09:09 1449428949 0 2015-12-06 12:08:09 1449428889 0 2015-12-06 12:07:09 1449428829 0 2015-12-06 12:06:09 1449428769 0 2015-12-06 12:05:09 1449428709 0 2015-12-06 12:04:09 1449428649 0 2015-12-06 12:03:09 1449428589 0 2015-12-06 12:02:09 1449428529 0 2015-12-06 12:01:10 1449428470 0 2015-12-06 12:00:09 1449428409 0 2015-12-06 11:59:09 1449428349 0 2015-12-06 11:58:09 1449428289 0 2015-12-06 11:57:09 1449428229 0 2015-12-06 11:56:09 1449428169 0 2015-12-06 11:55:10 1449428110 0 2015-12-06 11:54:09 1449428049 0 2015-12-06 11:53:09 1449427989 0 2015-12-06 11:52:09 1449427929 0 2015-12-06 11:51:09 1449427869 0 2015-12-06 11:50:09 1449427809 1 2015-12-06 11:49:09 1449427749 1 2015-12-06 11:48:09 1449427689 1 2015-12-06 11:47:09 1449427629 1 2015-12-06 11:46:09 1449427569 1 2015-12-06 11:45:09 1449427509 1 2015-12-06 11:44:09 1449427449 1 2015-12-06 11:43:09 1449427389 1 2015-12-06 11:42:09 1449427329 1 2015-12-06 11:41:09 1449427269 1 2015-12-06 11:40:09 1449427209 1 2015-12-06 11:39:10 1449427150 1 2015-12-06 11:38:09 1449427089 1 2015-12-06 11:37:09 1449427029 1 2015-12-06 11:36:09 1449426969 1 2015-12-06 11:35:10 1449426910 1 2015-12-06 11:34:09 1449426849 1 2015-12-06 11:33:09 1449426789 1 2015-12-06 11:32:09 1449426729 1 2015-12-06 11:31:09 1449426669 1 2015-12-06 11:30:09 1449426609 1 2015-12-06 11:29:09 1449426549 1 2015-12-06 11:28:09 1449426489 1 2015-12-06 11:27:10 1449426430 1 2015-12-06 11:26:09 1449426369 1 2015-12-06 11:25:09 1449426309 1 2015-12-06 11:24:09 1449426249 1 2015-12-06 11:23:09 1449426189 1 2015-12-06 11:22:09 1449426129 1 2015-12-06 11:21:09 1449426069 1 2015-12-06 11:20:09 1449426009 1 2015-12-06 11:19:09 1449425949 1 2015-12-06 11:18:09 1449425889 1 2015-12-06 11:17:09 1449425829 1 2015-12-06 11:16:09 1449425769 1 2015-12-06 11:15:09 1449425709 1 2015-12-06 11:14:09 1449425649 1 2015-12-06 11:13:10 1449425590 1 2015-12-06 11:12:09 1449425529 1 2015-12-06 11:11:09 1449425469 1 2015-12-06 11:10:10 1449425410 1 2015-12-06 11:09:09 1449425349 1 2015-12-06 11:08:09 1449425289 1 2015-12-06 11:07:09 1449425229 1 2015-12-06 11:06:09 1449425169 1 2015-12-06 11:05:09 1449425109 1 2015-12-06 11:04:09 1449425049 1 2015-12-06 11:03:09 1449424989 1 2015-12-06 11:02:09 1449424929 1 2015-12-06 11:01:09 1449424869 1 2015-12-06 11:00:10 1449424810 1 2015-12-06 10:59:09 1449424749 1 2015-12-06 10:58:09 1449424689 1 2015-12-06 10:57:11 1449424631 1 2015-12-06 10:56:09 1449424569 1 2015-12-06 10:55:09 1449424509 1 2015-12-06 10:54:09 1449424449 1 2015-12-06 10:53:10 1449424390 1 2015-12-06 10:52:09 1449424329 1 2015-12-06 10:51:09 1449424269 1 2015-12-06 10:50:09 1449424209 1 2015-12-06 10:49:09 1449424149 1 2015-12-06 10:48:09 1449424089 1 2015-12-06 10:47:09 1449424029 1 2015-12-06 10:46:09 1449423969 1 2015-12-06 10:45:09 1449423909 1 2015-12-06 10:44:09 1449423849 1 2015-12-06 10:43:09 1449423789 1 2015-12-06 10:42:09 1449423729 1 2015-12-06 10:41:09 1449423669 1 2015-12-06 10:40:09 1449423609 1 2015-12-06 10:39:09 1449423549 1 2015-12-06 10:38:09 1449423489 1 2015-12-06 10:37:09 1449423429 1 2015-12-06 10:36:09 1449423369 1 2015-12-06 10:35:09 1449423309 1 2015-12-06 10:34:09 1449423249 1 2015-12-06 10:33:09 1449423189 1 2015-12-06 10:32:09 1449423129 1 2015-12-06 10:31:10 1449423070 1 2015-12-06 10:30:09 1449423009 1 2015-12-06 10:29:10 1449422950 1 2015-12-06 10:28:09 1449422889 1 2015-12-06 10:27:09 1449422829 1 2015-12-06 10:26:09 1449422769 1 2015-12-06 10:25:09 1449422709 1 2015-12-06 10:24:09 1449422649 1 2015-12-06 10:23:09 1449422589 1 2015-12-06 10:22:09 1449422529 1 2015-12-06 10:21:09 1449422469 1 2015-12-06 10:20:10 1449422410 1 2015-12-06 10:19:10 1449422350 1 2015-12-06 10:18:09 1449422289 1 2015-12-06 10:17:09 1449422229 1 2015-12-06 10:16:09 1449422169 1 2015-12-06 10:15:09 1449422109 1 2015-12-06 10:14:09 1449422049 1 2015-12-06 10:13:10 1449421990 1 2015-12-06 10:12:09 1449421929 1 2015-12-06 10:11:09 1449421869 1 2015-12-06 10:10:09 1449421809 1 2015-12-06 10:09:09 1449421749 1 2015-12-06 10:08:09 1449421689 1 2015-12-06 10:07:09 1449421629 1 2015-12-06 10:06:09 1449421569 1 2015-12-06 10:05:09 1449421509 1 2015-12-06 10:04:09 1449421449 1 2015-12-06 10:03:10 1449421390 1 2015-12-06 10:02:09 1449421329 1 2015-12-06 10:01:09 1449421269 1 2015-12-06 10:00:09 1449421209 1 2015-12-06 09:59:09 1449421149 1 2015-12-06 09:58:09 1449421089 1 2015-12-06 09:57:10 1449421030 1 2015-12-06 09:56:09 1449420969 1 2015-12-06 09:55:09 1449420909 1 2015-12-06 09:54:09 1449420849 1 2015-12-06 09:53:09 1449420789 1 2015-12-06 09:52:09 1449420729 1 2015-12-06 09:51:09 1449420669 1 2015-12-06 09:50:09 1449420609 1 2015-12-06 09:49:09 1449420549 1 2015-12-06 09:48:09 1449420489 1 |
| Comment by Chris Christensen [ 2015 Dec 08 ] |
|
^ previous screenshot/data: the following maintenance time ranges were recorded (which seems to indicate it may have something to do with an event getting regenerated? after a maintenance is removed...) Maintenance type: With data collection 2015-10-12 01:41:44 - Mon Oct 12 04:15:13 2015 |
| Comment by Oleksii Zagorskyi [ 2015 Dec 08 ] |
|
Chis, the host in your example is monitored by proxy or directly by server ? And please, always mention involved zabbix components version |
| Comment by Chris Christensen [ 2015 Dec 08 ] |
|
The host is monitored by proxy, no delays were visible and the queue was the same rate/value through all the times. Everything appears to be working normally for the region/proxy/host. Also - it's noteworthy that the behavior is visible in Oct., Dec. - which would be two independent points in time. Zabbix server v2.2.4 |
| Comment by Oleksii Zagorskyi [ 2015 Dec 08 ] |
|
Thanks Chris ! I'm only not sure about one point where you had 3 (not 2) OK events, but who knows, it's also could be related to the |
| Comment by Chris Christensen [ 2015 Dec 08 ] |
|
Oleksiy - I agree this looks more like Also - looked and there was another maint (different name, but still "With data collection") for: 2015-12-05 06:37:55 - 2015-12-05 08:07:55 (which correlates with all the duplicate OKs). |
| Comment by Roman Fiedler [ 2015 Dec 09 ] |
|
If this and |
| Comment by Oleksii Zagorskyi [ 2015 Dec 09 ] |
|
Chris, yes, the 3rd OK is created after maintenance too.
|
| Comment by Oleksii Zagorskyi [ 2015 Dec 09 ] |
|
Roman, I'd suggest to continue your discussion in your |
| Comment by Oleksii Zagorskyi [ 2016 Jan 18 ] |
|
Good news here - in a So, the way how do you all put hosts to maintenance is very important ! |
[ZBX-9399] host column not shown in monitoring -> events Created: 2015 Mar 15 Updated: 2019 Dec 10 |
|
| Status: | Open |
| Project: | ZABBIX BUGS AND ISSUES |
| Component/s: | Frontend (F) |
| Affects Version/s: | 2.4.4, 2.5.0 |
| Fix Version/s: | None |
| Type: | Incident report | Priority: | Trivial |
| Reporter: | richlv | Assignee: | Unassigned |
| Resolution: | Unresolved | Votes: | 0 |
| Labels: | events | ||
| Remaining Estimate: | Not Specified | ||
| Time Spent: | Not Specified | ||
| Original Estimate: | Not Specified | ||
| Environment: |
trunk r52680, 2.4 branch r52739. |
||
| Description |
|
in monitoring -> events, choose some host group and a specific host. now switch to another host group that does not include this host - even though the host dropdown says "all", host column is not displayed |
| Comments |
| Comment by richlv [ 2015 Mar 15 ] |
|
(1) the opposite is possible, too - select a single host, go to some other page, go to monitoring -> hosts - now host column is displayed even though only one host is selected |
| Comment by Kaspars Mednis [ 2019 Feb 08 ] |
|
Hello Rich, Zabbix 2.4 is no longer supported regarding our Zabbix Life Cycle & Release Policy In newest Zabbix versions Monitoring -> Events page is removed. |
[ZBX-9375] Link on Last events of a trigger from maps should contain "filter_set=1" Created: 2015 Mar 05 Updated: 2017 May 30 Resolved: 2015 Aug 13 |
|
| Status: | Closed |
| Project: | ZABBIX BUGS AND ISSUES |
| Component/s: | Frontend (F) |
| Affects Version/s: | 2.4.3, 2.5.0 |
| Fix Version/s: | 2.4.6rc1, 2.5.0 |
| Type: | Incident report | Priority: | Blocker |
| Reporter: | Filipp Sudanov (Inactive) | Assignee: | Unassigned |
| Resolution: | Fixed | Votes: | 0 |
| Labels: | events | ||
| Remaining Estimate: | Not Specified | ||
| Time Spent: | Not Specified | ||
| Original Estimate: | Not Specified | ||
| Issue Links: |
|
||||
| Description |
|
"Latest events" of a trigger element in maps produce a link that shows last viewed state of Events page. The link should contain "filter_set=1". |
| Comments |
| Comment by Ivo Kurzemnieks [ 2015 Mar 06 ] |
|
(1) No translation string changes. sasha CLOSED |
| Comment by Ivo Kurzemnieks [ 2015 Mar 06 ] |
|
RESOLVED in svn://svn.zabbix.com/branches/dev/ZBX-9375 |
| Comment by Alexander Vladishev [ 2015 Mar 06 ] |
|
(2) Take a look at my changes in r52595:52596
iivs CLOSED. |
| Comment by Ivo Kurzemnieks [ 2015 Mar 10 ] |
|
Fixed in pre-2.4.5rc1 r52642 and pre-2.5.0 (trunk) r52643 |
| Comment by richlv [ 2015 Mar 10 ] |
|
(3) docs - whatsnew, should review descriptions and screenshots <richlv> looks like i managed comment on the wrong issue here. weird |
| Comment by Filipp Sudanov (Inactive) [ 2015 Mar 10 ] |
|
(4) Tried to apply a patch with r52642 changes on 2.4.3 - trigger name is selected on Events page, but Group and Host dropdowns contain previously selected values. iivs RESOLVED in r52696 oleg.egorov Monitoring->Events Go to Reports-> Availability report Use trigger link and go to Monitoring->Events Result: In other frontend parts, good work, Ivo! iivs RESOLVED in r54572 oleg.egorov CLOSED |
| Comment by Ivo Kurzemnieks [ 2015 Aug 03 ] |
|
Fixed in:
|
| Comment by Alexander Vladishev [ 2015 Aug 19 ] |
|
Caused a regression: |
[ZBX-8897] Getting first event for non-Super-Admin user is slow on Monitoring->Events page Created: 2014 Oct 14 Updated: 2017 May 30 Resolved: 2016 Sep 15 |
|
| Status: | Closed |
| Project: | ZABBIX BUGS AND ISSUES |
| Component/s: | Frontend (F) |
| Affects Version/s: | 2.2.6 |
| Fix Version/s: | 2.2.15rc1, 3.0.5rc1 |
| Type: | Incident report | Priority: | Blocker |
| Reporter: | Alexey Pustovalov | Assignee: | Unassigned |
| Resolution: | Fixed | Votes: | 1 |
| Labels: | events, oracle, performance | ||
| Remaining Estimate: | Not Specified | ||
| Time Spent: | Not Specified | ||
| Original Estimate: | Not Specified | ||
| Environment: |
Oracle, MySQL |
||
| Issue Links: |
|
||||||||
| Description |
|
Zabbix frontend gets the oldest eventid in any cases using the next call: 5. event->get [events.php:390]
Parameters:
Array
(
[source] => 0
[object] => 0
[output] => extend
[objectids] =>
[sortfield] => Array
(
[0] => clock
)
[sortorder] => ASC
[limit] => 1
)
Result:
Array
(
[0] => Array
(
[eventid] => 219
[source] => 0
[object] => 0
[objectid] => 13628
[clock] => 1401317490
[value] => 0
[acknowledged] => 0
[ns] => 365969275
)
)
query looks like:
|
| Comments |
| Comment by Bezaleel Ramos [ 2016 Aug 25 ] |
|
Hi, I have this problem with non-Super-Admins. Exists some limitation when user non-Super-Admins, the DashBoard,Triggers,Events is very slow to load My Zabbix is 3.0.4 Beza |
| Comment by Alexander Vladishev [ 2016 Sep 13 ] |
|
Fixed in development branch svn://svn.zabbix.com/branches/dev/ZBX-8897 |
| Comment by Alexander Vladishev [ 2016 Sep 13 ] |
|
(1) No translation strings changed gunarspujats CLOSED |
| Comment by Gunars Pujats (Inactive) [ 2016 Sep 14 ] |
|
Successfully tested. |
| Comment by Alexander Vladishev [ 2016 Sep 15 ] |
|
Fixed in:
|
[ZBX-8873] Possible incorrect (infinite escalations) events after maintenance period Created: 2014 Oct 08 Updated: 2017 May 30 Resolved: 2014 Dec 05 |
|
| Status: | Closed |
| Project: | ZABBIX BUGS AND ISSUES |
| Component/s: | Server (S) |
| Affects Version/s: | 2.2.6 |
| Fix Version/s: | 2.2.8rc1, 2.4.3rc1, 2.5.0 |
| Type: | Incident report | Priority: | Blocker |
| Reporter: | Alexey Pustovalov | Assignee: | Unassigned |
| Resolution: | Fixed | Votes: | 1 |
| Labels: | delay, events, maintenance, proxy | ||
| Remaining Estimate: | Not Specified | ||
| Time Spent: | Not Specified | ||
| Original Estimate: | Not Specified | ||
| Issue Links: |
|
||||
| Description |
|
When the problem happens while maintenance period because of "nodata" trigger and then data has been processed by Zabbix server (possible delay from proxy or unavailable active agent) and resolves while maintenance. Immediately after maintenance ends, Zabbxi generates new event with PROBLEM status, but do not change trigger status. In this case we have action escalation which will be never stopped because of trigger OK status. |
| Comments |
| Comment by Aleksandrs Saveljevs [ 2014 Oct 09 ] |
|
To clarify, we are talking about the following scenario based on the following data (note that the third event has a bigger "clock" than the second): mysql> select * from events where source = 0 and object = 0 and objectid = 51890 order by eventid DESC LIMIT 10; +---------+--------+--------+----------+------------+-------+--------------+-----------+ | eventid | source | object | objectid | clock | value | acknowledged | ns | +---------+--------+--------+----------+------------+-------+--------------+-----------+ | 8822741 | 0 | 0 | 51890 | 1412715600 | 1 | 0 | 0 | | 8812309 | 0 | 0 | 51890 | 1412708305 | 0 | 0 | 409577698 | | 8812307 | 0 | 0 | 51890 | 1412708310 | 1 | 0 | 570803690 | ... At 1412708310 a nodata() trigger fired with PROBLEM. After that, we received delayed data from proxy and generated an OK event with "clock" of 1412708305. Finally, maintenance ended for this host and we generated a PROBLEM event at 1412715600 with the same value as the last event, even though the trigger is currently in OK state. The problem that "last" in the last sentence means "last by clock" (see get_trigger_values() function, which is called from generate_events() in timer.c) and we have events out of order because of proxy. |
| Comment by Alexander Vladishev [ 2014 Dec 04 ] |
|
Fixed in development branch svn://svn.zabbix.com/branches/dev/ZBX-8873 |
| Comment by Aleksandrs Saveljevs [ 2014 Dec 04 ] |
|
(1) Looks good, but please see r50995 before merging. sasha Thank you. It looks better! CLOSED |
| Comment by Aleksandrs Saveljevs [ 2014 Dec 05 ] |
|
Fixed in pre-2.2.8 r51037, pre-2.4.3 r51038, and pre-2.5.0 (trunk) r51039. |
[ZBX-8862] The event of unknown items are not displayed. Created: 2014 Oct 08 Updated: 2019 Dec 10 |
|
| Status: | Open |
| Project: | ZABBIX BUGS AND ISSUES |
| Component/s: | Frontend (F) |
| Affects Version/s: | 2.0.11, 2.2.3, 2.4.0 |
| Fix Version/s: | None |
| Type: | Incident report | Priority: | Trivial |
| Reporter: | Yoshinori Komuro | Assignee: | Unassigned |
| Resolution: | Unresolved | Votes: | 0 |
| Labels: | events | ||
| Remaining Estimate: | Not Specified | ||
| Time Spent: | Not Specified | ||
| Original Estimate: | Not Specified | ||
| Description |
|
----------- If items are in unknown state, events are not displayed on event page. For example, We cannnot check the event in situation ?, and it is inconvinient. On the event page, CTrigger is used with the monitored option for narrowing down triggers. When the monitored option is used by CTrigger, |
[ZBX-8633] Events may show wrongly PROBLEM events after maintenance Created: 2014 Aug 19 Updated: 2019 Dec 10 |
|
| Status: | Open |
| Project: | ZABBIX BUGS AND ISSUES |
| Component/s: | Server (S) |
| Affects Version/s: | 2.2.4 |
| Fix Version/s: | None |
| Type: | Incident report | Priority: | Trivial |
| Reporter: | Marc | Assignee: | Unassigned |
| Resolution: | Unresolved | Votes: | 0 |
| Labels: | escalations, events, falsepositives, maintenance | ||
| Remaining Estimate: | Not Specified | ||
| Time Spent: | Not Specified | ||
| Original Estimate: | Not Specified | ||
| Description |
|
After maintenance an escalation took place for a trigger that's actually in OK state:
zabbix=# SELECT triggerid,
zabbix-#        value,
zabbix-#        lastchange
zabbix-# FROM   triggers
zabbix-# WHERE  triggerid = 526432;
 triggerid | value | lastchange
-----------+-------+------------
    526432 |     0 | 1408436420
(1 row)

zabbix=#
While corresponding chronological last event is a PROBLEM event what is probably the cause for escalation: zabbix=# SELECT * zabbix-# FROM events zabbix-# WHERE eventid IN zabbix-# (SELECT eventid zabbix(# FROM events zabbix(# WHERE objectid = '526432' AND zabbix(# clock >= '1407845566' AND zabbix(# clock <= '1408450366') zabbix-# ORDER BY clock DESC,eventid DESC; eventid | source | object | objectid | clock | value | acknowledged | ns ----------+--------+--------+----------+------------+-------+--------------+----------- 23576348 | 0 | 0 | 526432 | 1408437901 | 1 | 0 | 0 23574987 | 0 | 0 | 526432 | 1408436436 | 1 | 0 | 707712147 23575405 | 0 | 0 | 526432 | 1408436420 | 0 | 0 | 480516079 23446409 | 0 | 0 | 526432 | 1408027204 | 1 | 0 | 709559043 23446605 | 0 | 0 | 526432 | 1408027166 | 0 | 0 | 128809786 (5 rows) zabbix=# Now I wonder why two successive PROBLEM events exist and why the last one has 'ns' set to 0. Possibly it's related to Scenario:
|
| Comments |
| Comment by Marc [ 2014 Aug 19 ] |
|
The last event has been created exactly on maintenance expiration: # date -d @1408437901 Tue Aug 19 10:45:01 CEST 2014 |
[ZBX-8589] Last 20 Issues In dashboard Show "No events" in ACK colunm will the event page show everyting should work fine. Created: 2014 Aug 06 Updated: 2017 May 30 Resolved: 2014 Aug 07 |
|
| Status: | Closed |
| Project: | ZABBIX BUGS AND ISSUES |
| Component/s: | Frontend (F) |
| Affects Version/s: | 2.2.5 |
| Fix Version/s: | None |
| Type: | Incident report | Priority: | Major |
| Reporter: | Yan Cote | Assignee: | Unassigned |
| Resolution: | Duplicate | Votes: | 0 |
| Labels: | dashboard, events, frontend | ||
| Remaining Estimate: | Not Specified | ||
| Time Spent: | Not Specified | ||
| Original Estimate: | Not Specified | ||
| Environment: |
CentOS release 6.5 (Final), With PostgreSQL) 9.2.9. |
||
| Attachments: |
|
||||||||
| Issue Links: |
|
||||||||
| Description |
|
After We made Update to 2.2.4 to 2.2.5 We now see In the Dashboard page, in the Last 20 Issues block, In column ACK ( NO events ) But in the Events Page you can see the All work Fines. I know some Other issues are open and look almost the same problem. like But not the same version. Thx for your help. |
| Comments |
| Comment by Marc [ 2014 Aug 07 ] |
|
|
| Comment by Pavels Jelisejevs (Inactive) [ 2014 Aug 07 ] |
|
This will be fixed under CLOSED. |
[ZBX-8556] Events page shows wrong duration in case of nodata() trigger and delayed data Created: 2014 Jul 30 Updated: 2019 Dec 10 |
|
| Status: | Open |
| Project: | ZABBIX BUGS AND ISSUES |
| Component/s: | Frontend (F) |
| Affects Version/s: | None |
| Fix Version/s: | None |
| Type: | Incident report | Priority: | Trivial |
| Reporter: | Filipp Sudanov (Inactive) | Assignee: | Unassigned |
| Resolution: | Unresolved | Votes: | 5 |
| Labels: | delay, events, order | ||
| Remaining Estimate: | Not Specified | ||
| Time Spent: | Not Specified | ||
| Original Estimate: | Not Specified | ||
| Attachments: |
|
||||||||||||
| Issue Links: |
|
||||||||||||
| Description |
|
Imagine we have an item (monitored via proxy) and a nodata(120) trigger for it. Then following happens: As a result, event table is db has the following: # eventid, objectid, from_unixtime(clock), value, acknowledged '8006', '14134', '2014-07-30 17:04:53', '0', '0' '8005', '14134', '2014-07-30 17:05:30', '1', '0' Now see the attached screenshot. The triggers page on the left says (correctly): |
| Comments |
| Comment by Aleksandrs Saveljevs [ 2014 Jul 31 ] |
|
Related issue for server: |
| Comment by Oleksii Zagorskyi [ 2014 Jul 31 ] |
|
Note that such events creation order will lead a Well, I had similar case but w/o proxy. I had not chance to figure out how that happened. Trigger is - agent.ping.nodata(330)=1 Note events IDs 373 and 420 and their timestamps - they are not in order as supposed. Events page and Triggers page (with events details) sorts events on clock, but those events were actually created in order of eventIDs. |
| Comment by Oleksii Zagorskyi [ 2014 Jul 31 ] |
|
Another |
| Comment by Oleksii Zagorskyi [ 2014 Jul 31 ] |
|
I suppose something similar could be reproduces with agent Active checks. |
| Comment by Oleksii Zagorskyi [ 2015 Aug 13 ] |
|
Could be similar to ZBX-9432 |
[ZBX-8524] Monitoring->Events filter reset don't clear form Created: 2014 Jul 25 Updated: 2017 May 30 Resolved: 2014 Aug 27 |
|
| Status: | Closed |
| Project: | ZABBIX BUGS AND ISSUES |
| Component/s: | Frontend (F) |
| Affects Version/s: | 2.3.3 |
| Fix Version/s: | 2.3.4 |
| Type: | Incident report | Priority: | Trivial |
| Reporter: | Oleg Egorov (Inactive) | Assignee: | Unassigned |
| Resolution: | Fixed | Votes: | 0 |
| Labels: | events, filter, reset | ||
| Remaining Estimate: | Not Specified | ||
| Time Spent: | Not Specified | ||
| Original Estimate: | Not Specified | ||
| Attachments: |
|
| Description |
|
How to reproduce: |
| Comments |
| Comment by Krists Krigers (Inactive) [ 2014 Jul 28 ] |
|
RESOLVED in r47631, branch svn://svn.zabbix.com/branches/dev/ZBX-8524. |
| Comment by Oleg Egorov (Inactive) [ 2014 Jul 29 ] |
|
(1) String changes? kristsk No string changes. RESOLVED. oleg.egorov CLOSED |
| Comment by Oleg Egorov (Inactive) [ 2014 Jul 29 ] |
|
(2) $filterTriggerIds = array($triggerId); $knownTriggerIds = array_combine($filterTriggerIds, $filterTriggerIds); Too difficult construction... Use: array($triggerId => $triggerId) kristsk RESOLVED in r47648.
$filterTriggerIds = array($triggerId);
$knownTriggerIds = array($triggerId => $triggerId);
$validTriggerIds = $knownTriggerIds;

$eventOptions['objectids'] = $filterTriggerIds;
You use $filterTriggerIds only to set $eventOptions['objectids'].
$knownTriggerIds = array($triggerId => $triggerId);
$validTriggerIds = $knownTriggerIds;
$eventOptions['objectids'] = array($triggerId);
And if you update $r_form->addVar('triggerid', getRequest('triggerid'), 'triggerid_filter'); line, please rename $r_form kristsk RESOLVED in r47762. oleg.egorov CLOSED |
| Comment by Oleg Egorov (Inactive) [ 2014 Jul 29 ] |
|
(3) Result filtered by trigger Page reloaded, but form is not empty kristsk RESOLVED in r47646. oleg.egorov CLOSED |
| Comment by Oleg Egorov (Inactive) [ 2014 Jul 30 ] |
|
(4) Related issue How to reproduce: kristsk RESOLVED in r47756. oleg.egorov CLOSED |
| Comment by Oleg Egorov (Inactive) [ 2014 Aug 25 ] |
|
(5) Monitoring-Events page Trigger filter -> Select any trigger, press filter... and no result. Filter field is empty kristsk RESOLVED in r48403. oleg.egorov Select any trigger->Filter-> Press Monitoring->Event Same problem, if change source filter from trigger to discovery and back. kristsk RESOLVED in r48485. oleg.egorov Selected host, from group "a". Change group from "a" to "b". Host and trigger is still selected from group "a". jelisejev This is the intended behavior. The trigger filter is only dependent of the host filter. If you select a different host group, then the host filter switches to "all" and you can select any trigger. oleg.egorov CLOSED |
| Comment by Pavels Jelisejevs (Inactive) [ 2014 Aug 28 ] |
|
(6) Fixed more issues in r48515, please review. oleg.egorov CLOSED |
| Comment by Oleg Egorov (Inactive) [ 2014 Aug 28 ] |
|
TESTED |
| Comment by Pavels Jelisejevs (Inactive) [ 2014 Aug 29 ] |
|
Fixed in 2.3.4 r48564. |
| Comment by Pavels Jelisejevs (Inactive) [ 2014 Aug 29 ] |
|
This commit made a minor change in the behavior of the filter: "To simplify the logic of the filter, selecting all hosts will no longer clear the trigger filter. This goes the same for the case when you switch a host group and all hosts are selected automatically." I've noted it on the what's new page - https://www.zabbix.com/documentation/2.4/manual/introduction/whatsnew240?rev=1409297105&do=diff |
[ZBX-8508] Slow query on events list page on partitioned db Created: 2014 Jul 22 Updated: 2017 May 30 Resolved: 2014 Oct 17 |
|
| Status: | Closed |
| Project: | ZABBIX BUGS AND ISSUES |
| Component/s: | Frontend (F) |
| Affects Version/s: | 2.0.12, 2.2.4 |
| Fix Version/s: | None |
| Type: | Incident report | Priority: | Major |
| Reporter: | Kodai Terashima | Assignee: | Unassigned |
| Resolution: | Won't fix | Votes: | 0 |
| Labels: | events, performance | ||
| Remaining Estimate: | Not Specified | ||
| Time Spent: | Not Specified | ||
| Original Estimate: | Not Specified | ||
| Attachments: |
|
| Description |
|
Zabbix events page tries to get oldest event to make slider bar or zoom period. That query is quite heavy on partitioned db
The problem happens to see events page with guest user that doesn't have any permission ( need to search all events table for not-existing events) |
| Comments |
| Comment by Kodai Terashima [ 2014 Jul 22 ] |
|
The problem query is: SELECT e.* FROM events e WHERE EXISTS (SELECT NULL FROM functions f,items i,hosts_groups hgg JOIN rights r ON r.id=hgg.groupid AND r.groupid IN ('11','13') WHERE e.objectid=f.triggerid AND f.itemid=i.itemid AND i.hostid=hgg.hostid AND e.object=0 GROUP BY f.triggerid HAVING MIN(r.permission)>=2) AND e.eventid BETWEEN 000000000000000 AND 099999999999999 AND e.object='0' AND e.value_changed='1' ORDER BY e.eventid LIMIT 1 OFFSET 0;
|
| Comment by Oleg Egorov (Inactive) [ 2014 Aug 01 ] |
|
Added patch |
| Comment by Oleg Egorov (Inactive) [ 2014 Sep 11 ] |
|
RESOLVED IN svn://svn.zabbix.com/branches/dev/ZBX-8508 r48955 |
| Comment by Oleg Egorov (Inactive) [ 2014 Sep 17 ] |
|
(1) No string changes iivs CLOSED. |
| Comment by Ivo Kurzemnieks [ 2014 Sep 17 ] |
|
(2) We need a separate fix for 2.2+, due to sorting by clock and table indexes to get correct first event oleg.egorov As discussed, CLOSED |
| Comment by Ivo Kurzemnieks [ 2014 Sep 17 ] |
|
(3) In discussion with oleg.egorov and dotneft we found that on some patitioned DBs it works 4x slower now. Also it depends if host is selected or not. There is a large piece of code for it, which selects events multiple times as well as triggers. oleg.egorov As discussed, CLOSED |
| Comment by Ivo Kurzemnieks [ 2014 Sep 18 ] |
|
(4) Change 'nopermissions' => 1,
to 'nopermissions' => true, and remove comment // }}} CHECK IF EVENTS EXISTS oleg.egorov RESOLVED IN patch iivs CLOSED. |
| Comment by Oleg Egorov (Inactive) [ 2014 Oct 17 ] |
|
As was discussed, will be created patch only. And this changed will be not used in main Zabbix version. |
[ZBX-8497] Last 20 issues on dashboard shows a PROBLEM event while the trigger's last event is an OK event Created: 2014 Jul 18 Updated: 2017 May 30 Resolved: 2014 Aug 18 |
|
| Status: | Closed |
| Project: | ZABBIX BUGS AND ISSUES |
| Component/s: | Frontend (F) |
| Affects Version/s: | 2.2.4 |
| Fix Version/s: | 2.2.6rc1 |
| Type: | Incident report | Priority: | Minor |
| Reporter: | Marc | Assignee: | Unassigned |
| Resolution: | Fixed | Votes: | 0 |
| Labels: | dashboard, events | ||
| Remaining Estimate: | Not Specified | ||
| Time Spent: | Not Specified | ||
| Original Estimate: | Not Specified | ||
| Attachments: |
|
||||||||
| Issue Links: |
|
||||||||
| Description |
|
I'm not sure if it's a bug. Somehow I feel I just miss something. It happens now and then that there is a recent issue shown in 'Last 20 issues' on dashboard claiming there are 'No events' to acknowledge. Even after several refresh intervals of 'Last 20 issues' (set to 10 sec.) nothing changed. |
| Comments |
| Comment by Marc [ 2014 Jul 23 ] |
|
The ticket would probably be better named: |
| Comment by Krists Krigers (Inactive) [ 2014 Aug 14 ] |
|
Hello okkuv9xh, has your installation of Zabbix been migrated from using nodes to using proxies? Suspect cause of symptoms (problems with reliably retrieving last event of a trigger) is similar to one fixed by |
| Comment by Marc [ 2014 Aug 14 ] |
|
Nope. Fortunately using proxies from the very beginning Btw, the events shown here belong all to the same trigger: |
| Comment by Krists Krigers (Inactive) [ 2014 Aug 14 ] |
|
Could you make and upload a result of SELECT for events for trigger that had this discrepancy in dashboard and events view in the period of interest? |
| Comment by Marc [ 2014 Aug 14 ] |
|
Like this? zabbix=# SELECT * zabbix-# FROM events zabbix-# WHERE objectid = '391012' AND zabbix-# clock >= '1405598457' AND zabbix-# clock <= '1405602057' zabbix-# ORDER BY clock DESC,eventid DESC; eventid | source | object | objectid | clock | value | acknowledged | ns ----------+--------+--------+----------+------------+-------+--------------+----------- 22583309 | 0 | 0 | 391012 | 1405601640 | 0 | 0 | 958937392 22583364 | 0 | 0 | 391012 | 1405601337 | 1 | 0 | 227001964 22582932 | 0 | 0 | 391012 | 1405600440 | 0 | 0 | 667143305 22582986 | 0 | 0 | 391012 | 1405600137 | 1 | 0 | 396701655 22582617 | 0 | 0 | 391012 | 1405598937 | 1 | 0 | 734200931 (5 rows) zabbix=# |
| Comment by Krists Krigers (Inactive) [ 2014 Aug 14 ] |
|
Looking at "eventid" and "clock" columns it can bee seen that clock values are not monotone (see eventid 22582932 and 22582986). This can happen if event originated on proxy which had issues sending data back to server. |
| Comment by Marc [ 2014 Aug 14 ] |
|
Sure! Can you give me a hint where to obtain 2.2.6rc1 from? I can only find 2.2.5rc1 on zabbix.com and in SVN. |
| Comment by Krists Krigers (Inactive) [ 2014 Aug 15 ] |
|
Looks like 2.2.6rc1 is not released yet, but You can checking out latest 2.2 from SVN in svn://svn.zabbix.com/branches/2.2 |
| Comment by Marc [ 2014 Aug 15 ] |
|
Apparently there is still no support for access to Subversion via HTTP. |
| Comment by Krists Krigers (Inactive) [ 2014 Aug 15 ] |
|
I've added archive with frontend part of current 2.2 branch (i.e. pre-2.2.6rc1). |
| Comment by Marc [ 2014 Aug 15 ] |
|
Just had two 'No events' occurrences in frontend based on 2.2.5. |
| Comment by Krists Krigers (Inactive) [ 2014 Aug 18 ] |
|
So can I assume that problem is solved in 2.2.6 and close this issue? |
| Comment by Marc [ 2014 Aug 18 ] |
|
Yes! In the rare case of happening again, I can re-open it. |
[ZBX-8442] Event details may lack of media type information Created: 2014 Jul 04 Updated: 2019 Dec 10 |
|
| Status: | Confirmed |
| Project: | ZABBIX BUGS AND ISSUES |
| Component/s: | Frontend (F) |
| Affects Version/s: | 2.2.4 |
| Fix Version/s: | None |
| Type: | Problem report | Priority: | Trivial |
| Reporter: | Marc | Assignee: | Unassigned |
| Resolution: | Unresolved | Votes: | 1 |
| Labels: | details, events, mediatypes | ||
| Remaining Estimate: | Not Specified | ||
| Time Spent: | Not Specified | ||
| Original Estimate: | Not Specified | ||
| Attachments: |
|
| Description |
|
It seems that media type information for message actions is not set when user (message addressee) has no media defined. |
| Comments |
| Comment by Marc [ 2014 Jul 04 ] |
|
The user in question has a media with corresponding type defined but not for the severity that is set in the trigger of the event. Edit: |
| Comment by Marc [ 2014 Jul 06 ] |
|
Wouldn't it be nice as well to have Media type information for unsent messages in Last 20 issues too? |
| Comment by Pavels Jelisejevs (Inactive) [ 2014 Jul 10 ] |
|
I'm not sure I correctly understand the issue. You've said in the description that the user has no media defined, but in the comment - that the user has media but only for severities higher than this trigger. So which one is it? |
| Comment by Marc [ 2014 Jul 18 ] |
|
jelisejev, sorry for the confusion. As I wrote the description I mistakenly assumed the user has no media, because in event details 'No media defined [...]' was shown for that action operation. Later I saw that the user has a proper media defined but only for severities higher than this trigger. |
| Comment by Marc [ 2017 May 18 ] |
|
Turns out that 3.0 does not even make any log entry at all, if the recipient user has a corresponding media type but without the corresponding severity. In other words, it's even worse now :\ |
| Comment by Rostislav Palivoda [ 2017 Oct 24 ] |
|
Lets brainstorm on possible solutions. Any ideas? |
[ZBX-8424] Undefined index: eventid on Trigger page Created: 2014 Jul 02 Updated: 2017 May 30 Resolved: 2014 Sep 01 |
|
| Status: | Closed |
| Project: | ZABBIX BUGS AND ISSUES |
| Component/s: | Frontend (F), Server (S) |
| Affects Version/s: | 2.2.4 |
| Fix Version/s: | 2.2.6rc1, 2.3.3 |
| Type: | Incident report | Priority: | Major |
| Reporter: | Evgeny Molchanov | Assignee: | Unassigned |
| Resolution: | Fixed | Votes: | 0 |
| Labels: | events, undefinedindex | ||
| Remaining Estimate: | Not Specified | ||
| Time Spent: | Not Specified | ||
| Original Estimate: | Not Specified | ||
| Attachments: |
|
||||
| Issue Links: |
|
||||
| Description |
|
After update to 2.2.4 on page triggers: |
| Comments |
| Comment by Krists Krigers (Inactive) [ 2014 Jul 10 ] |
|
Lines 758 and 769 in file tr_status.php for version 2.2.4 (as downloaded from zabbix.com) do not have array element access with indexes reported in error message. |
| Comment by Evgeny Molchanov [ 2014 Jul 10 ] |
|
Now is not a problem. Message on the page triggers missing. 'eventid='.$trigger['lastEvent']['eventid']. |
| Comment by Evgeny Molchanov [ 2014 Jul 10 ] |
|
Version 2.2.4 with our minor modifications |
| Comment by Krists Krigers (Inactive) [ 2014 Jul 15 ] |
|
We could not reproduce. More detailed explanation on how to repeat this behavior is necessary to proceed. If problem comes back, please supply more info. |
| Comment by Oleksii Zagorskyi [ 2014 Jul 17 ] |
|
Well, I have the same errors on vanilla frontend 2.2.4, errors are: Undefined index: eventid [ in /var/www/html/tr_status.php:726] Undefined index: objectid [ in /var/www/html/tr_status.php:727] I know that such errors appear for triggers which were acknowledged. I don't have direct access to the frontend so it will take some time to figure out why these errors appear. |
| Comment by Oleksii Zagorskyi [ 2014 Jul 22 ] |
|
There is confirmation that this issue appeared after 2.2.4 upgrade. I accidentally was able to "reproduce" it when worked on another issue It's reproducible after changes in SELECT e.* FROM events e WHERE e.objectid='13575' AND e.object='0' AND e.source='0' ORDER BY e.clock DESC,e.eventid DESC LIMIT 1 OFFSET 0 after:
SELECT e.* FROM ( SELECT e2.objectid,MAX(e2.clock) AS clock,MAX(e2.eventid) AS eventid FROM events e2 WHERE e2.object=0 AND e2.source=0 AND e2.objectid='13575' GROUP BY e2.objectid) e2, events e WHERE e.objectid=e2.objectid AND e.clock=e2.clock AND e.eventid=e2.eventid
In my tests I changed clock order to last or previous events (triggerid=13575) in a way that event with highest ID has clock which is less than previous event. In case when I changed the clock manually - the new SQL returns empty result and then we can see those Undefined index errors. BUT, from the production frontend I mentioned in previous comment I got saved html pages and I see there only correct order of eventIDs and their clock but the Undefined index errors are there as well. |
| Comment by Oleksii Zagorskyi [ 2014 Jul 22 ] |
|
Evgeny, is it possible that you will save the page as html and attach it here (or send it to an email)? |
| Comment by Oleksii Zagorskyi [ 2014 Jul 23 ] |
|
I have more details on my case. Please wait. |
| Comment by Oleksii Zagorskyi [ 2014 Jul 23 ] |
|
In my "production case" issue appeared because that installation "migrated" from DM to standalone mode in manual fashion - as described bottom of So it's the same case as I emulated in previous comment. But, if we consider NEW zabbix code: $dbEvents = DBselect( 'SELECT '.$outputFields. ' FROM ('. ' SELECT e2.objectid,MAX(e2.clock) AS clock,MAX(e2.eventid) AS eventid'. ' FROM events e2'. ' WHERE e2.object='.EVENT_OBJECT_TRIGGER. ' AND e2.source='.EVENT_SOURCE_TRIGGERS. ' AND '.dbConditionInt('e2.objectid', $triggerids). ' GROUP BY e2.objectid'. ') e2, events e'. ' WHERE e.objectid=e2.objectid'. ' AND e.clock=e2.clock'. ' AND e.eventid=e2.eventid' ); we don't see any limitation for nodeID. added:
 29237:20140723:161835.787 In process_events() events_num:1
 29237:20140723:161835.788 In DCget_nextid() table:'events' num:1
 29237:20140723:161835.788 query [txnlev:1] [select max(eventid) from events where eventid between 0 and 99999999999999]
So standalone server didn't notice outdated events from period when this server worked as node. Interesting, I'm not sure but I think it will be true also after migration to 2.4 |
| Comment by Oleksii Zagorskyi [ 2014 Jul 23 ] |
|
Yeah, tested DM installation on 2.2.6rc1 and I see that frontend produces that SQL (new code) w/o nodeID limitations:
SELECT e.* FROM ( SELECT e2.objectid,MAX(e2.clock) AS clock,MAX(e2.eventid) AS eventid FROM events e2 WHERE e2.object=0 AND e2.source=0 AND e2.objectid='100100000013557' GROUP BY e2.objectid) e2, events e WHERE e.objectid=e2.objectid AND e.clock=e2.clock AND e.eventid=e2.eventid
when all other SQLs with the limitations. We started to forged about nodes too early |
| Comment by Oleksii Zagorskyi [ 2014 Jul 31 ] |
|
In ZBX-8556 is a scenario how to reproduce described events order. |
| Comment by Juris Miščenko (Inactive) [ 2014 Jul 31 ] |
|
[S] Fix implemented at svn://svn.zabbix.com/branches/dev/ZBX-8424 |
| Comment by Oleksii Zagorskyi [ 2014 Aug 01 ] |
|
In the dev branch server does this SQL to search max eventids: According to svn log message. |
| Comment by Juris Miščenko (Inactive) [ 2014 Aug 01 ] |
|
Server side's fix merged in pre-2.2.6 r47725. |
| Comment by Ivo Kurzemnieks [ 2014 Aug 01 ] |
|
(2) Frontend code requires modification. iivs RESOLVED in svn://svn.zabbix.com/branches/dev/ZBX-8424 r47795 sasha CLOSED |
| Comment by Ivo Kurzemnieks [ 2014 Aug 05 ] |
|
Finding last event for triggers is now fixed in frontend. Fixed in pre-2.2.6rc1 r47812 and pre-2.3.3 r47813 |
| Comment by Pavels Jelisejevs (Inactive) [ 2014 Aug 29 ] |
|
(5) Please update the API changelog. A more detailed entry would be preferable. iivs Changes described here https://www.zabbix.com/documentation/2.2/manual/api/changes_2.2?do=diff&rev2[0]=1408108783&rev2[1]=&difftype=sidebyside jelisejev Thanks, CLOSED. |
[ZBX-8284] Export to CSV exports only current page (instead of every event) in Monitoring->Events Created: 2014 Jun 02 Updated: 2017 May 30 Resolved: 2014 Jun 02 |
|
| Status: | Closed |
| Project: | ZABBIX BUGS AND ISSUES |
| Component/s: | Frontend (F) |
| Affects Version/s: | 2.2.2 |
| Fix Version/s: | None |
| Type: | Incident report | Priority: | Trivial |
| Reporter: | Juho Mäkinen | Assignee: | Unassigned |
| Resolution: | Duplicate | Votes: | 0 |
| Labels: | csv, events, export | ||
| Remaining Estimate: | Not Specified | ||
| Time Spent: | Not Specified | ||
| Original Estimate: | Not Specified | ||
| Issue Links: |
|
||||||||
| Description |
|
Go to Monitoring -> Events. If you have more events than what can be fit into the first page then when you use "Export to CSV" only those events that fit the first page are exported. This makes the CVS export useless for most cases. If you look the form of the "Export to CSV" button it clearly shows that there's a "page_csv" property which tells which page it should export. I'm not sure if this is intended to be a feature but it clearly breaks UX in this case. |
[ZBX-8206] Slow frontend query for getting list of events on Oracle Created: 2014 May 14 Updated: 2017 May 30 Resolved: 2014 Oct 18 |
|
| Status: | Closed |
| Project: | ZABBIX BUGS AND ISSUES |
| Component/s: | Frontend (F) |
| Affects Version/s: | 2.2.3 |
| Fix Version/s: | None |
| Type: | Incident report | Priority: | Major |
| Reporter: | Alexey Pustovalov | Assignee: | Unassigned |
| Resolution: | Duplicate | Votes: | 0 |
| Labels: | events, oracle | ||
| Remaining Estimate: | Not Specified | ||
| Time Spent: | Not Specified | ||
| Original Estimate: | Not Specified | ||
| Environment: |
Oracle |
||
| Issue Links: |
|
||||
| Description |
SELECT * FROM (SELECT e.* FROM events e WHERE EXISTS (SELECT NULL FROM functions f,items i,hosts_groups hgg JOIN rights r ON r.id=hgg.groupid AND (r.groupid BETWEEN :"SYS_B_00" AND :"SYS_B_01" OR r.groupid IN (:"SYS_B_02",:"SYS_B_03",:"SYS_B_04")) WHERE e.objectid=f.triggerid AND f.itemid=i.itemid AND i.hostid=hgg.hostid GROUP BY f.triggerid HAVING MIN(r.permission)>:"SYS_B_05" AND MAX(r.permission)>=:"SYS_B_06") AND e.object=:"SYS_B_07" AND e.source=:"SYS_B_08" ORDER BY e.clock) WHERE rownum BETWEEN :"SYS_B_09" AND :"SYS_B_10" The query executes full table scan for events table on Oracle database. It is used for limited rights users on Monitoring->Events page. |
| Comments |
| Comment by Alexander Vladishev [ 2014 May 14 ] |
|
Related issue: |
| Comment by Alexey Pustovalov [ 2014 Oct 18 ] |
|
is duplicated by |
[ZBX-8008] Duplicate events Created: 2014 Mar 31 Updated: 2017 May 30 Resolved: 2014 Apr 17 |
|
| Status: | Closed |
| Project: | ZABBIX BUGS AND ISSUES |
| Component/s: | Server (S) |
| Affects Version/s: | 2.0.11 |
| Fix Version/s: | None |
| Type: | Incident report | Priority: | Minor |
| Reporter: | Łukasz Jernaś | Assignee: | Unassigned |
| Resolution: | Duplicate | Votes: | 1 |
| Labels: | duplicates, events | ||
| Remaining Estimate: | Not Specified | ||
| Time Spent: | Not Specified | ||
| Original Estimate: | Not Specified | ||
| Attachments: |
|
||||||||
| Issue Links: |
|
||||||||
| Description |
|
We're receiving duplicate events for our Zabbix trapper items in 2.0.11 and below. There are no unknown events in between according to the UI =2 It doesn't occur everytime, so we can't easily reproduce it. |
| Comments |
| Comment by Aleksandrs Saveljevs [ 2014 Mar 31 ] |
|
Apparently, |
| Comment by Aleksandrs Saveljevs [ 2014 Mar 31 ] |
|
We had a similar problem, too:
Trigger configuration is as follows: {host:icmpping[,3,500].min(5m)}=1 & {host:agent.ping.nodata(5m)}=1 |
| Comment by Alexander Vladishev [ 2014 Apr 13 ] |
|
Hi, Your hosts are monitored through a proxy? It can be related to |
| Comment by Marc [ 2014 Apr 14 ] |
|
I notice frequently that events are generated out of sequence for a longer time: Beside being irritating for users this behavior may lead to wrongly triggered action operations. The affected hosts are monitored by proxies. |
| Comment by Marc [ 2014 Apr 14 ] |
| Comment by Łukasz Jernaś [ 2014 Apr 14 ] |
|
Ours are monitored by proxy too. Will |
| Comment by Alexander Vladishev [ 2014 Apr 14 ] |
|
Yes, |
| Comment by Alexander Vladishev [ 2014 Apr 17 ] |
|
I close the issue as duplicate of |
[ZBX-7767] Ability to send alerts by master for events coming from childs is not documented. Created: 2014 Feb 07 Updated: 2017 May 30 Resolved: 2015 Feb 23 |
|
| Status: | Closed |
| Project: | ZABBIX BUGS AND ISSUES |
| Component/s: | Documentation (D) |
| Affects Version/s: | None |
| Fix Version/s: | None |
| Type: | Incident report | Priority: | Trivial |
| Reporter: | Oleksii Zagorskyi | Assignee: | Unassigned |
| Resolution: | Won't fix | Votes: | 0 |
| Labels: | alerts, dm, documentation, events | ||
| Remaining Estimate: | Not Specified | ||
| Time Spent: | Not Specified | ||
| Original Estimate: | Not Specified | ||
| Issue Links: |
|
||||||||||||
| Comments |
| Comment by Oleksii Zagorskyi [ 2014 Feb 07 ] |
|
Yes, such a feature is not obvious at all, and I'm not sure we need to document it. |
| Comment by Oleksii Zagorskyi [ 2014 Feb 07 ] |
|
It may cause unclear use cases. I'm not absolutely sure but, for example |
| Comment by Oleksii Zagorskyi [ 2015 Feb 23 ] |
|
Node based distribute monitoring is unsupported from version 2.4.0. |
[ZBX-7630] selected host in filter prevents viewing trigger events when coming from dashboard Created: 2014 Jan 09 Updated: 2017 May 30 Resolved: 2014 Apr 07 |
|
| Status: | Closed |
| Project: | ZABBIX BUGS AND ISSUES |
| Component/s: | Frontend (F) |
| Affects Version/s: | 2.2.2rc1 |
| Fix Version/s: | 2.2.4rc1, 2.3.0 |
| Type: | Incident report | Priority: | Major |
| Reporter: | Aleksandrs Saveljevs | Assignee: | Unassigned |
| Resolution: | Fixed | Votes: | 0 |
| Labels: | events | ||
| Remaining Estimate: | Not Specified | ||
| Time Spent: | Not Specified | ||
| Original Estimate: | Not Specified | ||
| Description |
|
Suppose we go to "Monitoring" -> "Events" and view events for host A. We then go to "Monitoring" -> "Dashboard" and, in "Last 20 issues" widget, click on the link in "Last change" column for a trigger that pertains to host B. On the opened page the trigger filter is correctly set to the trigger we want to see. However, because we have previously selected host A for viewing, no events are shown. |
| Comments |
| Comment by Pavels Jelisejevs (Inactive) [ 2014 Jan 10 ] |
|
A related issue - ZBX-7228. |
| Comment by Pavels Jelisejevs (Inactive) [ 2014 Jan 10 ] |
|
Another problem with the trigger filter is that after selecting a host, you can select a trigger from a different host and you won't see any results as well. oleg.egorov Please, fix this issue |
| Comment by Eduards Samersovs (Inactive) [ 2014 Feb 03 ] |
|
Fixed in development branch svn://svn.zabbix.com/branches/dev/ZBX-7630 |
| Comment by Oleg Egorov (Inactive) [ 2014 Feb 06 ] |
|
(1) events.php:351 (($_REQUEST['hostid'] > 0) ? '&only_hostid='.$_REQUEST['hostid'] : ''). I think should be changed to: ($_REQUEST['hostid'] ? '&only_hostid='.$_REQUEST['hostid'] : ''). Eduards RESOLVED r.42321 oleg.egorov CLOSED |
| Comment by Oleg Egorov (Inactive) [ 2014 Feb 06 ] |
|
TESTED |
| Comment by Eduards Samersovs (Inactive) [ 2014 Feb 12 ] |
|
Fixed in versions 2.3.0 (trunk) r.42538, 2.2.3rc1 r.42537 |
| Comment by Pavels Jelisejevs (Inactive) [ 2014 Apr 01 ] |
|
(2) This caused a regression: when selecting a trigger and switching to a different host with the same trigger, the trigger in the filter must be replaced with the same trigger on the new host. Eduards Fixed in development branch svn://svn.zabbix.com/branches/dev/ZBX-7630 r.43956 |
| Comment by Pavels Jelisejevs (Inactive) [ 2014 Apr 02 ] |
|
(3) When we choose a host that does not have this trigger, the filter must be empty. Eduards RESOLVED r.44034 jelisejev CLOSED. |
| Comment by Pavels Jelisejevs (Inactive) [ 2014 Apr 03 ] |
|
(4) Please remove the "filter_set" parameter from event links. It changes the behavior of the filter and we would like to avoid that in 2.2. Eduards RESOLVED r.44034 jelisejev CLOSED. |
| Comment by Pavels Jelisejevs (Inactive) [ 2014 Apr 04 ] |
|
(5) Open the Events page and select discovery events. Then go to the triggers page and click on the link to open the events for one of the triggers. The link will take you to the discovery events, instead of the trigger events. Eduards RESOLVED r.44072 jelisejev Please add the "source" parameter to the links leading to events page, instead of deducing it from the "triggerid" parameter. Eduards RESOLVED r.44110 jelisejev I've corrected some of the remaining links and made some formatting corrections in r44182, please review. Eduards CLOSED |
| Comment by Marc [ 2014 Apr 07 ] |
|
|
| Comment by Pavels Jelisejevs (Inactive) [ 2014 Apr 08 ] |
|
(6) [trunk] We've added new event page links in the trunk. When merging, please make sure (5) is fixed for them as well. |
| Comment by Pavels Jelisejevs (Inactive) [ 2014 Apr 08 ] |
|
Marc, it is related, but it will not be fixed in this issue. |
| Comment by Pavels Jelisejevs (Inactive) [ 2014 Apr 08 ] |
|
TESTED. Please review (5) before merging and close it if it's OK. |
| Comment by Eduards Samersovs (Inactive) [ 2014 Apr 08 ] |
|
Fixed in versions 2.3.0 (trunk) r.44185, 2.2.4rc1 r.44184 |
[ZBX-7605] Stops processing events silently, "duplicate key" errors Created: 2014 Jan 03 Updated: 2017 May 30 Resolved: 2014 Jan 04 |
|
| Status: | Closed |
| Project: | ZABBIX BUGS AND ISSUES |
| Component/s: | Server (S) |
| Affects Version/s: | 2.0.9 |
| Fix Version/s: | None |
| Type: | Incident report | Priority: | Major |
| Reporter: | Thomas Equeter | Assignee: | Unassigned |
| Resolution: | Won't fix | Votes: | 0 |
| Labels: | events | ||
| Remaining Estimate: | Not Specified | ||
| Time Spent: | Not Specified | ||
| Original Estimate: | Not Specified | ||
| Environment: |
Package: zabbix-server-pgsql 1:2.0.9+dfsg-1~bpo70+2 as packaged for Debian (the package does not modify any of the server code). Item volume : 1350 ICMP pingers, 2700 SNMP items, some Zabbix agents, web scenarii and trappers. Most items are updated every 60 secs. |
||
| Description |
|
Our Zabbix monitoring stopped processing events (silently!) last week until we finally noticed it. We had these errors in the logs: 38737:20131227:233018.004 [Z3005] query failed: [0] PGRES_FATAL_ERROR:ERROR: duplicate key value violates unique constraint "events_pkey" We restored the service by deleting the 'events' row from the 'ids' table. It may happen again however and have a significant impact on our business, so I investigated the issue. It smells like concurrent event creation outside of a transaction. I have found the following calls to process_event() outside of a DBbegin()/DBcommit() block:
This may not be exhaustive, I am not familiar with the Zabbix source code. Could you confirm that it's a likely cause of the bug and include a fix in the next 2.0 release? Thanks! See also : |
| Comments |
| Comment by Thomas Equeter [ 2014 Jan 03 ] |
|
I am testing the following workaround until the bug is fixed: CREATE OR REPLACE FUNCTION rxl_zbx_7605_events() RETURNS TRIGGER AS $$ BEGIN IF EXISTS( SELECT eventid FROM events WHERE eventid = NEW.eventid ) THEN DELETE FROM ids WHERE table_name='events'; SELECT MAX(eventid)+1 INTO STRICT NEW.eventid FROM events; RAISE WARNING 'Bug ZBX-7605: cleared the IDs and recomputed the eventid'; END IF; RETURN NEW; END; $$ LANGUAGE 'plpgsql'; CREATE TRIGGER rxl_zbx_7605_events BEFORE INSERT ON events FOR EACH ROW EXECUTE PROCEDURE rxl_zbx_7605_events(); |
| Comment by Marc [ 2014 Jan 03 ] |
|
Be aware that Zabbix is not aware of MAX(eventid)+1 since it manages element IDs via ids table. |
| Comment by Thomas Equeter [ 2014 Jan 03 ] |
|
Hello Marc, I expect Zabbix to insert a new, fresh row in the 'ids' table upon the next event as I DELETEd the one with the wrong nextid. Or did I miss something? Thanks, |
| Comment by Oleksii Zagorskyi [ 2014 Jan 04 ] |
|
Marc, note that it was true until v2.2 Thomas, yes, zabbix (server|frontend) will create corresponding records in the ids table if they are missing. As in 2.2 events generation is "very different" I don't see reasons to keep current issue opened. Closed as won't fix. |
| Comment by Aas [ 2014 Jan 18 ] |
|
I'm facing the same issue. Could you please advice how to truncate the ids table for less experienced users like myself? Thank you. |
| Comment by Heinz Strassmann [ 2015 Mar 09 ] |
|
I have the same problem on Zabbix 2.0.2 but I can't truncate the table. zabbix=# truncate events; Is it save to truncate cascade? |
| Comment by Oleksii Zagorskyi [ 2015 Mar 09 ] |
|
Yes, it's safe, because outdated records in acknowledges table do not have any sense without corresponding events. |
| Comment by Heinz Strassmann [ 2015 Mar 09 ] |
|
Thanks a lot this worked! |
[ZBX-7505] Hide history hyperlink in 'Latest events' if history is disabled Created: 2013 Dec 07 Updated: 2017 May 30 Resolved: 2014 Feb 14 |
|
| Status: | Closed |
| Project: | ZABBIX BUGS AND ISSUES |
| Component/s: | Frontend (F) |
| Affects Version/s: | 2.0.9 |
| Fix Version/s: | None |
| Type: | Incident report | Priority: | Trivial |
| Reporter: | Marc | Assignee: | Unassigned |
| Resolution: | Duplicate | Votes: | 0 |
| Labels: | events, history, usability | ||
| Remaining Estimate: | Not Specified | ||
| Time Spent: | Not Specified | ||
| Original Estimate: | Not Specified | ||
| Issue Links: |
|
||||||||
| Description |
|
Would be nice if the history hyperlink is hidden for items with disabled history / 'Keep history (in days)' set to 0. Similar to: |
| Comments |
| Comment by Oleg Egorov (Inactive) [ 2014 Feb 14 ] |
|
Will be fixed in |
[ZBX-7465] 'Event details' should always be accessible from 'Status of triggers' Created: 2013 Nov 30 Updated: 2019 Jun 14 Resolved: 2019 Jun 14 |
|
| Status: | Closed |
| Project: | ZABBIX BUGS AND ISSUES |
| Component/s: | Frontend (F) |
| Affects Version/s: | 2.0.9 |
| Fix Version/s: | None |
| Type: | Incident report | Priority: | Minor |
| Reporter: | Marc | Assignee: | Zabbix Development Team |
| Resolution: | Won't fix | Votes: | 1 |
| Labels: | events, patch, triggers, usability | ||
| Remaining Estimate: | Not Specified | ||
| Time Spent: | Not Specified | ||
| Original Estimate: | Not Specified | ||
| Attachments: |
|
| Description |
|
IMHO the hyperlink behind 'Last change' should not point only to event details for unhidden events. It should do it on trigger level as well. Now one has:
|
| Comments |
| Comment by Marc [ 2013 Nov 30 ] |
|
Attached patch aims to implement mentioned behavior. |
| Comment by Marc [ 2013 Dec 01 ] |
|
Just wondering whether it would be better to set the URL to NULL in case of no events instead of falling back to old behavior. |
| Comment by Volker Fröhlich [ 2013 Dec 06 ] |
|
Marc's version seems like the much better behaviour to me. |
| Comment by Oleg Egorov (Inactive) [ 2014 Mar 28 ] |
|
Should be discussed |
| Comment by Marc [ 2014 Aug 24 ] |
|
The current implementation in 2.2 of passing the corresponding event period as well, when accessing events via last-change hyper-link, appears sufficient to me.
|
| Comment by Volker Fröhlich [ 2014 Oct 22 ] |
|
What are the fix versions? |
| Comment by Alexander Vladishev [ 2019 Jun 14 ] |
|
Monitoring->Triggers section has been replaced by Monitoring->Problems view. There is no such problem. In older versions this will not be fixed. |
[ZBX-7424] After upgrade from 2.0.6 to 2.2 filtered triggers query stuck for 18+ min Created: 2013 Nov 21 Updated: 2017 May 30 Resolved: 2015 Sep 18 |
|
| Status: | Closed |
| Project: | ZABBIX BUGS AND ISSUES |
| Component/s: | Frontend (F) |
| Affects Version/s: | 2.2.0 |
| Fix Version/s: | None |
| Type: | Incident report | Priority: | Critical |
| Reporter: | Alex Ousyskin | Assignee: | Unassigned |
| Resolution: | Incomplete | Votes: | 2 |
| Labels: | events | ||
| Remaining Estimate: | Not Specified | ||
| Time Spent: | Not Specified | ||
| Original Estimate: | Not Specified | ||
| Environment: |
zabbix_server --version mysql Ver 5.5.28 PHP 5.3.3 |
||
| Description |
|
Query generated by Monitoring -> Triggers with some filters stuck frontend for 20 min Small investigation make clear that result from query return 293 rows in set (19 min 0.66 sec) SELECT t.triggerid,t.lastchange FROM triggers t WHERE NOT EXISTS (SELECT NULL FROM functions f,items i,hosts h WHERE t.triggerid=f.triggerid AND f.itemid=i.itemid AND i.hostid=h.hostid AND (i.status<>0 OR h.status<>0)) AND t.status=0 AND NOT EXISTS (SELECT NULL FROM functions f,items i,hosts h WHERE t.triggerid=f.triggerid AND f.itemid=i.itemid AND i.hostid=h.hostid AND h.maintenance_status=1) AND EXISTS (SELECT NULL FROM events e WHERE t.triggerid=e.objectid AND e.source=0 AND e.object=0 AND e.value=1 AND e.acknowledged=0) AND t.flags IN ('0','4') AND ((t.value=1) OR ((t.value=0) AND (t.lastchange>1385043768))) AND t.priority>='4' LIMIT 2002 OFFSET 0; |
| Comments |
| Comment by Alex Ousyskin [ 2013 Dec 03 ] |
|
Drop key (events_2) resolve the problem !!!! Instead 20 min result return in 0.5 sec 379 rows in set (0.50 sec) SELECT t.triggerid,t.lastchange FROM triggers t WHERE NOT EXISTS (SELECT NULL FROM functions f,items i,hosts h WHERE t.triggerid=f.triggerid AND f.itemid=i.itemid AND i.hostid=h.hostid AND (i.status<>0 OR h.status<>0)) AND t.status=0 AND NOT EXISTS (SELECT NULL FROM functions f,items i,hosts h WHERE t.triggerid=f.triggerid AND f.itemid=i.itemid AND i.hostid=h.hostid AND h.maintenance_status=1) AND EXISTS (SELECT NULL FROM events e IGNORE KEY (events_2) WHERE t.triggerid=e.objectid AND e.source=0 AND e.object=0 AND e.value=1 AND e.acknowledged=0) AND t.flags IN ('0','4') AND ((t.value=1) OR ((t.value=0) AND (t.lastchange>1385043768))) AND t.priority>='4' LIMIT 2002 OFFSET 0; |
| Comment by Imri Zvik [ 2014 Mar 03 ] |
|
We're still seeing this issue in 2.2.2 - Is there anything we can do to help making progress on this bug? |
| Comment by Søren Christian Aarup [ 2015 Feb 11 ] |
|
Also experiencing this after upgrading from 2.0.9 to 2.4.3... Fixed by: create index skod on events (objectid,source,object,value,acknowledged); |
| Comment by Oleksii Zagorskyi [ 2015 Sep 18 ] |
|
There were changes for indexes: CREATE INDEX `events_1` ON `events` (`object`,`objectid`,`eventid`); CREATE INDEX `events_2` ON `events` (`clock`); in 2.2 (in 2.4 and upcoming 3.0 still the same): CREATE INDEX `events_1` ON `events` (`source`,`object`,`objectid`,`clock`); CREATE INDEX `events_2` ON `events` (`source`,`object`,`clock`); The change made in Starting from 2.2 we can adjust housekeeping of events, keeping the table size much less. If anyone can describe what is wrong currently in zabbix recent version, please open new issue report with explanation. Note that there are other related issues with clean description. |
[ZBX-7231] Monitoring > Events page period filter not working properly Created: 2013 Oct 28 Updated: 2022 Sep 09 Resolved: 2022 Sep 06 |
|
| Status: | Closed |
| Project: | ZABBIX BUGS AND ISSUES |
| Component/s: | Frontend (F) |
| Affects Version/s: | 2.1.9 |
| Fix Version/s: | None |
| Type: | Incident report | Priority: | Trivial |
| Reporter: | Ivo Kurzemnieks | Assignee: | Unassigned |
| Resolution: | Unsupported version | Votes: | 0 |
| Labels: | events, filter, period, trigger | ||
| Remaining Estimate: | Not Specified | ||
| Time Spent: | Not Specified | ||
| Original Estimate: | Not Specified | ||
| Attachments: |
|
| Description |
|
Go to Monitoring > Events and choose a trigger in filter. Perferably not a popular one. Perhaps with only one generated event. |
| Comments |
| Comment by Aleksandrs Saveljevs [ 2016 Oct 24 ] |
|
Related issue: ZBX-9497. |
| Comment by richlv [ 2016 Oct 24 ] |
|
symptoms are exactly as in |
| Comment by Ivo Kurzemnieks [ 2022 Sep 06 ] |
|
Events page no longer exists since 3.2 and it has been changed to Problems with different time filter. |
[ZBX-7228] Clicking on event link, period is not set in events page filter Created: 2013 Oct 28 Updated: 2019 Dec 10 |
|
| Status: | Reopened |
| Project: | ZABBIX BUGS AND ISSUES |
| Component/s: | Frontend (F) |
| Affects Version/s: | 2.1.9 |
| Fix Version/s: | None |
| Type: | Incident report | Priority: | Trivial |
| Reporter: | Ivo Kurzemnieks | Assignee: | Unassigned |
| Resolution: | Unresolved | Votes: | 0 |
| Labels: | events, filter, frontend, links, period | ||
| Remaining Estimate: | Not Specified | ||
| Time Spent: | Not Specified | ||
| Original Estimate: | Not Specified | ||
| Description |
|
When clicking on event, filter shows only last hour, it's not set by clicked link. Links to events that don't set period in events page filter are:
By choosing to navigate to events page, we need to set a period in filter to display the events, otherwise by default filter sets only the last hour and list can be empty. In some links there is a parameter in URL "nav_time", but seems like it's not used. |
| Comments |
| Comment by Pavels Jelisejevs (Inactive) [ 2014 Jan 10 ] |
|
A related issue |
| Comment by Eduards Samersovs (Inactive) [ 2014 Feb 06 ] |
|
(1) Monitoring->Events |
| Comment by Eduards Samersovs (Inactive) [ 2014 Feb 06 ] |
|
(2) Monitoring->Events |
| Comment by Oleg Egorov (Inactive) [ 2014 Feb 06 ] |
|
(3) Should be used default period, for example in Monitoring->Events |
[ZBX-7127] Update ids loop Created: 2013 Oct 09 Updated: 2017 May 30 Resolved: 2016 Jul 27 |
|
| Status: | Closed |
| Project: | ZABBIX BUGS AND ISSUES |
| Component/s: | Server (S) |
| Affects Version/s: | 2.0.8, 2.0.9 |
| Fix Version/s: | None |
| Type: | Incident report | Priority: | Major |
| Reporter: | Morteza Gh | Assignee: | Unassigned |
| Resolution: | Duplicate | Votes: | 1 |
| Labels: | events, ids | ||
| Remaining Estimate: | Not Specified | ||
| Time Spent: | Not Specified | ||
| Original Estimate: | Not Specified | ||
| Environment: |
FreeBSD 8.4, MySQL 5.6.14 |
||
| Issue Links: |
|
||||||||
| Description |
|
I have updated zabbix server from version 1.8.16 to 2.0.8 but zabbix server doesn't start. I've noticed that most updated table is ids, so I went to Debug level 4 and this log was repeating in very fast loop. at this point, no graph is updated and you cannot add or update any host or item, until you stop the zabbix server and it starts syncing history and trends and graphs are shown. 19883:20131009:115427.627 query [txnlev:1] [update ids set nextid=nextid+47257 where nodeid=0 and table_name='events' and field_name='eventid'] I've tried disabling some triggers, and actions, upgrading from 2.0.8 to 2.0.9 stable but the problem remains the same. i've checked max(eventid) and eventid from ids table and it seems it is only increasing the ids but not using it as event at all. mysql> select * from ids where field_name="eventid"; select max(eventid) from events;
-------
------- --------------
--------------
-------------- |
| Comments |
| Comment by Alexander Vladishev [ 2016 Jul 27 ] |
|
Already fixed under |
[ZBX-6983] triggers w/o events are not shown in screen Created: 2013 Sep 11 Updated: 2017 May 30 Resolved: 2013 Sep 24 |
|
| Status: | Closed |
| Project: | ZABBIX BUGS AND ISSUES |
| Component/s: | Frontend (F) |
| Affects Version/s: | 2.1.4 |
| Fix Version/s: | 2.1.6, 2.1.9 |
| Type: | Incident report | Priority: | Critical |
| Reporter: | richlv | Assignee: | Unassigned |
| Resolution: | Fixed | Votes: | 0 |
| Labels: | events, screens, triggers | ||
| Remaining Estimate: | Not Specified | ||
| Time Spent: | Not Specified | ||
| Original Estimate: | Not Specified | ||
| Issue Links: |
|
||||||||
| Description |
|
triggers w/o events (removed by housekeeper, for example) are not shown in "status of hostgroup triggers" screen element. they are shown in monitoring -> triggers. interestingly, screen element gets the total count (shown below the list) correctly, but then does not show several triggers |
| Comments |
| Comment by Pavels Jelisejevs (Inactive) [ 2013 Sep 18 ] |
|
They are also not displayed in the "Latest 20 issues" widged and the "Status of host triggers" screen element. |
| Comment by Pavels Jelisejevs (Inactive) [ 2013 Sep 18 ] |
|
RESOLVED in svn://svn.zabbix.com/branches/dev/ZBX-6983. |
| Comment by Alexander Vladishev [ 2013 Sep 20 ] |
|
(1) $eventIds this array can be not the associative jelisejev RESOLVED in r38720. sasha CLOSED |
| Comment by Alexander Vladishev [ 2013 Sep 20 ] |
|
(2) frontends/php/include/blocks.inc.php:974 the local variable $actions shades the global jelisejev RESOLVED in r38712. sasha CLOSED |
| Comment by Alexander Vladishev [ 2013 Sep 20 ] |
|
(3) Broken resolving of {ITEM.VALUE}macro in trigger description. Now it works as {ITEM.LASTVALUE}. jelisejev RESOLVED in r38719 sasha REOPENED
jelisejev RESOLVED in r38744. Also fixed that the trigger severity background was not displayed for triggers without events. sasha CLOSED |
| Comment by Alexander Vladishev [ 2013 Sep 20 ] |
|
(4) 'selectLastEvent' parameter should contain only used fields (eventid, acknowledged, objectid); jelisejev RESOLVED in r38726. The trigger "expression" field is required for macro resolving. sasha CLOSED |
| Comment by Alexander Vladishev [ 2013 Sep 20 ] |
|
(5) Second API call Trigger()->get() for receiving total quantity of triggers shouldn't contain parameters:
jelisejev RESOLVED in r38726. sasha CLOSED |
| Comment by Alexander Vladishev [ 2013 Sep 20 ] |
|
(6) New lines should not be longer than 120 characters jelisejev RESOLVED in r38720. sasha CLOSED |
| Comment by Alexander Vladishev [ 2013 Sep 20 ] |
|
(7) Please do not use empty() function to check an emptiness of an array
jelisejev RESOLVED in r38721. sasha CLOSED |
| Comment by Pavels Jelisejevs (Inactive) [ 2013 Sep 20 ] |
|
(8) Rename the "Status of host group triggers" and "Status of host triggers" screen elements to "Latest host group issues" and "Latest host issues" respectively. <richlv> hmm. if so, this will change translatable strings, and also require documentation update (docs + screenshots) jelisejev Yes, it will, but it will be clearer this way. jelisejev The "Last change" column will also be renamed to "Time". jelisejev RESOLVED in r38728. sasha The screen element configuration form - drop-down options should be renamed too. REOPENED jelisejev RESOLVED in r38745. sasha CLOSED |
| Comment by Pavels Jelisejevs (Inactive) [ 2013 Sep 23 ] |
|
(9) Document the changes to the "Status of host group triggers" and "Status of host triggers" screen elements. <richlv> should be documented in corresponding screen sections, screenshots should be updated and it should also be briefly listed in whatsnew <richlv> list of changes (thanks to pavels for writing proper commit messages
jelisejev In (10) we've renamed the screen elements to "Host group issues" and "Host issues". martins-v Documented in:
RESOLVED. sasha Thanks! Also renamed these elements in:
RESOLVED martins-v Looking good to me. CLOSED. |
| Comment by Alexander Vladishev [ 2013 Sep 24 ] |
|
Frontend has been successfully tested. |
| Comment by Pavels Jelisejevs (Inactive) [ 2013 Sep 25 ] |
|
Available in 2.1.6 r38789. |
| Comment by Pavels Jelisejevs (Inactive) [ 2013 Oct 31 ] |
|
(10) After some consideration we've decided that the name "Latest host groups issues" can be misleading, since we can also sort triggers by host and severity. They will be renamed to just "Host group issues" and "Host issues". |
| Comment by Eduards Samersovs (Inactive) [ 2013 Oct 31 ] |
|
Tested! |
| Comment by Pavels Jelisejevs (Inactive) [ 2013 Oct 31 ] |
|
Fixed in 2.1.9 r39713. CLOSED. |
[ZBX-6963] Zabbix events screen fails to display recent events when using nodes Created: 2013 Sep 06 Updated: 2017 Sep 16 Resolved: 2017 Sep 16 |
|
| Status: | Closed |
| Project: | ZABBIX BUGS AND ISSUES |
| Component/s: | API (A), Frontend (F), Server (S) |
| Affects Version/s: | 2.0.7 |
| Fix Version/s: | None |
| Type: | Incident report | Priority: | Minor |
| Reporter: | Jim Star | Assignee: | Unassigned |
| Resolution: | Won't fix | Votes: | 0 |
| Labels: | distributed, events | ||
| Remaining Estimate: | Not Specified | ||
| Time Spent: | Not Specified | ||
| Original Estimate: | Not Specified | ||
| Description |
|
zabbix "history of events" screen will display only events for the highest ID node in the system, because zabbix appears to want to get the "list" of events limited by display, then uses php to sort it causes only the top events from one node to be displayed. options. fix the sort code or fix the sql query, we did the sql query. /usr/share/zabbix/api/classes/CEvent.php to $sqlOrder .= ' ORDER BY e.clock desc,'.implode(',', $sqlParts['order']); this fixed the problem, but its probably not "the best solution" Hopefully this saves someone else the headake, have a great day |
| Comments |
| Comment by Alexander Vladishev [ 2017 Sep 16 ] |
|
Distributed monitoring has been dropped from version 2.4. I close this issue as "Won't Fix". |
[ZBX-6942] Unreliable trigger based on log items Created: 2013 Aug 30 Updated: 2019 Dec 10 |
|
| Status: | Reopened |
| Project: | ZABBIX BUGS AND ISSUES |
| Component/s: | Server (S) |
| Affects Version/s: | 2.0.7 |
| Fix Version/s: | None |
| Type: | Incident report | Priority: | Trivial |
| Reporter: | Marc | Assignee: | Unassigned |
| Resolution: | Unresolved | Votes: | 0 |
| Labels: | events, logmonitoring, time, triggers | ||
| Remaining Estimate: | Not Specified | ||
| Time Spent: | Not Specified | ||
| Original Estimate: | Not Specified | ||
| Environment: |
Linux, CentOS-6.4, PostgreSQL 9.1.9, Apache HTTPD-2.2.15, PHP-5.3.3 |
||
| Description |
|
It took a long time to bring myself to create this report, because I'm not able to provide a process for reproducing this issue. I got several triggers based on log items that seem now and then to ignore item values. The triggers change into PROBLEM state if string "foo: not available" appears in last value. But sometimes they stay in PROBLEM state, even though the item received a value including "foo: available". Trigger expression example: {TRIGGER.VALUE}=0 & {Template:logrt["\{$LOG_FILE}",foo :( not| partially)? available,ISO8859-1,21,skip].regexp("foo : not available")}=1 |
{TRIGGER.VALUE}=1 & {Template:logrt["\{$LOG_FILE}",foo :( not| partially)? available,ISO8859-1,21,skip].regexp("foo : available")}#1
Event example (no OK event): 30 Aug 2013 18:10:40 foo is not available. PROBLEM History example (Timestamp/Local time/Value): 2013.Aug.30 18:10:42 2013.Aug.30 18:10:29 bar: available 2013.Aug.30 18:10:42 2013.Aug.30 18:10:29 bar: available 2013.Aug.30 18:10:42 2013.Aug.30 18:10:29 foo: available 2013.Aug.30 18:10:42 2013.Aug.30 18:10:29 bar: available 2013.Aug.30 18:10:41 2013.Aug.30 18:09:55 bar: not available 2013.Aug.30 18:10:40 2013.Aug.30 18:09:55 bar: not available 2013.Aug.30 18:10:40 2013.Aug.30 18:09:49 foo: not available 2013.Aug.30 18:10:40 2013.Aug.30 18:09:49 bar: partially available 2013.Aug.30 18:09:38 2013.Aug.30 18:09:26 bar: not available 2013.Aug.30 18:09:38 2013.Aug.30 18:09:26 bar: not available 2013.Aug.30 18:08:32 2013.Aug.30 18:08:02 bar: available The only common thing I noticed (for this particular example) is that it happened if between corresponding "not available" / "available" were 30 secs but values were processed in very quick succession. |
| Comments |
| Comment by Marc [ 2013 Aug 30 ] |
|
Replace: by: glebs.ivanovskis Done. Also fiddled with formatting if you don't mind... |
| Comment by Oleksii Zagorskyi [ 2013 Aug 31 ] |
|
What is an update interval for this item ? Show also please created events for that time frame. Why you don't use brackets to divide the expression to two logical parts ? Also interesting point for these two lines: (Timestamp/ Local time/ Value) 2013.Aug.30 18:10:41 2013.Aug.30 18:09:55 bar: not available 2013.Aug.30 18:10:40 2013.Aug.30 18:09:55 bar: not available We see the Local time (time from the actual log) the same, so supposedly the lines were grabbed by agent in one go and supposedly sent also in single packet (and two lines below mentioned ones as well). Note: you could update issue description yourself instead of the comment above. |
| Comment by Marc [ 2013 Aug 31 ] |
|
Yeah, we briefly discussed the 'Edit' issue before. Do you remember Backt ot the actually issue: The update interval is set to 60 seconds. Since log entries in question came in a bulk within 8 sec, I didn't thought it could be interval related. Aynhow, I believe I played with interval in the past as well - not sure. There is only the PROBLEM event for that time frame - that's the problem. There exist events for the past, but they are days older. The triggers have 'Multiple PROBLEM events generation' not set. I omitted the brackets because I expected them to be not necessary due to operator precedence. Local time is actually not the same. Date formatting just doesn't allow a greater detail. Some additional information about the example in this issue. Edit: Edit: |
| Comment by Marc [ 2013 Aug 31 ] |
|
This expression is another example:
{Template:log["{$LOG_FILE}",FOO BAR,ISO8859-1,1,skip].str(BEGIN)}=1
The corresponding item gets "FOO BAR BEGIN" and "FOO BAR END" values. |
| Comment by Marc [ 2013 Nov 06 ] |
|
Seems not to happen anymore since updating to 2.0.9. |
| Comment by richlv [ 2013 Nov 06 ] |
|
reopen to clear 'fix version' |
| Comment by Marc [ 2013 Nov 08 ] |
|
I've been too early pleased. |
| Comment by Exploit Natixis [ 2013 Dec 18 ] |
|
I suspect I got the same problem but with a zabbix trapper, items with different values are generally generated every 5mn and trigger changes status properly. One time, the delay was 15s between two value and the trigger didn't change its status. Alain |
| Comment by Marc [ 2014 Mar 22 ] |
|
This issue still exists in release 2.2.2 |
| Comment by Marc [ 2014 Jul 07 ] |
|
Apparently didn't happen anymore since updating from 2.2.2 to 2.2.4. |
| Comment by Marc [ 2014 Jul 17 ] |
|
Appears to be fixed. |
| Comment by Oleksii Zagorskyi [ 2014 Jul 17 ] |
|
There were no fixes in zabbix code, issue reopened and closed as cannot reproduce. |
| Comment by Marc [ 2014 Jul 17 ] |
|
Well, there was one that's for sure. But I can't tell which one It's the first time that I can make seriously use of log monitoring functionality in Zabbix and I'm pretty happy about that |
| Comment by Marc [ 2015 Mar 28 ] |
|
Notice this issue again regularly. Edit:
zabbix=# SELECT id,
       clock,
       ns,
       timestamp
FROM history_log
WHERE itemid = 428480
  AND clock = 1427506557
ORDER BY timestamp;
    id     |   clock    |    ns     | timestamp
-----------+------------+-----------+------------
 930030690 | 1427506557 | 114980302 | 1427506503
 930030713 | 1427506557 | 114431409 | 1427506520
(2 rows)

zabbix=#
Judging id and timestamp item values got obviously created in the right chronological order. The ns value looks suspicious though... |
| Comment by Oleksii Zagorskyi [ 2015 Mar 29 ] |
|
Indeed the ns order looks strange. Just FYI: According to What is agent version and agent's OS? Just in case need to remember about |
| Comment by Marc [ 2015 Mar 29 ] |
|
Just took some random samples (out of 60 from last night): 2.0.10, 2.2.0, 2.2.7, 2.4.2 AIX 6100-09-03-1415, CentOS release 5.11 (Final), CentOS release 6.6 (Final), CentOS Linux release 7.0.1406 (Core) Btw, Zabbix server is 2.2.9 and proxies should largely be 2.2.8. Another suspicious detail might be that the issue apparently happens when the both values (BEGIN/END, resp PROBLEM/OK) occur within 30 seconds. But that needs to be double-checked whether it's indeed the case without any exception. Edit: |
| Comment by Glebs Ivanovskis (Inactive) [ 2016 May 24 ] |
|
okkuv9xh, how actively "problematic" agents communicate with server/proxy? There is a chance that log lines A and B (appearing in log in this order) will be sent by agent not in one buffer sending operation, but in two. There is a chance that TCP connection transmitting B will be accepted and processed by server/proxy earlier than connection transmitting A. This way we will get clock&ns(A)>clock&ns(B) and timestamp(A)<timestamp(B) like you pasted above. Is there a still chance to get hold of respective entries from events table? |
| Comment by Glebs Ivanovskis (Inactive) [ 2017 Mar 30 ] |
|
Or the problem can be in proxy_timediff and slightly fluctuating clocks as in |
[ZBX-6869] Getting last event in CTrigger.php is very slow Created: 2013 Aug 08 Updated: 2017 Sep 16 Resolved: 2017 Sep 16 |
|
| Status: | Closed |
| Project: | ZABBIX BUGS AND ISSUES |
| Component/s: | API (A) |
| Affects Version/s: | 2.0.8rc1 |
| Fix Version/s: | None |
| Type: | Incident report | Priority: | Major |
| Reporter: | Alexey Pustovalov | Assignee: | Unassigned |
| Resolution: | Duplicate | Votes: | 1 |
| Labels: | dashboard, events, performance | ||
| Remaining Estimate: | Not Specified | ||
| Time Spent: | Not Specified | ||
| Original Estimate: | Not Specified | ||
| Issue Links: |
|
||||||||
| Description |
|
Getting last event in CTrigger.php is very slow on installations with old PROBLEM triggers, because the query: $lastEvents = DBfetchArrayAssoc(DBselect( 'SELECT '.$select.' FROM events e JOIN ('. 'SELECT max(eventid) as lasteventid FROM events e'. ' WHERE '.dbConditionInt('e.objectid', $triggerids). ' AND '.DBin_node('e.objectid'). ' AND e.object='.EVENT_SOURCE_TRIGGERS. ' AND e.value_changed='.TRIGGER_VALUE_CHANGED_YES. ' GROUP BY e.objectid'. ') ee ON e.eventid=ee.lasteventid' parse a lot of data from events table. For example it is slow for triggers which have events with age more 1-2 months. |
| Comments |
| Comment by Dimitri Bellini [ 2013 Oct 24 ] |
|
I must confirm that issue, below my query: SQL (87.975353): SELECT e.eventid FROM events e WHERE (e.objectid BETWEEN '551573' AND '551580' OR e.objectid BETWEEN '551711' AND '551740' OR e.objectid BETWEEN '551743' AND '551900' OR e.objectid BETWEEN '551903' AND '551932' OR e.objectid BETWEEN '551935' AND '552028' OR e.objectid BETWEEN '552031' AND '552060' OR e.objectid BETWEEN '552063' AND '552092' OR e.objectid BETWEEN '552157' AND '552220' OR e.objectid BETWEEN '552285' AND '552292' OR e.objectid BETWEEN '552487' AND '552516' OR e.objectid BETWEEN '552519' AND '552676' OR e.objectid BETWEEN '552679' AND '552708' OR e.objectid BETWEEN '552711' AND '552804' OR e.objectid BETWEEN '552807' AND '552836' OR e.objectid BETWEEN '552839' AND '552868' OR e.objectid BETWEEN '552933' AND '552996' OR e.objectid BETWEEN '553061' AND '553068' OR e.objectid BETWEEN '553263' AND '553292' OR e.objectid BETWEEN '553295' AND '553452' OR e.objectid BETWEEN '553455' AND '553484' OR e.objectid BETWEEN '553487' AND '553580' OR e.objectid BETWEEN '553583' AND '553612' OR e.objectid BETWEEN '553615' AND '553644' OR e.objectid BETWEEN '553709' AND '553780' OR e.objectid BETWEEN '553975' AND '554004' OR e.objectid BETWEEN '554007' AND '554100' OR e.objectid BETWEEN '554165' AND '554228' OR e.objectid BETWEEN '554231' AND '554260' OR e.objectid BETWEEN '554263' AND '554356' OR e.objectid BETWEEN '554359' AND '554388' OR e.objectid BETWEEN '554391' AND '554420' OR e.objectid BETWEEN '554485' AND '554548' OR e.objectid BETWEEN '598933' AND '598996' OR e.objectid BETWEEN '599253' AND '599444' OR e.objectid IN ('551509','551510','551511','551525','551526','551527','551541','551542','551543','551557','551558','551559','567705','567706','567707','567708','589263','589264','589265','589266','598020','598021','598022','598023')) AND e.objectid BETWEEN 000000000000000 AND 099999999999999 AND e.clock>='1382013097' AND e.clock<='1382617897' AND e.value_changed='1' AND e.object='0' ORDER BY e.eventid DESC LIMIT 201 OFFSET 0 |
| Comment by Oleksii Zagorskyi [ 2015 Sep 18 ] |
|
Could someone confirm is this still actual as for 2.4 ? There were changes in events table, as mentioned bottom of |
| Comment by Alexander Vladishev [ 2017 Sep 16 ] |
|
This SQL statement has been improved in |
[ZBX-6763] Significant performance difference of API method event.get depending on user type Created: 2013 Jul 02 Updated: 2024 Jan 23 Resolved: 2024 Jan 23 |
|
| Status: | Closed |
| Project: | ZABBIX BUGS AND ISSUES |
| Component/s: | API (A) |
| Affects Version/s: | 2.0.6 |
| Fix Version/s: | None |
| Type: | Incident report | Priority: | Trivial |
| Reporter: | Marc | Assignee: | Zabbix Development Team |
| Resolution: | Duplicate | Votes: | 1 |
| Labels: | api, events, performance | ||
| Remaining Estimate: | Not Specified | ||
| Time Spent: | Not Specified | ||
| Original Estimate: | Not Specified | ||
| Environment: |
Linux, CentOS-6.4, PostgreSQL 9.1.9, Apache HTTPD-2.2.15, PHP-5.3.3 |
||
| Attachments: |
|
| Description |
|
There is a significant performance difference in using the API method event.get depending on the user type. The performance of event.get is extremely slow and very heavy for the database in cases where user type is not 'Zabbix Super Admin'. I encounter this issue while testing a 3rd party Zabbix mobile application. After starting the mobile application it wasn't long before the whole Zabbix system became unavailable due to an overloaded Zabbix database. I reproduced the issue by putting the following command twice into a script file for execution. The first call was always set with an 'Zabbix Super Admin' authentication token:
Execution with 1st authentication token = 'Zabbix Super Admin' takes 2 seconds. Execution with 1st authentication token = 'Zabbix Super Admin' takes 2 seconds. Execution with 1st authentication token = 'Zabbix Super Admin' takes 2 seconds. The execution time is multiplied by the number of hostids to query. |
| Comments |
| Comment by richlv [ 2013 Jul 03 ] |
|
although this seems to be more of a permission implementation issue, maybe it's somehow related to |
| Comment by Marc [ 2014 May 21 ] |
|
The issue still exists with release 2.2.2 |
| Comment by Marc [ 2014 Jul 08 ] |
|
Since 2.2.4 the query time is significantly improved - probably caused by Because of that, it's still not usable. Actually this app, admittedly with the best UI, is finally only usable in small Zabbix environments. Anyhow, there is still a difference (1 second vs. 4 seconds in total, 5562kb received) in dependency of the user type. Note: |
| Comment by Kim Jongkwon [ 2018 Jul 03 ] |
|
The issue still exists with 3.0. |
| Comment by Alexander Vladishev [ 2024 Jan 23 ] |
|
Fixed as part of |
[ZBX-6756] Epoch time function now() causes event loop Created: 2013 Jul 01 Updated: 2017 May 30 Resolved: 2013 Jul 02 |
|
| Status: | Closed |
| Project: | ZABBIX BUGS AND ISSUES |
| Component/s: | Server (S) |
| Affects Version/s: | 2.0.4 |
| Fix Version/s: | None |
| Type: | Incident report | Priority: | Minor |
| Reporter: | Jiann-Ming Su | Assignee: | Unassigned |
| Resolution: | Duplicate | Votes: | 0 |
| Labels: | events, trigger | ||
| Remaining Estimate: | Not Specified | ||
| Time Spent: | Not Specified | ||
| Original Estimate: | Not Specified | ||
| Environment: |
RedHat el6.3 |
||
| Attachments: |
|
||||||||
| Issue Links: |
|
||||||||
| Description |
|
Trigger expression looks like this: <code> I basically need ifAlias to take advantage of the MACROs, so I just need a false evaluation for ifAlias in this logical OR statement. The problem seems to be when the trigger fired by the ifInErrors or ifOutErrors, and an event is generated by the specified action, within 30 seconds another event is generated. This goes on ad nauseum, basically an event loop. When I take the now() statement out and replace it with something else that evaluates false, it works as expected with no loops. I've attached a partial screenshot of the Events page. |
| Comments |
| Comment by Oleksii Zagorskyi [ 2013 Jul 02 ] |
|
Do you use Multiple PROBLEM generation in the trigger settings? Do you know that time-related functions processed by a timer process every 30 seconds ? Which is an update interval for ifInErrors and ifOutErrors items ? I don't see here any bugs. |
| Comment by Jiann-Ming Su [ 2013 Jul 02 ] |
|
Update interval for ifInErrors and ifOutErrors is 1800s (30min). |
| Comment by Oleksii Zagorskyi [ 2013 Jul 02 ] |
|
So 30 minutes - as expected. Here no any bugs. |
| Comment by Jiann-Ming Su [ 2013 Jul 02 ] |
|
Sorry, about that. Yes, I use Multiple PROBLEM events generation for this trigger. I didn't realize the timer processes every 30 seconds, at least not the way I used it. I would have expected the now() function to evaluate when one of the 3 items in the trigger was checked. Did not know it checked automatically every 30 seconds. |
[ZBX-6679] Monitoring - Triggers and Monitoring - Events filter displays groups that have no monitored triggers Created: 2013 Jun 10 Updated: 2017 May 30 Resolved: 2013 Jun 12 |
|
| Status: | Closed |
| Project: | ZABBIX BUGS AND ISSUES |
| Component/s: | Frontend (F) |
| Affects Version/s: | 2.1.0 |
| Fix Version/s: | 2.1.0 |
| Type: | Incident report | Priority: | Minor |
| Reporter: | Pavels Jelisejevs (Inactive) | Assignee: | Unassigned |
| Resolution: | Fixed | Votes: | 0 |
| Labels: | events, filters, frontend | ||
| Remaining Estimate: | Not Specified | ||
| Time Spent: | Not Specified | ||
| Original Estimate: | Not Specified | ||
| Description |
|
The host group and host filter should not display host groups and hosts that have no active triggers. The same for the host filter. Monitored trigger:
|
| Comments |
| Comment by Eduards Samersovs (Inactive) [ 2013 Jun 12 ] |
|
Fixed in development branch svn://svn.zabbix.com/branches/dev/ZBX-6679 |
| Comment by Pavels Jelisejevs (Inactive) [ 2013 Jun 12 ] |
|
TESTED. Please review a minor change in r36291. Also, please don't commit the fix and mass refactoring in a single commit. Eduards CLOSED |
| Comment by Eduards Samersovs (Inactive) [ 2013 Jun 12 ] |
|
Fixed in versions pre-2.1.0 (beta) r.36293 |
[ZBX-6648] Some problems in the Monitoring - Events trigger selection pop up Created: 2013 May 31 Updated: 2017 May 30 Resolved: 2013 Jun 28 |
|
| Status: | Closed |
| Project: | ZABBIX BUGS AND ISSUES |
| Component/s: | Frontend (F) |
| Affects Version/s: | 2.1.0 |
| Fix Version/s: | 2.1.0 |
| Type: | Incident report | Priority: | Minor |
| Reporter: | Pavels Jelisejevs (Inactive) | Assignee: | Unassigned |
| Resolution: | Fixed | Votes: | 0 |
| Labels: | events, frontend, popups, triggers | ||
| Remaining Estimate: | Not Specified | ||
| Time Spent: | Not Specified | ||
| Original Estimate: | Not Specified | ||
| Description |
|
There are two problems: 1. The filter contains hosts and groups that have no triggers and disabled hosts; |
| Comments |
| Comment by Pavels Jelisejevs (Inactive) [ 2013 May 31 ] |
|
Problem 1. seems to affect most trigger pop ups. It should be fixed everywhere. |
| Comment by Ivo Kurzemnieks [ 2013 Jun 28 ] |
|
RESOLVED in svn://svn.zabbix.com/branches/dev/ZBX-6648 |
| Comment by Oleg Egorov (Inactive) [ 2013 Jul 02 ] |
|
(1) Coding style, use camelCase in popup.php Please fix $field array structure And popup style ... dstfld2=trigger &srctbl=triggers &srcfld1=triggerid &srcfld2=description ... New parameter - new line iivs RESOLVED in r36664 oleg.egorov CLOSED |
| Comment by Oleg Egorov (Inactive) [ 2013 Jul 02 ] |
|
(2) In configuration.triggers.massupdate.php, configuration.triggers.edit.php... add "with_triggers=1" parameter iivs RESOLVED in r36665 oleg.egorov CLOSED |
| Comment by Oleg Egorov (Inactive) [ 2013 Jul 02 ] |
|
(3) And in configuration.sysmaps.js! iivs RESOLVED in 36666 oleg.egorov CLOSED |
| Comment by Oleg Egorov (Inactive) [ 2013 Jul 02 ] |
|
TESTED |
| Comment by Ivo Kurzemnieks [ 2013 Jul 02 ] |
|
Fixed in pre-2.1.0 (trunk) r36672 |
| Comment by Pavels Jelisejevs (Inactive) [ 2014 Apr 28 ] |
|
This caused a regression: |
[ZBX-6350] Width of event source details is not limited in case of large expressions Created: 2013 Mar 05 Updated: 2017 May 30 Resolved: 2014 Feb 14 |
|
| Status: | Closed |
| Project: | ZABBIX BUGS AND ISSUES |
| Component/s: | Frontend (F) |
| Affects Version/s: | 2.0.5 |
| Fix Version/s: | 2.3.0 |
| Type: | Incident report | Priority: | Trivial |
| Reporter: | Marc | Assignee: | Ivo Kurzemnieks |
| Resolution: | Fixed | Votes: | 1 |
| Labels: | events, layout, patch, usability, width | ||
| Remaining Estimate: | Not Specified | ||
| Time Spent: | Not Specified | ||
| Original Estimate: | Not Specified | ||
| Environment: |
Linux, CentOS-6.3, PostgreSQL 9.1.8, Apache HTTPD-2.2.15, PHP-5.3.3 |
||
| Attachments: |
|
| Description |
|
In case of large trigger expressions the "Event source details" may exceed the screen and make it uncomfortable to access the the information next to it (Acknowledges, Message actions, etc...) - despite the fact that it looks unbeautifully Maybe one can either limit the width of those information blocks or better arrange them vertically. |
| Comments |
| Comment by Pavels Jelisejevs (Inactive) [ 2013 Jun 18 ] |
|
We should just limit the width of the left column. |
| Comment by Marc [ 2013 Jun 18 ] |
|
Similar to ZBXNEXT-1796 |
| Comment by Marc [ 2013 Oct 13 ] |
|
works for me: |
| Comment by Volker Fröhlich [ 2013 Nov 05 ] |
|
The layout is improved but the wrapped line's background is dark-grey. |
| Comment by Volker Fröhlich [ 2013 Nov 05 ] |
|
I confirm |
| Comment by Volker Fröhlich [ 2013 Nov 22 ] |
|
Forward-ported patch for 2.2.0 |
| Comment by Ivo Kurzemnieks [ 2014 Feb 14 ] |
|
RESOLVED in svn://svn.zabbix.com/branches/dev/ZBX-6350 |
| Comment by Pavels Jelisejevs (Inactive) [ 2014 Feb 14 ] |
|
TESTED. |
| Comment by Ivo Kurzemnieks [ 2014 Feb 14 ] |
|
Fixed in pre-2.3.0 (trunk) r42672 |
| Comment by richlv [ 2014 Feb 14 ] |
|
what was the eventual solution ? for example, if it's fixed width, will content wrap now ? iivs Content will be wrapped for table cells "Event", "Trigger" and "Expression". |
[ZBX-6316] Event details view doesn't show non-default messages Created: 2013 Feb 25 Updated: 2017 May 30 Resolved: 2013 Feb 26 |
|
| Status: | Closed |
| Project: | ZABBIX BUGS AND ISSUES |
| Component/s: | Frontend (F) |
| Affects Version/s: | 2.0.5 |
| Fix Version/s: | None |
| Type: | Incident report | Priority: | Minor |
| Reporter: | Marc | Assignee: | Unassigned |
| Resolution: | Cannot Reproduce | Votes: | 0 |
| Labels: | details, events, message | ||
| Remaining Estimate: | Not Specified | ||
| Time Spent: | Not Specified | ||
| Original Estimate: | Not Specified | ||
| Environment: |
Linux, CentOS-6.3, PostgreSQL 9.1.8, Apache HTTPD-2.2.15, PHP-5.3.3 |
||
| Description |
|
The displayed message for message actions within event details is the default message even if there is a non-default message defined for an action operation. |
| Comments |
| Comment by Oleksii Zagorskyi [ 2013 Feb 26 ] |
|
Do you mean "Recovery message" related things ? |
| Comment by Marc [ 2013 Feb 26 ] |
|
Nope. I'm not talking about recovery messages. |
| Comment by richlv [ 2013 Feb 26 ] |
|
custom recovery messages would be as per messages in event details, it should show the message that was actually sent. are you sure that different content is sent to the user than visible in there ? |
| Comment by Marc [ 2013 Feb 26 ] |
|
I have to apologize. I was quite sure to double-check this issue and made sure that this issue exists. But all events I just checked show the right message body. Haven't noted the exact event this issue is based of. Sorry for stealing time of those who were involved! |
[ZBX-6252] docs not saying that all events must be acked for trigger to be acked in monitoring -> triggers Created: 2013 Feb 12 Updated: 2017 May 30 Resolved: 2013 Feb 18 |
|
| Status: | Closed |
| Project: | ZABBIX BUGS AND ISSUES |
| Component/s: | Documentation (D) |
| Affects Version/s: | None |
| Fix Version/s: | 2.0.6, 2.1.0 |
| Type: | Incident report | Priority: | Minor |
| Reporter: | richlv | Assignee: | Martins Valkovskis |
| Resolution: | Fixed | Votes: | 0 |
| Labels: | acknowledges, events, triggers | ||
| Remaining Estimate: | Not Specified | ||
| Time Spent: | Not Specified | ||
| Original Estimate: | Not Specified | ||
| Description |
|
in monitoring -> triggers, a trigger is considered to be acknowledged if all events for it are acknowledged. this should be documented. probably in https://www.zabbix.com/documentation/2.2/manual/web_interface/frontend_sections/monitoring/triggers and other relevant pages for other versions |
| Comments |
| Comment by Martins Valkovskis [ 2013 Feb 18 ] |
|
Documented at: https://www.zabbix.com/documentation/2.2/manual/web_interface/frontend_sections/monitoring/triggers The respective page missing in 1.8 docs...however, indirectly it is mentioned in https://www.zabbix.com/documentation/1.8/manual/about/what_s_new_1.8.3#changed_acknowledge_logic |
[ZBX-6243] After maintenance, actions not displayed in dashboard Created: 2013 Feb 10 Updated: 2019 Dec 10 |
|
| Status: | Open |
| Project: | ZABBIX BUGS AND ISSUES |
| Component/s: | Frontend (F) |
| Affects Version/s: | 2.0.4 |
| Fix Version/s: | None |
| Type: | Incident report | Priority: | Trivial |
| Reporter: | Justin McNutt | Assignee: | Unassigned |
| Resolution: | Unresolved | Votes: | 1 |
| Labels: | alerts, dashboard, events, maintenance | ||
| Remaining Estimate: | Not Specified | ||
| Time Spent: | Not Specified | ||
| Original Estimate: | Not Specified | ||
| Environment: |
Zabbix 2.0.4, MySQL server on separate server. Both servers RHEL 6 x86_64. |
||
| Description |
|
We set a maintenance period, then performed the maintenance. All but one item went back to OK. When the maintenance period ended, the one item still in PROBLEM status caused a notification to be sent. All was as expected. The ONLY odd thing is that on the Dashboard, the Actions column for this item showed a "-" instead of a "1". The Item, Trigger, Maintenance, and Action all work correctly. The only bug is the display issue in the Dashboard. |
| Comments |
| Comment by richlv [ 2013 Jul 11 ] |
|
as discussed with volter today on irc, this happens because after the maintenance ends, a new event is generated and alerts are attached to it. not sure how this could be made more obvious. attaching to the previous event might be misleading. |
| Comment by Justin McNutt [ 2013 Jul 11 ] |
|
I see what you mean, though it's somewhat misleading now. The second event is the one that has the action taken - as I said, the notification does occur correctly - but since only the first event appears on the Dashboard, it appears to the Operators as if there was no notification. On the other hand, if the "Last 20 Events" on the Dashboard were to replace the first event with the second one, that would change the "down since" time displayed, which is also misleading. While the action would be displayd, the "clock" shown would essentially be reset, which is probably worse. This seems to me to be a case where the first event should be updated in the database to show that the action occurred. There shouldn't be too many cases of consecutive PROBLEM events. When the second event occurs and a notification is sent, the actions counter on the previous event for that host should be updated, if and only if the previous event was also a PROBLEM event. |
| Comment by Justin McNutt [ 2013 Jul 11 ] |
|
Alternate solution: Why create a second event when the maintenance ends? How about instead updating the first event? I haven't looked at the schema, but this might necessitate a column for the notification timestamp. That is, something to show that the event started at time X, but the notification was sent at time X+Y. That should solve the display problem. I don't know why the second event is created, so I don't know what other issues might arise from this solution. |
[ZBX-6170] Double event on a single problem Created: 2013 Jan 23 Updated: 2017 Jul 25 Resolved: 2017 Jul 25 |
|
| Status: | Closed |
| Project: | ZABBIX BUGS AND ISSUES |
| Component/s: | Server (S) |
| Affects Version/s: | 2.0.4 |
| Fix Version/s: | None |
| Type: | Incident report | Priority: | Minor |
| Reporter: | thierry regis | Assignee: | Unassigned |
| Resolution: | Cannot Reproduce | Votes: | 3 |
| Labels: | events | ||
| Remaining Estimate: | Not Specified | ||
| Time Spent: | Not Specified | ||
| Original Estimate: | Not Specified | ||
| Environment: |
Zabbix 2.0.4 / postgres 9.1.3 |
||
| Attachments: |
|
||||||||
| Issue Links: |
|
||||||||
| Description |
|
Hi, i haven'nt found this issue , so here we are : Some times , we have two events for a single problem as shown on the attachment. The second attachment show that there is no particular reason that a second problem appears. So , We have two consecutive Problem , and two identical actions are launched It is not linked to nodata() trigger as we had a few days ago the same issue on a triger like : {KYANITE:zabsql.CEPAC.FileDelay.last(0)}>0&{KYANITE:zabsql.CEPAC.FileDelay.time(0)}>040000.
It appears randomly as for the same triggers , there is sometimes only one event , as schown in 3rd attachement. I have quite often lock on the Db on " update ids set nextid=nextid+1 where field_name=events" May be it commes from here ? or do you have suggestions ? thanks thierry |
| Comments |
| Comment by richlv [ 2013 Jan 23 ] |
|
very similar to |
| Comment by thierry regis [ 2013 Jan 23 ] |
|
not linked to unknown status |
| Comment by thierry regis [ 2013 Jan 23 ] |
|
hello sorry but it is not due to unknown status see attachment ( no unknown statut between the two problems.) I think we had the same probleme in previous version but the first occurence did not generate an action. so it was not problematic. tell me if you want to fisnish this issue and continue on the |
| Comment by thierry regis [ 2013 Jan 23 ] |
|
not linked to unknown status |
| Comment by Dan [ 2013 Jan 23 ] |
|
What changes,action you made and after what you detected this problem ? I saw this problem after i made changes on trrigers.... |
| Comment by thierry regis [ 2013 Jan 24 ] |
|
It appears after the migration form 1.8.13 to 2.0.4 in 1.8.13 we had already this problem but as far as i remember , one of the duplicate problem didn't generates an action. for the case we encounter actually it happens randomly on different triggers without any changes on the trigger. i'll try to watch this out precisly the next time it happens but i do not have any ideas at this time . as i told you , the first point as see is the locks we have on the ids table on : all the alerts are sent in an external console through the action , so the alertes comes in double in this console . it is a minor issue, but in some environment it might causes abnormal behaviour. |
| Comment by Oleksii Zagorskyi [ 2013 Jul 08 ] |
|
In case for complex expression (where time-based functions being used) we have also |
| Comment by Oleksii Zagorskyi [ 2013 Jul 08 ] |
|
Of course any problems on DB side (the locks) theoretically could cause such events generating. |
| Comment by Constantin Oshmyan [ 2014 Sep 09 ] |
|
Do you use the "Multiple PROBLEM events generation" trigger option? |
| Comment by Glebs Ivanovskis (Inactive) [ 2017 Jul 25 ] |
|
Support for 2.0 is over, please create a new report is the issue is still present in the latest versions. Closing as Cannot Reproduce. |
[ZBX-6164] trriger reaction problem....2 in row ok with 1 problem Created: 2013 Jan 22 Updated: 2017 Oct 25 Resolved: 2017 Oct 25 |
|
| Status: | Closed |
| Project: | ZABBIX BUGS AND ISSUES |
| Component/s: | Server (S) |
| Affects Version/s: | 2.0.3 |
| Fix Version/s: | None |
| Type: | Incident report | Priority: | Major |
| Reporter: | Dan | Assignee: | Unassigned |
| Resolution: | Unsupported version | Votes: | 0 |
| Labels: | events | ||
| Remaining Estimate: | Not Specified | ||
| Time Spent: | Not Specified | ||
| Original Estimate: | Not Specified | ||
| Attachments: |
|
||||||||
| Issue Links: |
|
||||||||
| Description |
|
Hello , a have 2 servers 1 with MySQL with 3 Gb RAM and CPU Core 2 Xeon, 1 with Apache and Zabbix 2.0.3. |
| Comments |
| Comment by Dan [ 2013 Jan 22 ] |
|
The proble is that that sometimes with that trriger wich is showed in attachment i receive 2 Problem 1 OK or 2 problem 1 OK ... |
| Comment by richlv [ 2013 Jan 22 ] |
|
for event view, please show the filter options - notably, whether "show unknown events" is enabled |
| Comment by Dan [ 2013 Jan 22 ] |
|
Ok, added |
| Comment by Dan [ 2013 Jan 23 ] |
|
I suppose that maybe the UNKNOWN events generate this problem. Thx for answer |
| Comment by richlv [ 2013 Jan 23 ] |
|
very similar to zalex_ua It could, but I'm not absolutely sure because trigger expression in the |
| Comment by Oleksii Zagorskyi [ 2013 Jul 08 ] |
|
No, there only one (very last) unknown event, it's not related to the previous duplicated events, so there indeed is something strange. Would be good to know expression for that trigger. Try to update zabbix server to 2.0.6 and reproduce the problem. |
| Comment by Oleksii Zagorskyi [ 2013 Jul 08 ] |
|
Make sure also that it's not the same as |
[ZBX-6154] Events and Alerts not replicated properly in a Distributed Monitoring setup Created: 2013 Jan 19 Updated: 2017 May 30 Resolved: 2015 Feb 02 |
|
| Status: | Closed |
| Project: | ZABBIX BUGS AND ISSUES |
| Component/s: | Server (S) |
| Affects Version/s: | 2.0.4 |
| Fix Version/s: | None |
| Type: | Incident report | Priority: | Major |
| Reporter: | Yaroslav Zhavoronkov | Assignee: | Unassigned |
| Resolution: | Won't fix | Votes: | 0 |
| Labels: | dm, events, patch | ||
| Remaining Estimate: | Not Specified | ||
| Time Spent: | Not Specified | ||
| Original Estimate: | Not Specified | ||
| Attachments: |
|
| Description |
|
In a Distributed Monitoring setup of several nodes, where Node 1 is a master and Node 2 is a child of Node 1: When a Trigger for an Item located at Node 2 is created via the web interface at Node 1, an "unknown event" for that Trigger is created in the `events' table of the database at Node 1. eventid of this "unknown_event" is set according to the local & remote node IDs and is (for Node 1 id=1 and Node 2 id=2) in the range of 200100xxxxxxxxxxx. So, after creating a new Trigger and appearing the "unknown event" of its creation in the database of Node 1, the replication of all events occurring at Node 2 to Node 1 STOPS completely. Steps to reproduce: <1) Possible solution: change send_history_last_id() function to select only node-local IDs (up to NNN00099999999999 instead of NNN99999999999999) for specified node ID (see patch attached). The same issue is addressed in the ticket https://support.zabbix.com/browse/ZBX-5929. |
| Comments |
| Comment by richlv [ 2015 Feb 02 ] |
|
with nodes being removed since 2.4, this issue is unlikely to be looked in |
[ZBX-6119] can't view events in monitoring -> triggers Created: 2013 Jan 14 Updated: 2017 May 30 Resolved: 2013 Jan 21 |
|
| Status: | Closed |
| Project: | ZABBIX BUGS AND ISSUES |
| Component/s: | Frontend (F) |
| Affects Version/s: | 2.1.0 |
| Fix Version/s: | 2.1.0 |
| Type: | Incident report | Priority: | Blocker |
| Reporter: | richlv | Assignee: | Unassigned |
| Resolution: | Fixed | Votes: | 0 |
| Labels: | events, regression, triggers | ||
| Remaining Estimate: | Not Specified | ||
| Time Spent: | Not Specified | ||
| Original Estimate: | Not Specified | ||
| Environment: |
trunk rev 32746. |
||
| Attachments: |
|
| Description |
|
monitoring -> triggers, enable event displaying in the filter. events are not displayed. regression, broken by : ------------------------------------------------------------------------ A.F.....S. i don't really understand why macro support in trigger comments should break event displaying - unless the commit message is incomplete on purpose. |
| Comments |
| Comment by Eduards Samersovs (Inactive) [ 2013 Jan 16 ] |
|
In <richlv> in monitoring -> triggers, set "Events" dropdown to show all or unack. expected : we can expand events for individual triggers with a "+" icon. Eduards Not true, I see events. Describe your event, may be it's is special.. <richlv>
triggers show up but no "+" icon for any of them. clicking on the "last change" timestamp for one of them results in events being displayed. see https://support.zabbix.com/secure/attachment/21343/missing_events.png for those events |
| Comment by Eduards Samersovs (Inactive) [ 2013 Jan 17 ] |
|
I still see events.. https://support.zabbix.com/secure/attachment/21344/zbx-6119.png |
| Comment by Eduards Samersovs (Inactive) [ 2013 Jan 18 ] |
|
Fixed in development branch svn://svn.zabbix.com/branches/dev/ZBX-6119 r.32915 |
| Comment by richlv [ 2013 Jan 18 ] |
|
could you please expand on what exactly was the root cause of the problem ? thanks Eduards Seems it's was not fully merged versions conflicts.. |
| Comment by Oleg Egorov (Inactive) [ 2013 Jan 21 ] |
|
(1) Filter: Undefined index: events [s.php:732] Invalid argument supplied for foreach() [s.php:732] Eduards RESOLVED r.32955 oleg.egorov CLOSED |
| Comment by Oleg Egorov (Inactive) [ 2013 Jan 21 ] |
|
TESTED. |
| Comment by Eduards Samersovs (Inactive) [ 2013 Jan 21 ] |
|
Fixed in versions pre-2.1.0 (beta) r32971 |
[ZBX-6070] Export events to CSV only exports 1st page, no matter which page is displayed Created: 2013 Jan 07 Updated: 2017 May 30 Resolved: 2013 Jan 09 |
|
| Status: | Closed |
| Project: | ZABBIX BUGS AND ISSUES |
| Component/s: | Frontend (F) |
| Affects Version/s: | 2.0.2, 2.1.0 |
| Fix Version/s: | 2.0.5rc1, 2.1.0 |
| Type: | Incident report | Priority: | Major |
| Reporter: | Oleksii Zagorskyi | Assignee: | Unassigned |
| Resolution: | Fixed | Votes: | 0 |
| Labels: | csv, events, export, regression | ||
| Remaining Estimate: | Not Specified | ||
| Time Spent: | Not Specified | ||
| Original Estimate: | Not Specified | ||
| Issue Links: |
|
||||
| Description |
|
Should work according https://www.zabbix.com/documentation/2.0/manual/introduction/whatsnew200#event_export_to_csv Regression, broken in |
| Comments |
| Comment by Pavels Jelisejevs (Inactive) [ 2013 Jan 08 ] |
|
(1) If you have some host group selected in the filter, open the event page and try to export the events, the host filter will not be applied. Same thing with the trigger filter. jelisejev RESOLVED. oleg.egorov CLOSED. |
| Comment by Pavels Jelisejevs (Inactive) [ 2013 Jan 08 ] |
|
RESOLVED in svn://svn.zabbix.com/branches/dev/ZBX-6070. |
| Comment by Oleg Egorov (Inactive) [ 2013 Jan 08 ] |
|
(2) Last page contain data as first in CSV doc. (Source: Trigger) jelisejev This only seems to happen when you select a page and then change the filter. RESOLVED in r32583. oleg.egorov CLOSED. |
| Comment by Oleg Egorov (Inactive) [ 2013 Jan 08 ] |
|
(3) Review my changes in r32576 jelisejev Thanks, CLOSED. |
| Comment by Oleg Egorov (Inactive) [ 2013 Jan 09 ] |
|
Tested! |
| Comment by Pavels Jelisejevs (Inactive) [ 2013 Jan 09 ] |
|
Fixed in 2.0.5rc1 r32607 and 2.1.0 r32608. CLOSED. |
| Comment by Nicola Canepa [ 2015 Sep 07 ] |
|
It looks like there is a regression in 2.4.5. |
| Comment by Oleksii Zagorskyi [ 2015 Sep 07 ] |
|
Nicola, take into account ZBXNEXT-1753 and if you are still considering it as a regression - create new bug report. |
| Comment by richlv [ 2017 May 14 ] |
|
regression eventually reported as |
[ZBX-6005] Monitoring->Events with Source = Discovery always check permissions for triggers (for non Super-Admin users) Created: 2012 Dec 16 Updated: 2017 May 30 Resolved: 2013 Jan 29 |
|
| Status: | Closed |
| Project: | ZABBIX BUGS AND ISSUES |
| Component/s: | API (A), Frontend (F) |
| Affects Version/s: | 2.0.5rc1, 2.1.0 |
| Fix Version/s: | 2.0.5rc1 |
| Type: | Incident report | Priority: | Critical |
| Reporter: | Alexey Pustovalov | Assignee: | Unassigned |
| Resolution: | Fixed | Votes: | 0 |
| Labels: | discovery, events | ||
| Remaining Estimate: | Not Specified | ||
| Time Spent: | Not Specified | ||
| Original Estimate: | Not Specified | ||
| Environment: |
|
||
| Description |
|
The problem in the CEvent class: if $options['object'] is not defined, it is always equal 0. |
| Comments |
| Comment by Alexey Pustovalov [ 2012 Dec 16 ] |
Index: api/classes/CEvent.php
===================================================================
--- api/classes/CEvent.php      (revision 32148)
+++ api/classes/CEvent.php      (working copy)
@@ -115,7 +115,8 @@
                                $options['object'] = EVENT_OBJECT_TRIGGER;
                        }

-                       if ($options['object'] == EVENT_OBJECT_TRIGGER || $options['source'] == EVENT_SOURCE_TRIGGERS) {
+                       if ((isset($options['object']) && $options['object'] == EVENT_OBJECT_TRIGGER) ||
+                                                   (isset($options['source']) && $options['source'] == EVENT_SOURCE_TRIGGERS)) {
                                if (!is_null($options['triggerids'])) {
                                        $triggers = API::Trigger()->get(array(
                                                'triggerids' => $options['triggerids'],
|
| Comment by Pavels Jelisejevs (Inactive) [ 2013 Jan 21 ] |
|
Fix for 2.0 is available at svn://svn.zabbix.com/branches/dev/ZBX-6005. tomtom Review my changes in r33199, if OK merge jelisejev We cannot use string type comparison here because these parameters can be passed as either integers or strings. |
| Comment by Pavels Jelisejevs (Inactive) [ 2013 Jan 23 ] |
|
Fix for trunk is available at svn://svn.zabbix.com/branches/dev/ZBX-6005-trunk. |
| Comment by Toms (Inactive) [ 2013 Jan 29 ] |
|
(1) For trunk. I suggest to make this code part the same it is in 2.0 and as it was before trunk r32527. as well there is related issue jelisejev For the trunk this problem will be fixed in |
| Comment by Pavels Jelisejevs (Inactive) [ 2013 Jan 29 ] |
|
Fixed in 2.0.5rc1 r33204. |
| Comment by Pavels Jelisejevs (Inactive) [ 2013 Jan 29 ] |
|
CLOSED. |
[ZBX-5856] An existing trigger expression when modified doesn't recalculate with new item value Created: 2012 Nov 14 Updated: 2017 May 30 Resolved: 2015 Mar 09 |
|
| Status: | Closed |
| Project: | ZABBIX BUGS AND ISSUES |
| Component/s: | Server (S) |
| Affects Version/s: | 2.0.3 |
| Fix Version/s: | None |
| Type: | Incident report | Priority: | Major |
| Reporter: | Brian Woods | Assignee: | Unassigned |
| Resolution: | Cannot Reproduce | Votes: | 0 |
| Labels: | evaluation, events, items, triggers | ||
| Remaining Estimate: | Not Specified | ||
| Time Spent: | Not Specified | ||
| Original Estimate: | Not Specified | ||
| Environment: |
Red Hat Enterprise Linux 6.3 x86_64 |
||
| Description |
|
I created a 'Test' trigger that is using zabbix agent ping item: {Template App Zabbix Agent:agent.ping.last(0)}=1
This creates a PROBLEM as it should. I change the trigger to: {Template App Zabbix Agent:agent.ping.last(0)}=2
I never receive an OK. Another scenario: Using an older Zabbix Appliance with version 2.0.0 and MySQL: I modify the "Too many processes on Zabbix server" trigger to: {Zabbix server:proc.num[].last(0)}>50
This created a PROBLEM event. I modify the trigger again with: {Zabbix server:proc.num[].last(0)}>500
I never receive an OK event. |
| Comments |
| Comment by Brian Woods [ 2012 Nov 14 ] |
|
Using the Zabbix 2.0.0 Appliance with no other hosts configured but the Zabbix Server itself, I tried to see if I see the same issue with the 'nodata' trigger expressions. I did the following: "Zabbix agent on {HOSTNAME} is unreachable for 5 minutes" I changed this from: {Template App Zabbix Agent:agent.ping.nodata(5m)}=1
to: {Template App Zabbix Agent:agent.ping.nodata(5m)}=0
A PROBLEM event occurs as it should. Then I change this trigger from: {Template App Zabbix Agent:agent.ping.nodata(5m)}=0
to: {Template App Zabbix Agent:agent.ping.nodata(5m)}=1
NO change. Then I change this trigger again from: {Template App Zabbix Agent:agent.ping.nodata(5m)}=1
to: {Template App Zabbix Agent:agent.ping.nodata(1m)}=1
NO change. |
| Comment by Oleksii Zagorskyi [ 2012 Nov 15 ] |
|
Doesn't look as a bug. Probably something miss configured or wrong interpretation. |
| Comment by Brian Woods [ 2012 Nov 15 ] |
|
I don't see how anything could be a misconfiguration. I'm using the Zabbix Appliance with the Zabbix Server as my test host to verify this. The only thing that works and I don't see this issue with so far are items with 'vfs.file.exist' and 'zabbix trapper'. Please try the proc.num case above on 2.0.3 to see if you can replicate this issue. Thanks, |
| Comment by richlv [ 2012 Nov 15 ] |
|
strange. i was going to write this off as a misconfiguration myself, but i seem to be able to reproduce the problem. tried with 2.0 branch rev 31467. |
| Comment by richlv [ 2012 Nov 15 ] |
|
weird. it only seemed to do that the first time i touched that trigger. server even generated two problem events in a row. if i modify same trigger later, it seems to work as expected... |
| Comment by Alexander Vladishev [ 2015 Mar 09 ] |
|
Closing as "Cannot Reproduce" |
[ZBX-5824] ITEM.VALUE macro doesn't resolve correctly under Events during the recovery trigger Created: 2012 Nov 08 Updated: 2017 May 30 Resolved: 2012 Nov 16 |
|
| Status: | Closed |
| Project: | ZABBIX BUGS AND ISSUES |
| Component/s: | Frontend (F) |
| Affects Version/s: | 2.0.3 |
| Fix Version/s: | 2.0.4rc1, 2.1.0 |
| Type: | Incident report | Priority: | Minor |
| Reporter: | Ryan Rupp | Assignee: | Oleg Egorov (Inactive) |
| Resolution: | Fixed | Votes: | 0 |
| Labels: | events, macros | ||
| Remaining Estimate: | Not Specified | ||
| Time Spent: | Not Specified | ||
| Original Estimate: | Not Specified | ||
| Environment: |
Zabbix Appliance |
||
| Attachments: |
|
| Description |
|
To setup I've attached a template that shows the example. The template has a zabbix trapper item in it and a trigger that checks if the value > 0. The trigger name uses {ITEM.VALUE1} in it so the message should say "Test Trigger - <value>". I use the Zabbix Sender to send a value of 1 which triggers the PROBLEM event. This shows up correctly under the Events screen. Then I send another value this time with 0 so the RECOVERY event occurs however in the Events page the {ITEM.VALUE1}macro isn't resolved with the value "0". Attached screenshots. |
| Comments |
| Comment by Ryan Rupp [ 2012 Nov 08 ] |
|
Actually, after testing this further {ITEM.VALUE1} can't resolve itself if the value is 0, it doesn't matter if it's a PROBLEM or RECOVERY trigger it just can't resolve the value 0. Attaching other screenshots the first is - ItemValueWorksWithNonZero.PNG - I changed the trigger to be > 1 and then passed the values 2 then 1 and both resolved correctly. Then in the next screenshot - ItemValueNotWorkingWhen0.PNG - I changed the trigger to be > -1 and sent the value 0 and it couldn't resolve the {ITEM.VALUE1}macro. |
| Comment by Oleg Egorov (Inactive) [ 2012 Nov 16 ] |
|
FIXED IN 2.0.4 r30666 ( |
[ZBX-5771] Acknowledge tickmark lost on Overview page after server adds UNKNOWN event Created: 2012 Oct 30 Updated: 2017 May 30 Resolved: 2012 Nov 08 |
|
| Status: | Closed |
| Project: | ZABBIX BUGS AND ISSUES |
| Component/s: | Frontend (F) |
| Affects Version/s: | 2.0.4rc1, 2.1.0 |
| Fix Version/s: | None |
| Type: | Incident report | Priority: | Major |
| Reporter: | Alexey Pustovalov | Assignee: | Oleg Egorov (Inactive) |
| Resolution: | Fixed | Votes: | 0 |
| Labels: | acknowledges, events, overview | ||
| Remaining Estimate: | Not Specified | ||
| Time Spent: | Not Specified | ||
| Original Estimate: | Not Specified | ||
| Issue Links: |
|
||||
| Description |
|
On the Overview page (triggers selected) we can look tickmark if event is acknowledged. Fronted uses the next function for getting last event: That function does not consider "unchanged values" events. So if Zabbix server will be restarted the tickmark will be missed. |
| Comments |
| Comment by Oleg Egorov (Inactive) [ 2012 Nov 02 ] |
|
RESOLVED IN svn://svn.zabbix.com/branches/dev/ZBX-5771 r31214 |
| Comment by Toms (Inactive) [ 2012 Nov 06 ] |
|
(1) TRIGGER_VALUE_UNKNOWN constant instead of magic "2" should be used oleg.egorov RESOLVED IN r31327 tomtom CLOSED |
| Comment by Toms (Inactive) [ 2012 Nov 06 ] |
|
(2) there is related problem, that if we open event acknowledge window from Monitoring > Overview .. clicking .. Problem Trigger > Menu > Acknowledge oleg.egorov RESOLVED IN r31327 tomtom CLOSED |
| Comment by Toms (Inactive) [ 2012 Nov 14 ] |
|
TESTED |
| Comment by Oleg Egorov (Inactive) [ 2012 Nov 14 ] |
|
FIXED IN 2.0.4 r31448, 2.1.0 r31450 |
[ZBX-5719] Some problems with event.get Created: 2012 Oct 22 Updated: 2017 May 30 Resolved: 2013 Jan 29 |
|
| Status: | Closed |
| Project: | ZABBIX BUGS AND ISSUES |
| Component/s: | API (A) |
| Affects Version/s: | 2.1.0 |
| Fix Version/s: | 2.1.0 |
| Type: | Incident report | Priority: | Major |
| Reporter: | Pavels Jelisejevs (Inactive) | Assignee: | Unassigned |
| Resolution: | Fixed | Votes: | 0 |
| Labels: | api, events | ||
| Remaining Estimate: | Not Specified | ||
| Time Spent: | Not Specified | ||
| Original Estimate: | Not Specified | ||
| Issue Links: |
|
||||||||
| Description |
|
There are two problems with event.get: 1. It has a showUnknown parmeter, which was, probably, added to retrieve unknown events. But currently unknown events are returned by default and the parameter doesn't do anything. |
| Comments |
| Comment by Pavels Jelisejevs (Inactive) [ 2013 Jan 07 ] |
|
RESOLVED in svn://svn.zabbix.com/branches/dev/ZBX-5719. |
| Comment by Oleg Egorov (Inactive) [ 2013 Jan 07 ] |
|
Tested! |
| Comment by Pavels Jelisejevs (Inactive) [ 2013 Jan 08 ] |
|
Fixed in 2.1.0 r32527. CLOSED. |
| Comment by Pavels Jelisejevs (Inactive) [ 2013 Jan 21 ] |
|
(1) Regarding 2. it has been decided that event.get with no parameters should return only trigger events. jelisejev It will be fixed in |
[ZBX-5712] Trigger still in an OK/PROBLEM status if expression has changed Created: 2012 Oct 19 Updated: 2017 May 30 Resolved: 2014 Mar 12 |
|
| Status: | Closed |
| Project: | ZABBIX BUGS AND ISSUES |
| Component/s: | API (A), Frontend (F) |
| Affects Version/s: | 2.0.3, 2.1.0 |
| Fix Version/s: | None |
| Type: | Incident report | Priority: | Major |
| Reporter: | Alexander Vladishev | Assignee: | Unassigned |
| Resolution: | Won't fix | Votes: | 1 |
| Labels: | events, expressions, trigger | ||
| Remaining Estimate: | Not Specified | ||
| Time Spent: | Not Specified | ||
| Original Estimate: | Not Specified | ||
| Description |
|
API doesn't generate an UNKNOWN event if expression has changed. |
| Comments |
| Comment by richlv [ 2012 Oct 19 ] |
|
is this a regression ? <Sasha> Yes. From version 2.0.0. |
| Comment by Alexander Romanov [ 2012 Oct 23 ] |
|
Perhaps, I have this problem: Host linux, Template App Zabbix Server, item: Zabbix busy history syncer processes, in % 2012.Oct.23 04:29:42 39.0155 2012.Oct.23 04:28:54 91.976 2012.Oct.23 04:28:14 100 2012.Oct.23 04:15:42 100 2012.Oct.23 04:13:14 79.1582 2012.Oct.23 04:11:42 12.8031 2012.Oct.23 04:10:42 5.962 2012.Oct.23 04:09:42 3.7135 2012.Oct.23 04:08:42 34.7606 Between 04:15 and 04:30 CPU was very busy. >75 Format error or unsupported operator. Exp: [,7578]
in log
11161:20121023:204944.056 In DBget_trigger_update_sql() triggerid:14259 value:1(1) new_value:2
11161:20121023:204944.056 End of DBget_trigger_update_sql():SUCCEED

11161:20121023:204944.056 query [txnlev:1] [begin

update triggers set error='Format error or unsupported operator. Exp: [,7328]' where triggerid=14259;
end;
]
PS problem began, after resolving |
| Comment by Brian Woods [ 2012 Nov 05 ] |
|
Zabbix 2.0.3 My history syncer process wasn't very busy at all. I created a 'Test' trigger that is using zabbix agent ping item: {Template App Zabbix Agent:agent.ping.last(0)}=1 This creates a PROBLEM as it should. I change the trigger to: {Template App Zabbix Agent:agent.ping.last(0)}=2 I never receive an OK. |
| Comment by Alexander Vladishev [ 2014 Mar 12 ] |
|
This functionality (UNKNOWN events) was removed from version 2.2.0. Related issue: I'm closing the issue. |
[ZBX-5709] Trigger id is recreated after trigger expression was modified. Created: 2012 Oct 18 Updated: 2017 May 30 Resolved: 2012 Oct 24 |
|
| Status: | Closed |
| Project: | ZABBIX BUGS AND ISSUES |
| Component/s: | Frontend (F) |
| Affects Version/s: | 2.1.0 |
| Fix Version/s: | 2.1.0 |
| Type: | Incident report | Priority: | Critical |
| Reporter: | Alexey Pustovalov | Assignee: | Unassigned |
| Resolution: | Fixed | Votes: | 0 |
| Labels: | events, triggers | ||
| Remaining Estimate: | Not Specified | ||
| Time Spent: | Not Specified | ||
| Original Estimate: | Not Specified | ||
| Description |
|
For example, trigger expression very simple: {Template_APC_Automatic_Transfer_Switch:icmpping.last(0)}#1 #1& {Template_APC_Automatic_Transfer_Switch:icmpping.last(0)}#1 |
| Comments |
| Comment by Alexander Vladishev [ 2012 Oct 19 ] |
|
I can't reproduce the issue. Please add more details. |
| Comment by Oleksii Zagorskyi [ 2012 Oct 19 ] |
|
I can confirm the bug (at least for trunk rev 30948). When updating you will receive these green messages: But I can NOT reproduce it on current 20 branch (rev 30950) and 2.0.3 release |
| Comment by richlv [ 2012 Oct 19 ] |
|
a regression then. anybody knows which rev broke it ? |
| Comment by Toms (Inactive) [ 2012 Oct 23 ] |
|
Fixed in dev. branch: svn://svn.zabbix.com/branches/dev/ZBX-5709 |
| Comment by Alexey Fukalov [ 2012 Oct 24 ] |
|
(1) tomtom RESOLVED in r31055 Vedmak CLOSED |
| Comment by Toms (Inactive) [ 2012 Nov 05 ] |
|
Fixed in 2.1.0 r31251 |
[ZBX-5708] Multiple PROBLEM/OK events in sequence after changing trigger expression Created: 2012 Oct 18 Updated: 2017 May 30 Resolved: 2012 Nov 13 |
|
| Status: | Closed |
| Project: | ZABBIX BUGS AND ISSUES |
| Component/s: | Server (S) |
| Affects Version/s: | 2.0.4rc1, 2.1.0 |
| Fix Version/s: | None |
| Type: | Incident report | Priority: | Major |
| Reporter: | Alexey Pustovalov | Assignee: | Unassigned |
| Resolution: | Duplicate | Votes: | 0 |
| Labels: | events, trigger | ||
| Remaining Estimate: | Not Specified | ||
| Time Spent: | Not Specified | ||
| Original Estimate: | Not Specified | ||
| Issue Links: |
|
||||||||
| Description |
|
It may happen when an user change expression while trigger in PROBLEM and OK states. It calls multiple PROBLEM and OK events respectively. |
| Comments |
| Comment by Alexey Pustovalov [ 2012 Nov 13 ] |
|
It is dubplicated for |
| Comment by Oleksii Zagorskyi [ 2012 Nov 13 ] |
|
Just a note - I tested different version of server with latest trunk only frontend. That's why I was not able to reproduce (I performed tests with already fixed in UPDATE triggers SET expression=' {15567}=10', triggerid='13564', error='Trigger expression updated. No status update so far.' WHERE (triggerid IN ('13564')) UPDATE triggers SET expression=' {15568}=10', url='', status='1', value='0', priority='4', lastchange='0', comments='', error='Trigger expression updated. No status update so far.', templateid='13564', type='0', value_flags='1', flags='0', triggerid='13566' WHERE (triggerid IN ('13566')) That's why server generated additional duplicated event after every change on template level. |
[ZBX-5636] acknowledge block empty in event details if there are no acknowledgements Created: 2012 Sep 30 Updated: 2017 May 30 Resolved: 2012 Oct 19 |
|
| Status: | Closed |
| Project: | ZABBIX BUGS AND ISSUES |
| Component/s: | Frontend (F) |
| Affects Version/s: | 2.0.3rc1 |
| Fix Version/s: | 2.0.4rc1, 2.1.0 |
| Type: | Incident report | Priority: | Minor |
| Reporter: | richlv | Assignee: | Unassigned |
| Resolution: | Fixed | Votes: | 0 |
| Labels: | acknowledges, events, regression | ||
| Remaining Estimate: | Not Specified | ||
| Time Spent: | Not Specified | ||
| Original Estimate: | Not Specified | ||
| Issue Links: |
|
||||||||
| Description |
|
acknowledge block is empty (missing the table) if there are no acknowledges for an event. broken by : r22573 | eduards | 2011-10-20 15:41:34 +0300 (Thu, 20 Oct 2011) | 1 line
(i wanted to report this one a long time ago, but only now got to finding out the actual breakage revision |
| Comments |
| Comment by Alexey Fukalov [ 2012 Oct 01 ] |
|
dev branch: svn://svn.zabbix.com/branches/dev/ZBX-5636 |
| Comment by Eduards Samersovs (Inactive) [ 2012 Oct 05 ] |
|
Tested! |
| Comment by Alexey Fukalov [ 2012 Oct 05 ] |
|
Fixed in 2.0.4rc1 r30659, pre-2.1.0 r30661. |
| Comment by richlv [ 2012 Oct 09 ] |
|
this resulted in strange behaviour : |
| Comment by Alexander Vladishev [ 2012 Oct 15 ] |
|
(1) |
| Comment by Alexey Fukalov [ 2012 Oct 15 ] |
|
dev branch: svn://svn.zabbix.com/branches/dev/ZBX-5636 Hint was removed from 'status of triggers' and 'event details' pages. |
| Comment by Eduards Samersovs (Inactive) [ 2012 Oct 16 ] |
|
Tested! |
| Comment by Alexey Fukalov [ 2012 Oct 16 ] |
|
Fixed in 2.0.4rc1 r30853, pre-2.1.0 r30854. |
[ZBX-5633] Mysql Duplicate Entry when adding a new host with a template, or when linking a template to an existing host : "Duplicate Entry in key 1 of table events"). Created: 2012 Sep 28 Updated: 2017 May 30 Resolved: 2012 Oct 09 |
|
| Status: | Closed |
| Project: | ZABBIX BUGS AND ISSUES |
| Component/s: | Frontend (F), Server (S) |
| Affects Version/s: | 2.0.1 |
| Fix Version/s: | None |
| Type: | Incident report | Priority: | Major |
| Reporter: | Nizar TLILI | Assignee: | Unassigned |
| Resolution: | Won't fix | Votes: | 0 |
| Labels: | eventid, events, ids, nextid | ||
| Remaining Estimate: | Not Specified | ||
| Time Spent: | Not Specified | ||
| Original Estimate: | Not Specified | ||
| Environment: |
Suse Linux |
||
| Description |
|
The table ids is not correctly updated by zabbix-server mysql> select max(eventid) from events; select * from ids where table_name='events'; update ids set nextid=((select max(eventid) from events) + 1 ) where table_name='events'; select max(eventid) from events; select * from ids where table_name='events'; --------------
--------------
-------------- -------------- -------
-------
------- -------------- Query OK, 1 row affected (0.03 sec) -------------- --------------
--------------
-------------- -------------- -------
-------
------- |
| Comments |
| Comment by richlv [ 2012 Sep 28 ] |
|
reopening to remove 'confirmed' status. one shouldn't confirm their own issues |
| Comment by Oleksii Zagorskyi [ 2012 Sep 28 ] |
|
Nizar, check please your email in account properties - looks like it's incorrect and notifications cannot be delivered to you. |
| Comment by Oleksii Zagorskyi [ 2012 Sep 28 ] |
|
You wrote that you have the auto-increment column "eventid" from the table "events" I think issue should be closed as won't fix. |
| Comment by Nizar TLILI [ 2012 Sep 29 ] |
|
Hi Oleksiy, |
[ZBX-5579] Web-interface displays "Acknowledged" even if a trigger has no events Created: 2012 Sep 12 Updated: 2017 May 30 Resolved: 2012 Oct 23 |
|
| Status: | Closed |
| Project: | ZABBIX BUGS AND ISSUES |
| Component/s: | Frontend (F) |
| Affects Version/s: | 2.0.3, 2.1.0 |
| Fix Version/s: | 2.0.4rc1, 2.1.0 |
| Type: | Incident report | Priority: | Minor |
| Reporter: | Alexey Pustovalov | Assignee: | Unassigned |
| Resolution: | Fixed | Votes: | 0 |
| Labels: | acknowledges, events, triggers | ||
| Remaining Estimate: | Not Specified | ||
| Time Spent: | Not Specified | ||
| Original Estimate: | Not Specified | ||
| Attachments: |
|
||||||||
| Issue Links: |
|
||||||||
| Description |
|
Web-interface calculates a number of acknowledged events on the tr_status.php and if events do not exist at all web-interface display "Acknowledged" anyway. |
| Comments |
| Comment by Alexey Pustovalov [ 2012 Sep 12 ] |
|
The problem here: if($trigger['event_count']){
$to_ack = new CCol(array(new CLink(_('Acknowledge'), 'acknow.php?triggers[]='.$trigger['triggerid'].'&backurl='.$page['file'], 'on'), ' ('.$trigger['event_count'].')'));
}
else{
$to_ack = new CCol(_('Acknowledged'), 'off');
}
We think all events already acknowledged if $trigger['event_count'] non-exist or equal 0. But if a trigger has not any events we can not say what they has been acknowledged! |
| Comment by richlv [ 2012 Sep 12 ] |
|
but if there are no events, what should we display then ? |
| Comment by Alexey Pustovalov [ 2012 Sep 12 ] |
|
old fired triggers can be without events (small keep time of events for records or partitioning). |
| Comment by Alexey Fukalov [ 2012 Sep 17 ] |
|
We decided to show 'No events' string for such triggers. |
| Comment by Alexey Fukalov [ 2012 Sep 17 ] |
|
dev branch: svn://svn.zabbix.com/branches/dev/ZBX-5579 |
| Comment by Pavels Jelisejevs (Inactive) [ 2012 Sep 18 ] |
|
(1) If I select a host without triggers on the trigger status page, I receive an error: Undefined variable: triggerIdsWithoutUnackEvents [tr_status.php:400] Vedmak RESOLVED jelisejev CLOSED. |
| Comment by Pavels Jelisejevs (Inactive) [ 2012 Sep 18 ] |
|
(2) Can you please change 'noEvents' to 'hasEvents'. I, personally, think it's more intuitive that way. Vedmak RESOLVED jelisejev CLOSED. |
| Comment by Pavels Jelisejevs (Inactive) [ 2012 Sep 19 ] |
|
TESTED. |
| Comment by Alexey Fukalov [ 2012 Oct 04 ] |
|
Fixed in 2.0.4rc1 r30536, pre-2.1.0 r30537. |
| Comment by Alexander Vladishev [ 2012 Oct 19 ] |
|
(3) Triggers in an "Acknowledged" status if trigger has only unknown or not significant events. We can't acknowledge these events. https://support.zabbix.com/secure/attachment/20492/acknowledged-triggers.jpg |
| Comment by Alexey Fukalov [ 2012 Oct 19 ] |
|
Dev branch: svn://svn.zabbix.com/branches/dev/ZBX-5579 |
| Comment by Alexey Pustovalov [ 2012 Oct 20 ] |
|
(4) That change should be documented on http://www.zabbix.com/documentation/2.0/manual/web_interface/frontend_sections/monitoring/triggers <richlv> mentioned in http://www.zabbix.com/documentation/2.0/manual/introduction/whatsnew204 martins-v Documented in alexei CLOSED |
| Comment by Eduards Samersovs (Inactive) [ 2012 Oct 22 ] |
|
(5) Error if filter events by "Show unknown events": Vedmak seems it caused by event from templated trigger |
| Comment by Eduards Samersovs (Inactive) [ 2012 Oct 22 ] |
|
(6) Please pass $_REQUEST['showUnknown'] directly as option to Event API |
| Comment by Eduards Samersovs (Inactive) [ 2012 Oct 23 ] |
|
Tested! |
| Comment by Alexey Fukalov [ 2012 Oct 23 ] |
|
Fixed in 2.0.4rc1 r31036, pre-2.1.0 r31037. |
[ZBX-5286] duplicated eventid in acknowledge output Created: 2012 Jul 06 Updated: 2019 Dec 10 |
|
| Status: | Open |
| Project: | ZABBIX BUGS AND ISSUES |
| Component/s: | API (A) |
| Affects Version/s: | None |
| Fix Version/s: | None |
| Type: | Incident report | Priority: | Trivial |
| Reporter: | richlv | Assignee: | Unassigned |
| Resolution: | Unresolved | Votes: | 0 |
| Labels: | acknowledges, events | ||
| Remaining Estimate: | Not Specified | ||
| Time Spent: | Not Specified | ||
| Original Estimate: | Not Specified | ||
| Description |
|
when acknowledges are returned with event.get, each ack entry has eventid identifying it and a duplicate eventid inside the ack details (because of the db structure). one of these should be dropped |
[ZBX-5237] File with exported into CSV events contains garbage Created: 2012 Jun 25 Updated: 2017 May 30 Resolved: 2012 Jun 26 |
|
| Status: | Closed |
| Project: | ZABBIX BUGS AND ISSUES |
| Component/s: | Frontend (F) |
| Affects Version/s: | 2.0.0 |
| Fix Version/s: | 2.0.2rc1, 2.1.0 |
| Type: | Incident report | Priority: | Critical |
| Reporter: | Dmitry Sergienko | Assignee: | Unassigned |
| Resolution: | Fixed | Votes: | 0 |
| Labels: | events, regression | ||
| Remaining Estimate: | Not Specified | ||
| Time Spent: | Not Specified | ||
| Original Estimate: | Not Specified | ||
| Environment: |
Linux Debian 5.0, FreeBSD 8.2 |
||
| Attachments: |
|
||||||||
| Issue Links: |
|
||||||||
| Description |
|
When I try to export events into CSV file I receive file with garbage (HTML/JS code) at the beginning of this file like this: <div id="scriptDialog" style="display:none " |
| Comments |
| Comment by richlv [ 2012 Jun 25 ] |
|
confirming in 2.0.0 |
| Comment by richlv [ 2012 Jun 25 ] |
|
note that it's not just garbage being at the top of the file, actual event information is not included at all <pavels> Data seems to be exported correctly when I try it. <richlv> oh, apparently i had few enough events to miss them between all that mess, CLOSED |
| Comment by Pavels Jelisejevs (Inactive) [ 2012 Jun 26 ] |
|
Broken by r24986, |
| Comment by Pavels Jelisejevs (Inactive) [ 2012 Jun 26 ] |
|
RESOLVED in svn://svn.zabbix.com/branches/dev/ZBX-5237. |
| Comment by Dmitry Sergienko [ 2012 Jun 26 ] |
|
Thanks for fast response to this bug. |
| Comment by Toms (Inactive) [ 2012 Jun 26 ] |
|
TESTED |
| Comment by Pavels Jelisejevs (Inactive) [ 2012 Jun 28 ] |
|
Fixed in 2.0 r28504 and trunk r28505. CLOSED. |
[ZBX-5218] Editing trigger prototype expression for already discovered triggers is generating orphaned triggers Created: 2012 Jun 20 Updated: 2017 May 30 Resolved: 2012 Jun 21 |
|
| Status: | Closed |
| Project: | ZABBIX BUGS AND ISSUES |
| Component/s: | Server (S) |
| Affects Version/s: | 2.0.0, 2.1.0 |
| Fix Version/s: | 2.0.2rc1, 2.1.0 |
| Type: | Incident report | Priority: | Blocker |
| Reporter: | Oleksii Zagorskyi | Assignee: | Unassigned |
| Resolution: | Fixed | Votes: | 0 |
| Labels: | events, lld, orphaned, trigger | ||
| Remaining Estimate: | Not Specified | ||
| Time Spent: | Not Specified | ||
| Original Estimate: | Not Specified | ||
| Attachments: |
|
||||||||
| Issue Links: |
|
||||||||
| Description |
|
We have one poller configured to simplify debugging, discovery rule update interval - 60 seconds. Short scenario is:
...
23079:20120620:143154.400 query [txnlev:1] [insert into functions (functionid,itemid,triggerid,function,parameter) values (15207,26700,221169,'last','0'),(15208,26701,221170,'last','0'); <5',priority=2,comments='',url='',type=0,flags=4 where triggerid=221169; delete from functions where triggerid=221169; update triggers set description='Free disk space is less than 10% on volume D: ',expression='{15208}<5',priority=2,comments='',url='',type=0,flags=4 where triggerid=221170; update trigger_discovery set name='Free disk space is less than 10% on volume {#FSNAME} ' where triggerid=221170 and parent_triggerid=221158;
23079:20120620:143254.432 query [txnlev:1] [insert into triggers (triggerid,description,expression,priority,status,comments,url,type,value,value_flags,flags,error) values (221171,'Free disk space is less than 10% on volume C: <5',2,0,'','',0,0,1,4,'Trigger just added. No status update so far.'),(221172,'Free disk space is less than 10% on volume D: <5',2,0,'','',0,0,1,4,'Trigger just added. No status update so far.'); '); Note that between two discovery executions there are NO visible and working triggers for the host(s) !!! In the result we have orphaned triggers (which were before) in the DB (triggers without functions) and if those triggers generated events - it will be visible in the events page if select All for host groups and hosts. In the attachment you can see all these queries with all related parts with DebugLevel=4 To find such triggers here is a simple SQL: To delete orphaned event (if they are) and triggers here is two simple SQLs (order is important): |
| Comments |
| Comment by Oleksii Zagorskyi [ 2012 Jun 20 ] |
|
(1) Note - in every production DB there is one such WEB trigger which came from data.sql <Sasha> RESOLVED in r28388. (WEB trigger removed from data.tmpl) <richlv> including the frontend ? wouldn't it bork up something like trigger count somewhere (monitoring, config...) or anything else ? |
| Comment by Oleksii Zagorskyi [ 2012 Jun 20 ] |
|
(2) Please check also behavior of discovered graphs for similar cases. Maybe there is also something that should/could be improved? <Sasha> WON'T FIX graphs works as expected |
| Comment by Alexander Vladishev [ 2012 Jun 21 ] |
|
Fixed in development branch svn://svn.zabbix.com/branches/dev/ZBX-5218 |
| Comment by dimir [ 2012 Jun 22 ] |
|
Successfully tested! |
| Comment by dimir [ 2012 Jun 25 ] |
|
Fix assignee. |
| Comment by dimir [ 2012 Jun 29 ] |
|
Fixed in pre-2.0.2 r28566, pre-2.1.0 r28567. |
| Comment by Oleksii Zagorskyi [ 2012 Jul 03 ] |
|
Just small conclusion of this fix. With this fix server is doing the same - after next discovery it recreates just trigger functions, without changing IDs of discovered triggers. That's fine because we can use discovered triggers in action conditions and do not afraid that they will be deleted (as condition of course) after changing the expression in the prototype. THANKS! |
[ZBX-5049] remove event.create and event.delete API methods from documentation and source code Created: 2012 May 23 Updated: 2017 May 30 Resolved: 2012 Aug 28 |
|
| Status: | Closed |
| Project: | ZABBIX BUGS AND ISSUES |
| Component/s: | API (A), Documentation (D) |
| Affects Version/s: | 1.8.14rc1, 2.1.0 |
| Fix Version/s: | 2.0.3rc1, 2.1.0 |
| Type: | Incident report | Priority: | Major |
| Reporter: | Oleksii Zagorskyi | Assignee: | Martins Valkovskis |
| Resolution: | Fixed | Votes: | 0 |
| Labels: | API, events | ||
| Remaining Estimate: | Not Specified | ||
| Time Spent: | Not Specified | ||
| Original Estimate: | Not Specified | ||
| Issue Links: |
|
||||||||
| Description |
|
Once we discussed that they are "wrong" and once must be deleted. |
| Comments |
| Comment by Oleksii Zagorskyi [ 2012 May 27 ] |
|
(1) [Documentation] Pages: A note has been added: RESOLVED |
| Comment by Oleksii Zagorskyi [ 2012 Aug 23 ] |
|
Take a look also to |
| Comment by Eduards Samersovs (Inactive) [ 2012 Aug 27 ] |
|
Resolved in |
| Comment by Oleksii Zagorskyi [ 2012 Aug 27 ] |
|
(2) is this ok that a function "acknowledge" also removed ? <Eduard> RESOLVED. Ups, Monday morning :-]] |
| Comment by Eduards Samersovs (Inactive) [ 2012 Aug 28 ] |
|
Resolved in |
[ZBX-4888] Discovery event flapping Created: 2012 Apr 18 Updated: 2017 May 30 Resolved: 2013 Feb 26 |
|
| Status: | Closed |
| Project: | ZABBIX BUGS AND ISSUES |
| Component/s: | Server (S) |
| Affects Version/s: | 1.8.8, 1.8.11 |
| Fix Version/s: | None |
| Type: | Incident report | Priority: | Major |
| Reporter: | Matthias Drobny | Assignee: | Unassigned |
| Resolution: | Cannot Reproduce | Votes: | 0 |
| Labels: | actions, discovery, events | ||
| Remaining Estimate: | Not Specified | ||
| Time Spent: | Not Specified | ||
| Original Estimate: | Not Specified | ||
| Environment: |
OS: gentoo, mysql |
||
| Attachments: |
|
| Description |
|
Zabbix creates "down"/"lost" events even if the host is available. Maybe it's just a misunderstanding, but I couldn't find any documentation when being "down" will lead to be "lost". // SQL query to get the raw data // laptop |
| Comments |
| Comment by Alexander Vladishev [ 2012 Apr 19 ] |
|
Hi, Could you please attach a Discovery rule screenshot. Thanks. |
| Comment by Matthias Drobny [ 2012 Apr 19 ] |
|
Screenshot of discovery rule |
| Comment by richlv [ 2013 Feb 22 ] |
|
does this still happen ? which fping version is used ? |
| Comment by Matthias Drobny [ 2013 Feb 26 ] |
|
We updated to 2.0x changed the discovery actions and didn't dig any more into the problem. It should have been the ipv4-fping, if that's what you wanted to know. IMHO the bug report can be closed, I can't reproduce the behaviour at the moment. |
| Comment by Oleksii Zagorskyi [ 2013 Feb 26 ] |
|
Closed as requested. |
[ZBX-4763] Possible incorrect events for complex triggers Created: 2012 Mar 15 Updated: 2017 Oct 25 Resolved: 2017 Oct 25 |
|
| Status: | Closed |
| Project: | ZABBIX BUGS AND ISSUES |
| Component/s: | Server (S) |
| Affects Version/s: | 1.8.11, 2.0.0rc2 |
| Fix Version/s: | None |
| Type: | Incident report | Priority: | Major |
| Reporter: | Alexey Pustovalov | Assignee: | Unassigned |
| Resolution: | Unsupported version | Votes: | 2 |
| Labels: | events | ||
| Remaining Estimate: | Not Specified | ||
| Time Spent: | Not Specified | ||
| Original Estimate: | Not Specified | ||
| Issue Links: |
|
||||
| Description |
|
When a trigger has few items in expression it can be processed by few history syncers. an example (DebugLevel=4): eventid from_unixtime(e.clock) eventid from_unixtime(e1.clock) key_ functionid itemid triggerid function parameter triggerid expression descriptio
3026295 2012-03-10 15:29:18 3026216 2012-03-10 15:29:19 icmppingloss 702056 1155559 417340 last 0 417340 ({702056}>20)&({702057}=1) Packets loss >20%
3026295 2012-03-10 15:29:18 3026216 2012-03-10 15:29:19 icmpping 702057 1155558 417340 last 0 417340 ({702056}>20)&({702057}=1) Packets loss >20%
the same but with another trigger: 3026487 2012-03-10 15:29:33 3026449 2012-03-10 15:29:34 icmppingloss 391839 682174 247319 last 0 247319 ({391839}>20)&({391840}=1) Packets loss >20%
3026487 2012-03-10 15:29:33 3026449 2012-03-10 15:29:34 icmpping 391840 682173 247319 last 0 247319 ({391839}>20)&({391840}=1) Packets loss >20%
and records from zabbix_server debug log (for first example): cat test.log | grep 3026216 17924:20120310:152921.888 End of DBget_nextid():3026216 table:'events' recid:'eventid' 17924:20120310:152921.888 In process_event() eventid:3026216 object:0 objectid:417340 value:0 value_changed:0 17924:20120310:152921.888 query [txnlev:1] [insert into events (eventid,source,object,objectid,clock,ns,value,value_changed) values (3026216,0,0,417340,1331371759,450565427,0,0)] cat test.log | grep 3026295 17919:20120310:152922.397 In process_event() eventid:3026295 object:0 objectid:417340 value:0 value_changed:0 17919:20120310:152922.397 query [txnlev:1] [insert into events (eventid,source,object,objectid,clock,ns,value,value_changed) values (3026295,0,0,417340,1331371758,662994086,0,0)] We see that triggerid=417340 processed by two history syncers (PIDs: 17924, 17919) with interval in 0,5 second. |
| Comments |
| Comment by Oleksii Zagorskyi [ 2012 Mar 15 ] |
|
Very similar issue is |
| Comment by Aleksandrs Saveljevs [ 2016 Feb 03 ] |
|
Is this still a problem after |
[ZBX-4631] Time control on an empty event page Created: 2012 Feb 08 Updated: 2017 May 30 Resolved: 2012 Sep 18 |
|
| Status: | Closed |
| Project: | ZABBIX BUGS AND ISSUES |
| Component/s: | Frontend (F) |
| Affects Version/s: | 1.8.10, 1.9.8 (beta) |
| Fix Version/s: | None |
| Type: | Incident report | Priority: | Minor |
| Reporter: | Pavels Jelisejevs (Inactive) | Assignee: | Unassigned |
| Resolution: | Won't fix | Votes: | 0 |
| Labels: | events, timeperiodselection, usability | ||
| Remaining Estimate: | Not Specified | ||
| Time Spent: | Not Specified | ||
| Original Estimate: | Not Specified | ||
| Description |
|
If there are no events on the events page, it's possible to select a time period up to 1971. It should be somehow limited. |
| Comments |
| Comment by Alexei Vladishev [ 2012 Sep 18 ] |
|
I and Sasha decided to close it, it's a generic issue with our time control. |
[ZBX-4609] strcmp() expects parameter 2 to be string, array given [include/func.inc.php:1136] Created: 2012 Feb 05 Updated: 2017 May 30 Resolved: 2012 Feb 13 |
|
| Status: | Closed |
| Project: | ZABBIX BUGS AND ISSUES |
| Component/s: | Frontend (F) |
| Affects Version/s: | None |
| Fix Version/s: | None |
| Type: | Incident report | Priority: | Blocker |
| Reporter: | richlv | Assignee: | Unassigned |
| Resolution: | Duplicate | Votes: | 0 |
| Labels: | events | ||
| Remaining Estimate: | Not Specified | ||
| Time Spent: | Not Specified | ||
| Original Estimate: | Not Specified | ||
| Environment: |
trunk rev 25203 |
||
| Description |
|
when viewing monitoring -> events as a guest user : strcmp() expects parameter 2 to be string, array given [include/func.inc.php:1136] doesn't appear with a superadmin account. can be seen at https://www.zabbix.org/zabbix/events.php |
| Comments |
| Comment by Oleksii Zagorskyi [ 2012 Feb 05 ] |
|
I can confirm. |
| Comment by Alexander Vladishev [ 2012 Feb 13 ] |
|
It is duplicate of |
[ZBX-4599] Warning on the Monitoring - Events page for guests Created: 2012 Jan 30 Updated: 2017 May 30 Resolved: 2012 Feb 08 |
|
| Status: | Closed |
| Project: | ZABBIX BUGS AND ISSUES |
| Component/s: | Frontend (F) |
| Affects Version/s: | 1.9.9 (beta) |
| Fix Version/s: | 2.0.0rc1 |
| Type: | Incident report | Priority: | Major |
| Reporter: | Pavels Jelisejevs (Inactive) | Assignee: | Unassigned |
| Resolution: | Fixed | Votes: | 0 |
| Labels: | events | ||
| Remaining Estimate: | Not Specified | ||
| Time Spent: | Not Specified | ||
| Original Estimate: | Not Specified | ||
| Attachments: |
|
| Description |
|
The error only appears when loggin in as a guest. |
| Comments |
| Comment by Pavels Jelisejevs (Inactive) [ 2012 Feb 09 ] |
|
Merged to trunk r25308. CLOSED. |
[ZBX-4583] Event details don't show - PHP error: object _footer is not defined Created: 2012 Jan 26 Updated: 2017 May 30 Resolved: 2012 Apr 02 |
|
| Status: | Closed |
| Project: | ZABBIX BUGS AND ISSUES |
| Component/s: | Frontend (F) |
| Affects Version/s: | 1.9.8 (beta) |
| Fix Version/s: | 2.0.0rc3 |
| Type: | Incident report | Priority: | Major |
| Reporter: | Jens Berthold | Assignee: | Unassigned |
| Resolution: | Fixed | Votes: | 0 |
| Labels: | events, gui | ||
| Remaining Estimate: | Not Specified | ||
| Time Spent: | Not Specified | ||
| Original Estimate: | Not Specified | ||
| Environment: |
Debian 6.0.3 |
||
| Description |
|
Main contents (below menu bar) on page "Event details" don't show. Apache throws a PHP Fatal error: Call to a member function setAttribute() on a non-object in /var/www/zabbix/include/classes/class.cuiwidget.php on line 98, referer: http://1.2.3.4/zabbixevents.php?sid=a43d3cd4365cec91&form_refresh=1&fullscreen=0&groupid=3&hostid=10073&source=0 When I comment out line 98 in class.cuiwidget.php, it works: Looks like $this->_footer is not defined, maybe method setFooter() in same class never get's called for some reason? |
| Comments |
| Comment by richlv [ 2012 Jan 26 ] |
|
for the record, couldn't reproduce this with trunk rev 25028 or 1.9.8, both with php 5.3.3 and 5.3.5 |
| Comment by Oleksii Zagorskyi [ 2012 Jan 26 ] |
|
I cannot reproduce too in Zabbix trunk rev 25028. |
| Comment by Jens Berthold [ 2012 Jan 26 ] |
|
Seems to be user related - when I log in as "Admin", the page displays. But when logging in as another user (Zabbix Super Admin, LDAP authenticated), it fails. |
| Comment by Lupu rau [ 2012 Feb 27 ] |
|
I have the same problem: zabbix version : 1.9.10 I didn't have this problem from the beginning, it started a couple of days back. |
| Comment by Alexey Fukalov [ 2012 Apr 02 ] |
|
dev branch: svn://svn.zabbix.com/branches/dev/ZBX-4583 |
| Comment by Alexey Fukalov [ 2012 Apr 04 ] |
|
svn://svn.zabbix.com/trunk 26616 |
[ZBX-4446] Incorrect event duration Created: 2011 Dec 15 Updated: 2017 May 30 Resolved: 2011 Dec 15 |
|
| Status: | Closed |
| Project: | ZABBIX BUGS AND ISSUES |
| Component/s: | Frontend (F) |
| Affects Version/s: | 1.9.8 (beta) |
| Fix Version/s: | 1.9.9 (beta) |
| Type: | Incident report | Priority: | Blocker |
| Reporter: | Pavels Jelisejevs (Inactive) | Assignee: | Unassigned |
| Resolution: | Fixed | Votes: | 0 |
| Labels: | events | ||
| Remaining Estimate: | Not Specified | ||
| Time Spent: | Not Specified | ||
| Original Estimate: | Not Specified | ||
| Attachments: |
|
| Description |
|
The highlighted trigger should have the same duration as the first one, not zero. |
| Comments |
| Comment by Pavels Jelisejevs (Inactive) [ 2011 Dec 15 ] |
|
RESOLVED. |
| Comment by Oleksii Zagorskyi [ 2011 Dec 16 ] |
|
May this fix help for <pavels> No, it doesn't affect the "last changed" column, only the duration. |
| Comment by Alexander Vladishev [ 2011 Dec 16 ] |
|
TESTED. Please review my changes in r24043. |
| Comment by Pavels Jelisejevs (Inactive) [ 2011 Dec 19 ] |
|
Merged to trunk r24057. CLOSED. |
[ZBX-4418] zabbix_server [98798]: ERROR [file:db.c,line:1464] Something impossible has just happened. Created: 2011 Dec 05 Updated: 2017 May 30 Resolved: 2011 Dec 09 |
|
| Status: | Closed |
| Project: | ZABBIX BUGS AND ISSUES |
| Component/s: | Server (S) |
| Affects Version/s: | 1.9.8 (beta) |
| Fix Version/s: | 1.9.9 (beta), 2.0.0 |
| Type: | Incident report | Priority: | Blocker |
| Reporter: | Danilo Chilene | Assignee: | Unassigned |
| Resolution: | Fixed | Votes: | 0 |
| Labels: | events, sql | ||
| Remaining Estimate: | Not Specified | ||
| Time Spent: | Not Specified | ||
| Original Estimate: | Not Specified | ||
| Environment: |
FreeBSD srv-zabbix01.trendeiras 8.2-RELEASE-p4 FreeBSD 8.2-RELEASE-p4 #5: Mon Dec 5 07:57:08 BRST 2011 [email protected]:/usr/obj/usr/src/sys/TREND amd64 FreeBSD inside vmware, typical instalation. (root@srv-zabbix01 - ~ @14:29:40) ./configure --prefix=/usr/local --sysconfdir=/usr/local/etc/zabbix --enable-server --enable-agent --with-mysql --with-libcurl --with-net-snmp --with-ssh2 --with-ldap --with-openipmi |
||
| Description |
|
Strange behavior of log /tmp/zabbix_server.log Below the error: 98798:20111205:143001.507 [Z3005] query failed: [1690] BIGINT UNSIGNED value is out of range in '(`zabbix`.`ids`.`nextid` + -(5256))' [update ids set nextid=nextid+-5256 where nodeid=0 and table_name='events' and field_name='eventid'] |
| Comments |
| Comment by Alexander Vladishev [ 2011 Dec 09 ] |
|
Fixed in the development branch svn://svn.zabbix.com/branches/dev/ZBX-4418 |
| Comment by dimir [ 2011 Dec 12 ] |
|
Tested. |
| Comment by Alexander Vladishev [ 2011 Dec 12 ] |
|
Fixed in version pre-1.9.9, revision 23920. |
[ZBX-4246] Incorrect events/triggers display in dashboard Created: 2011 Oct 17 Updated: 2017 May 30 Resolved: 2014 Oct 06 |
|
| Status: | Closed |
| Project: | ZABBIX BUGS AND ISSUES |
| Component/s: | Frontend (F), Server (S) |
| Affects Version/s: | None |
| Fix Version/s: | None |
| Type: | Incident report | Priority: | Critical |
| Reporter: | Alexey Pustovalov | Assignee: | Unassigned |
| Resolution: | Fixed | Votes: | 0 |
| Labels: | dashboard, events | ||
| Remaining Estimate: | Not Specified | ||
| Time Spent: | Not Specified | ||
| Original Estimate: | Not Specified | ||
| Attachments: |
|
| Description |
select from_unixtime(clock), e.* from events e where objectid = 159242
order by clock desc;
2011-10-17 13:14:13	5279005	0	0	159242	1318835653	1	0	276355345	0
2011-10-17 13:10:13	5188035	0	0	159242	1318835413	2	0	0	0
2011-10-17 06:35:13	4978195	0	0	159242	1318811713	1	1	95532327	1
2011-10-17 06:32:13	4976276	0	0	159242	1318811533	0	0	77579027	1
2011-10-17 06:28:13	4974529	0	0	159242	1318811293	1	1	148463509	1
select * from triggers where triggerid = 159242;
159242 {287431}=100 ?????????? ?????????? [{PROFILE.LOCATION1}] 0 1 4 1318835653 83518 0
In dashboard and triggers monitoring showing incorrect information about when trigger change status to PROBLEM. |
| Comments |
| Comment by Alexey Pustovalov [ 2014 Oct 06 ] |
|
closed as not actual. |
[ZBX-3208] wrong event clock for unknown trigger Created: 2010 Nov 11 Updated: 2017 May 30 Resolved: 2012 Jan 29 |
|
| Status: | Closed |
| Project: | ZABBIX BUGS AND ISSUES |
| Component/s: | Server (S) |
| Affects Version/s: | 1.8.4rc2 |
| Fix Version/s: | None |
| Type: | Incident report | Priority: | Major |
| Reporter: | Aleksandrs Saveljevs | Assignee: | Unassigned |
| Resolution: | Fixed | Votes: | 2 |
| Labels: | events, triggers | ||
| Remaining Estimate: | Not Specified | ||
| Time Spent: | Not Specified | ||
| Original Estimate: | Not Specified | ||
| Attachments: |
|
| Description |
|
Suppose we have a trapper item of type unsigned integer. Its trigger is in the OK state. We send two values, one shortly after another: -1 and 1. The first one causes a trigger to become UNKNOWN, the other changes the trigger's state back to OK. For some reason, it is possible that the UNKNOWN event has a lower eventid than the OK event, but have a clock higher than the OK event. |
| Comments |
| Comment by Aleksandrs Saveljevs [ 2011 Mar 02 ] |
|
This happens because pollers and pingers set triggers to unknown and update database directly for items that become unsupported. |
| Comment by Alexander Vladishev [ 2012 Jan 03 ] |
|
Already fixed in version 1.8.6, r19893 in |
[ZBX-3073] gui generates multiple unknown events when disabling and enabling hosts Created: 2010 Oct 05 Updated: 2017 May 30 Resolved: 2012 Mar 10 |
|
| Status: | Closed |
| Project: | ZABBIX BUGS AND ISSUES |
| Component/s: | Frontend (F) |
| Affects Version/s: | 1.8.4rc1 |
| Fix Version/s: | None |
| Type: | Incident report | Priority: | Major |
| Reporter: | Aleksandrs Saveljevs | Assignee: | Unassigned |
| Resolution: | Fixed | Votes: | 0 |
| Labels: | events | ||
| Remaining Estimate: | Not Specified | ||
| Time Spent: | Not Specified | ||
| Original Estimate: | Not Specified | ||
| Attachments: |
|
| Description |
|
Disabling and enabling a host generates an unknown event. The problem is that multiple sequential unknown events can be generated. See multiple-unknown.png. This bug is a continuation of |
| Comments |
| Comment by Alexander Vladishev [ 2012 Mar 10 ] |
|
Fixed in version 1.9.7 r22172 with |
[ZBX-3037] event acknowledge status not synchronised properly Created: 2010 Sep 24 Updated: 2017 May 30 Resolved: 2011 Oct 18 |
|
| Status: | Closed |
| Project: | ZABBIX BUGS AND ISSUES |
| Component/s: | Server (S) |
| Affects Version/s: | None |
| Fix Version/s: | None |
| Type: | Incident report | Priority: | Major |
| Reporter: | richlv | Assignee: | Unassigned |
| Resolution: | Duplicate | Votes: | 1 |
| Labels: | acknowledges, distributed, events | ||
| Remaining Estimate: | Not Specified | ||
| Time Spent: | Not Specified | ||
| Original Estimate: | Not Specified | ||
| Issue Links: |
|
||||||||
| Description |
|
zabbix server synchronises events, and if they are later acknowledged on a child node, also acknowledges. unfortunately, upon ack sync event status ('acknowledged' field in events table) is not properly updated, thus acknowledges can not be seen on the master node. |
| Comments |
| Comment by richlv [ 2011 Aug 10 ] |
|
possibly related to : |
[ZBX-3036] an event is missing on a child node, but visible in parent node Created: 2010 Sep 24 Updated: 2017 May 30 Resolved: 2015 Feb 02 |
|
| Status: | Closed |
| Project: | ZABBIX BUGS AND ISSUES |
| Component/s: | Server (S) |
| Affects Version/s: | None |
| Fix Version/s: | None |
| Type: | Incident report | Priority: | Critical |
| Reporter: | richlv | Assignee: | Unassigned |
| Resolution: | Won't fix | Votes: | 0 |
| Labels: | dm, events | ||
| Remaining Estimate: | Not Specified | ||
| Time Spent: | Not Specified | ||
| Original Estimate: | Not Specified | ||
| Issue Links: |
|
||||||||
| Description |
|
an unknown event, generated by child, is visible on the master, but not on the child. it is also missing from the child database |
| Comments |
| Comment by richlv [ 2011 Aug 29 ] |
|
given that events are generated on the master node independently, this might not be a sync issue, but something else (docs previously claimed otherwise) |
| Comment by richlv [ 2015 Feb 02 ] |
|
with nodes being removed since 2.4, this issue is unlikely to be looked in, closing |
[ZBX-3030] Incorrect events duration in Monitoring/Events screen Created: 2010 Sep 22 Updated: 2017 May 30 Resolved: 2012 Mar 11 |
|
| Status: | Closed |
| Project: | ZABBIX BUGS AND ISSUES |
| Component/s: | None |
| Affects Version/s: | 1.8.3, 1.8.4, 1.8.6 |
| Fix Version/s: | 1.8.8 |
| Type: | Incident report | Priority: | Major |
| Reporter: | Alexander Vladishev | Assignee: | Unassigned |
| Resolution: | Fixed | Votes: | 1 |
| Labels: | events | ||
| Remaining Estimate: | Not Specified | ||
| Time Spent: | Not Specified | ||
| Original Estimate: | Not Specified | ||
| Environment: |
Zabbix 1.8.3, 1.8.4rc1 rev. 14563 |
||
| Attachments: |
|
||||
| Issue Links: |
|
||||
| Comments |
| Comment by Alexander Vladishev [ 2011 Aug 21 ] |
|
Is present at version 1.8.6 |
| Comment by Alexey Fukalov [ 2011 Aug 24 ] |
|
dev branch: svn://svn.zabbix.com/branches/dev/ZBX-3030 |
| Comment by Eduards Samersovs (Inactive) [ 2011 Aug 29 ] |
|
Tested |
| Comment by Eduards Samersovs (Inactive) [ 2011 Sep 02 ] |
|
branches/1.8 revision 21466 |
| Comment by richlv [ 2011 Sep 05 ] |
|
"fix versions" says 2.0, but this was only merged to 1.8. that doesn't seem to be correct. |
| Comment by Alexey Fukalov [ 2011 Sep 21 ] |
|
But does this problem exists in 2.0, there is no Unknown events.. |
| Comment by Alexander Vladishev [ 2012 Mar 11 ] |
|
Fixed in version 1.8.8 r21466 |
[ZBX-2722] event duration is calculated incorrectly due to eventid caching Created: 2010 Jul 19 Updated: 2017 May 30 Resolved: 2013 Feb 08 |
|
| Status: | Closed |
| Project: | ZABBIX BUGS AND ISSUES |
| Component/s: | Frontend (F) |
| Affects Version/s: | None |
| Fix Version/s: | None |
| Type: | Incident report | Priority: | Critical |
| Reporter: | Aleksandrs Saveljevs | Assignee: | Unassigned |
| Resolution: | Fixed | Votes: | 0 |
| Labels: | events | ||
| Remaining Estimate: | Not Specified | ||
| Time Spent: | Not Specified | ||
| Original Estimate: | Not Specified | ||
| Environment: |
r13351 of 1.8 |
||
| Attachments: |
|
||||||||
| Issue Links: |
|
||||||||
| Description |
|
See wrong-duration.png. The durations marked with red keep updating, even though newer events exist. This happens because these UNKNOWN events have bigger eventid's than the newer ones. |
| Comments |
| Comment by Alexander Vladishev [ 2013 Feb 08 ] |
|
Caching of eventids is removed from version 1.8.9. I'm closing the issue. |
[ZBX-2721] No UNKNOWN events in Event details screen. Created: 2010 Jul 19 Updated: 2017 May 30 Resolved: 2012 Feb 20 |
|
| Status: | Closed |
| Project: | ZABBIX BUGS AND ISSUES |
| Component/s: | Frontend (F) |
| Affects Version/s: | 1.8.3 |
| Fix Version/s: | None |
| Type: | Incident report | Priority: | Critical |
| Reporter: | Alexander Vladishev | Assignee: | Unassigned |
| Resolution: | Won't fix | Votes: | 0 |
| Labels: | events | ||
| Remaining Estimate: | Not Specified | ||
| Time Spent: | Not Specified | ||
| Original Estimate: | Not Specified | ||
| Environment: |
Zabbix pre1.8.3, r13356. |
||
| Attachments: |
|
| Comments |
| Comment by richlv [ 2010 Aug 24 ] |
|
is the problem still reproducible ? |
| Comment by Alexei Vladishev [ 2012 Feb 20 ] |
|
According to Sasha the problem is no longer reproducible in the latest 1.8.x. |
[ZBX-2455] can't change host/group if filtered by a trigger Created: 2010 May 24 Updated: 2017 May 30 Resolved: 2011 Aug 31 |
|
| Status: | Closed |
| Project: | ZABBIX BUGS AND ISSUES |
| Component/s: | None |
| Affects Version/s: | None |
| Fix Version/s: | 2.0.0 |
| Type: | Incident report | Priority: | Major |
| Reporter: | richlv | Assignee: | Unassigned |
| Resolution: | Fixed | Votes: | 0 |
| Labels: | events, usability | ||
| Remaining Estimate: | Not Specified | ||
| Time Spent: | Not Specified | ||
| Original Estimate: | Not Specified | ||
| Issue Links: |
|
||||||||
| Description |
|
monitoring -> events, filter by a trigger. try to change hostgroup or host - nothing happens. quite confusing. |
| Comments |
| Comment by richlv [ 2011 Aug 31 ] |
|
in current trunk, event filter is reset when host or host group is changed |
[ZBX-2437] Trigger Timestamp is messed up Created: 2010 May 17 Updated: 2017 May 30 Resolved: 2011 Aug 30 |
|
| Status: | Closed |
| Project: | ZABBIX BUGS AND ISSUES |
| Component/s: | Server (S) |
| Affects Version/s: | 1.8.2 |
| Fix Version/s: | 2.0.0 |
| Type: | Incident report | Priority: | Major |
| Reporter: | Vitaly Zhuravlev | Assignee: | Unassigned |
| Resolution: | Duplicate | Votes: | 0 |
| Labels: | events, triggers | ||
| Remaining Estimate: | Not Specified | ||
| Time Spent: | Not Specified | ||
| Original Estimate: | Not Specified | ||
| Environment: |
Zbx 1.8.2 on Ubuntu Server 8.04 32bit + |
||
| Attachments: |
|
||||||||
| Issue Links: |
|
||||||||
| Description |
|
Timestamp when trigger come to OK status is earlier than timestamp when trigger come to PROBLEM status (see screen) This thing happens with many different hosts, time is correct on both servers |
| Comments |
| Comment by Vitaly Zhuravlev [ 2010 May 17 ] |
|
http://www.zabbix.com/forum/showpost.php?p=61147&postcount=7 |
| Comment by richlv [ 2010 Aug 25 ] |
|
what's the load on zabbix server and database server ? what item type is this ? |
| Comment by Vitaly Zhuravlev [ 2010 Sep 17 ] |
|
can't reproduce in newer versions of Zabbix Server (1.8.3) |
| Comment by Vitaly Zhuravlev [ 2010 Oct 02 ] |
|
Ok, now I can reproduce it in 1.8.3 and a lot... Please see last pic attached for details |
| Comment by Vitaly Zhuravlev [ 2010 Oct 02 ] |
|
Please see the timestamp... |
| Comment by Vitaly Zhuravlev [ 2010 Oct 02 ] |
|
richlv, answering to your question: item type is always the same, its agent.ping All hosts affected are located behind low-quality channels that's not stable, so I believe that it might be related to https://support.zabbix.com/browse/ZBX-3016 |
| Comment by Vitaly Zhuravlev [ 2010 Oct 14 ] |
|
Little extra: Date and Time on the server is perfectly normal, and there is no problem with the trigger where Internet connection is stable. |
| Comment by richlv [ 2010 Oct 25 ] |
|
looks like there's a problem event, which for some reason is not linked to the trigger, which is in the ok state itself. what's the trigger configuration, does it have any dependencies set up ? |
| Comment by richlv [ 2011 Aug 30 ] |
|
seems to be same root cause as |
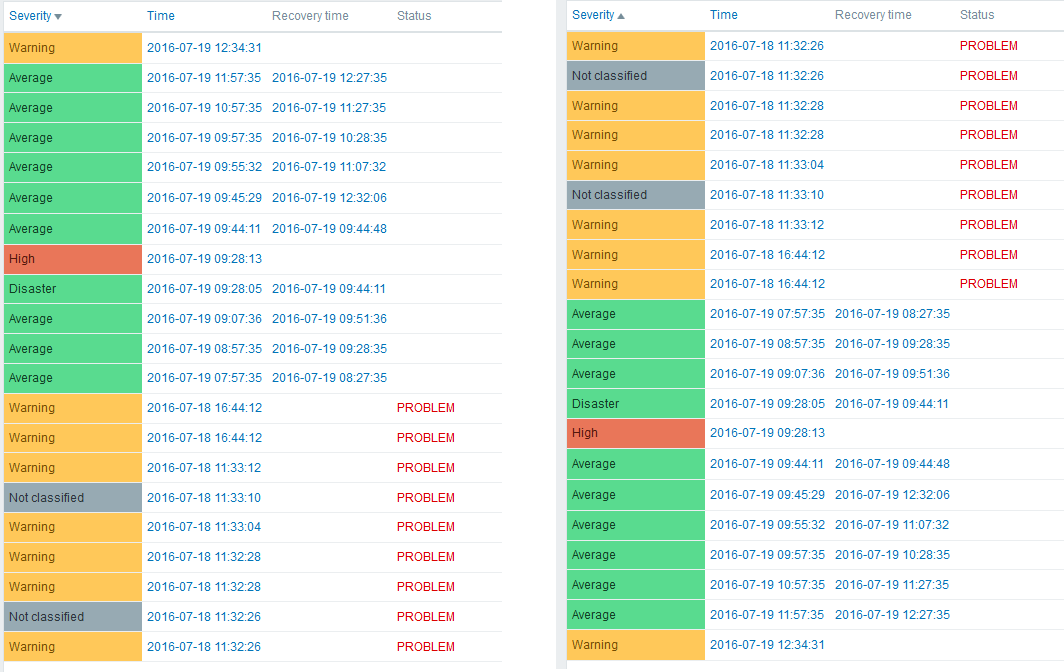
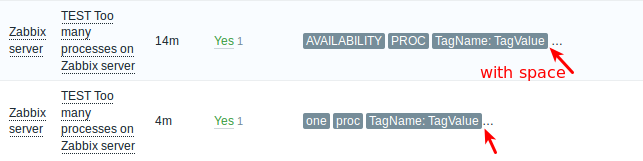
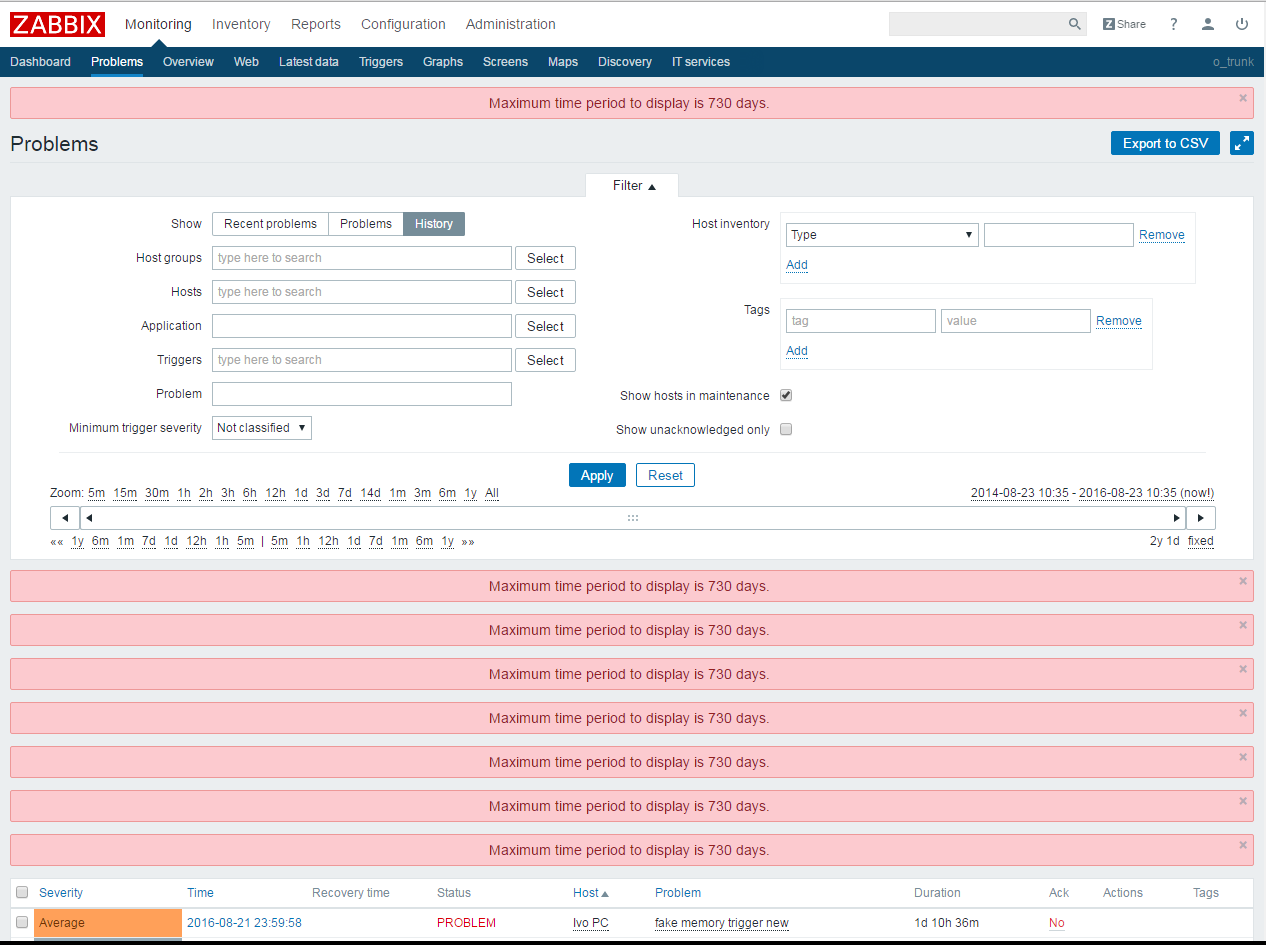
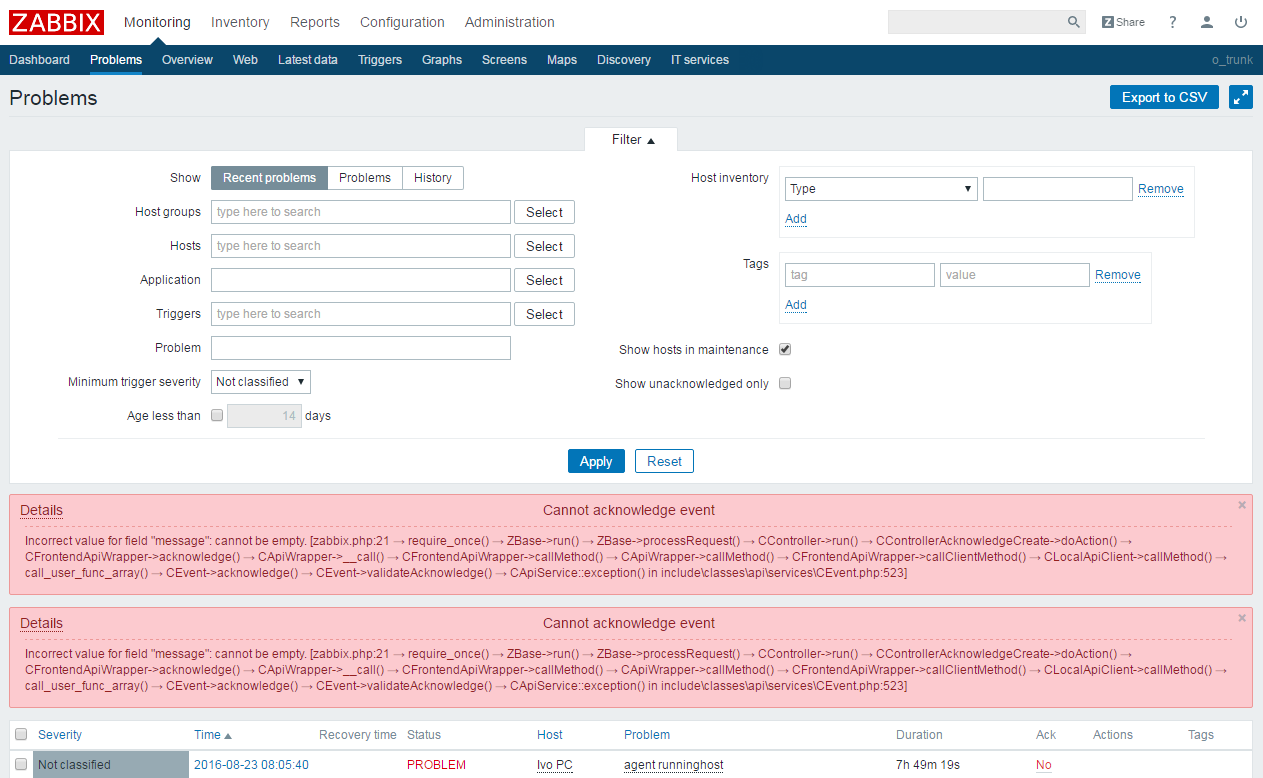
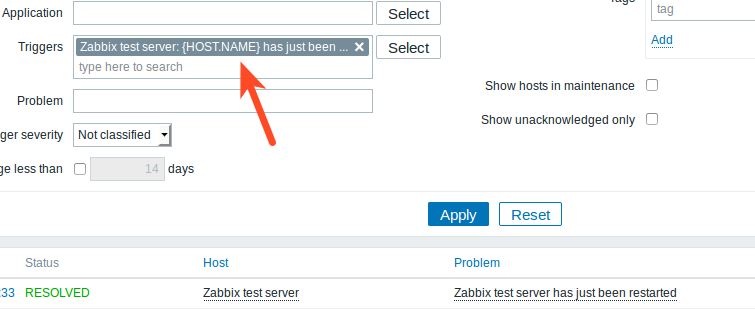
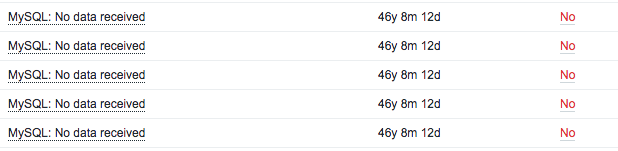

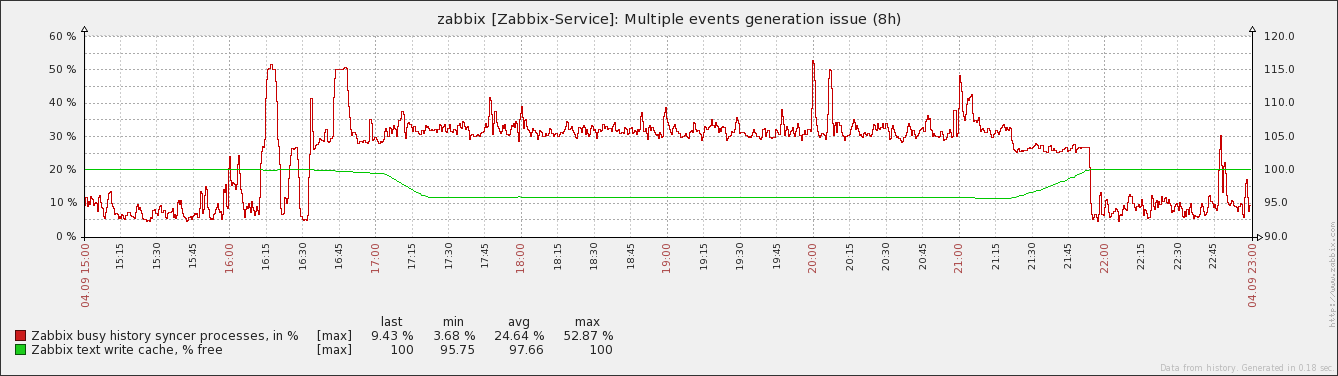
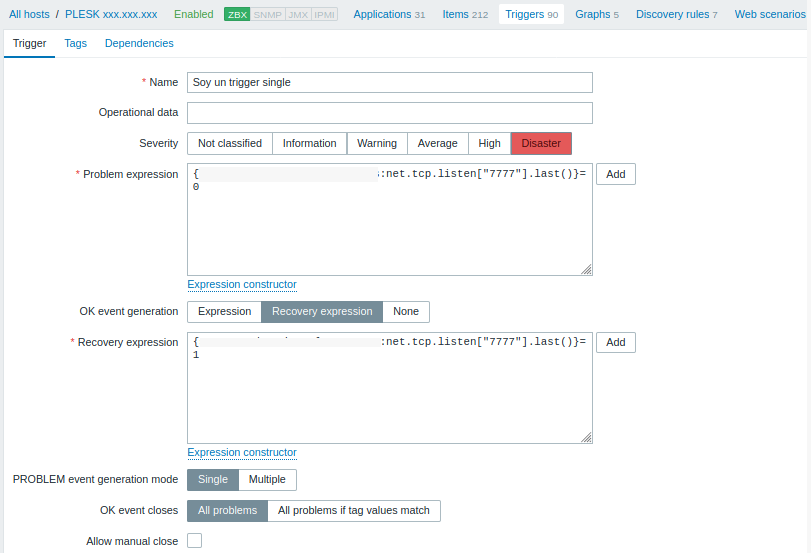
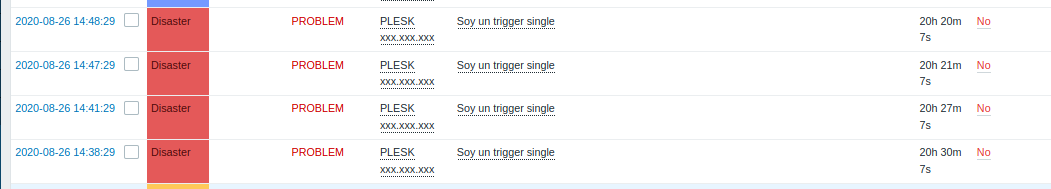
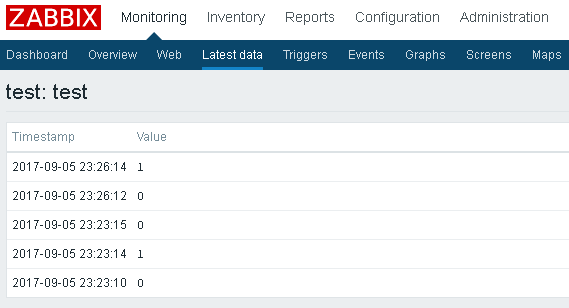
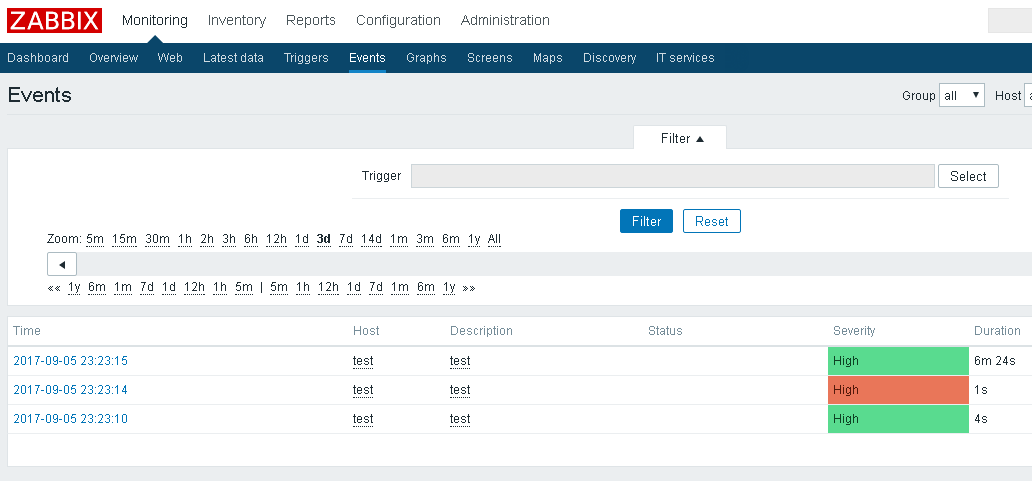
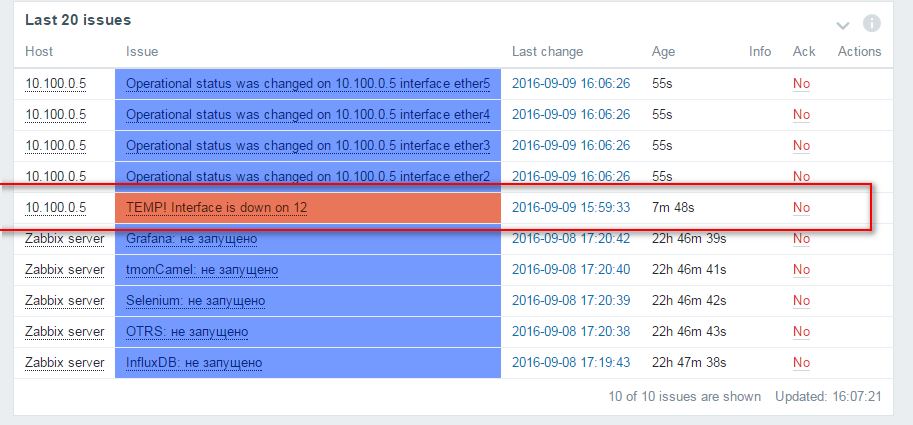

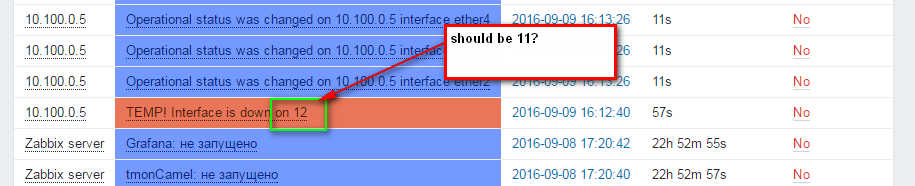


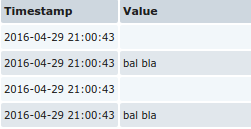
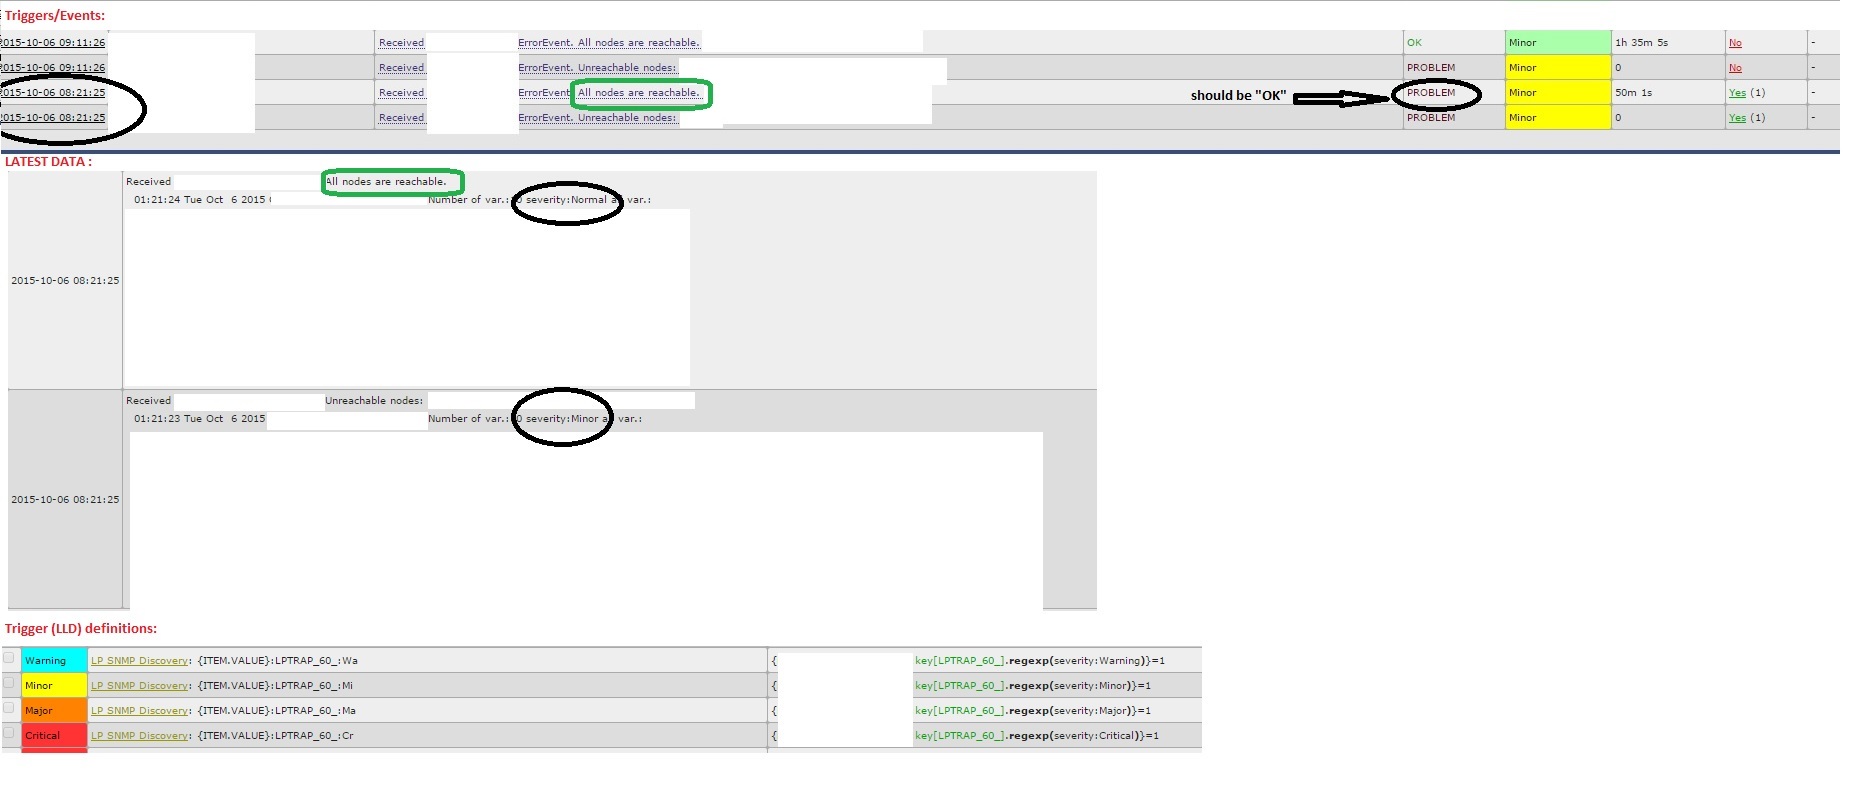

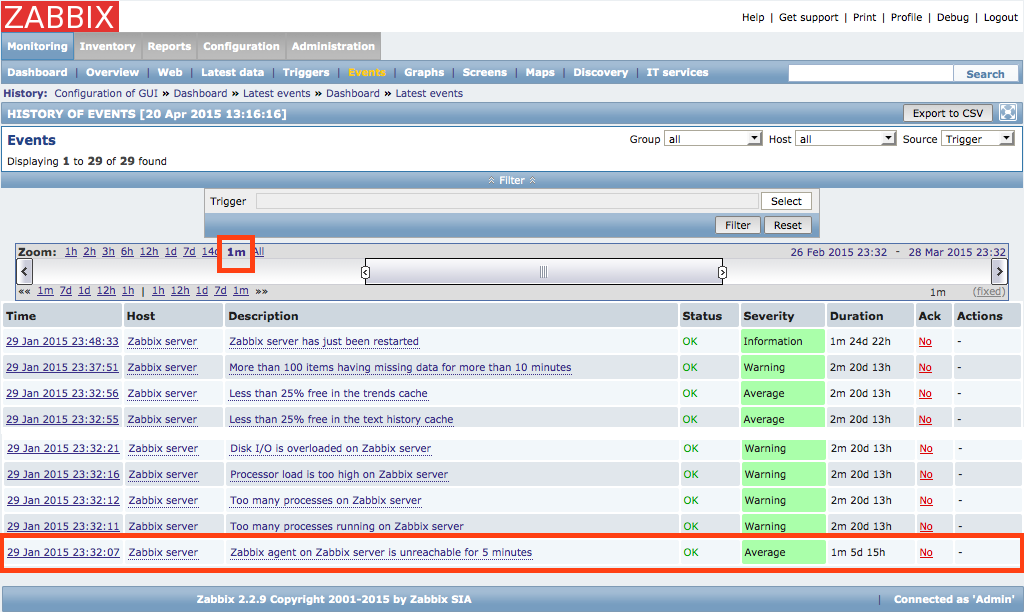
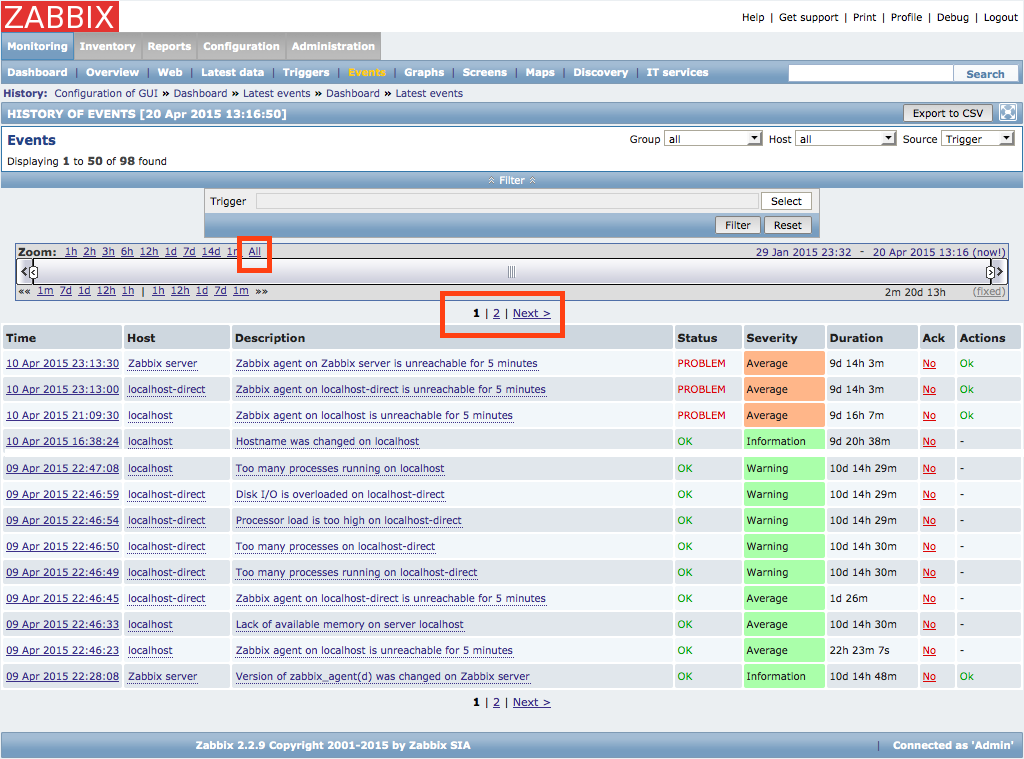
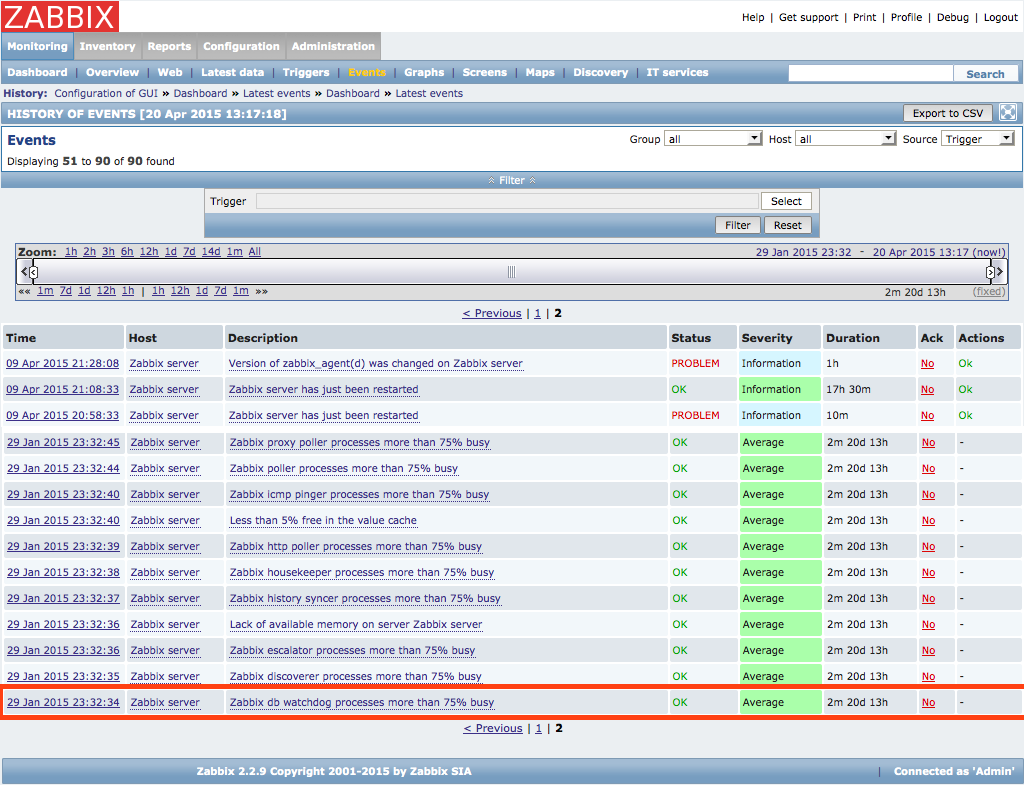
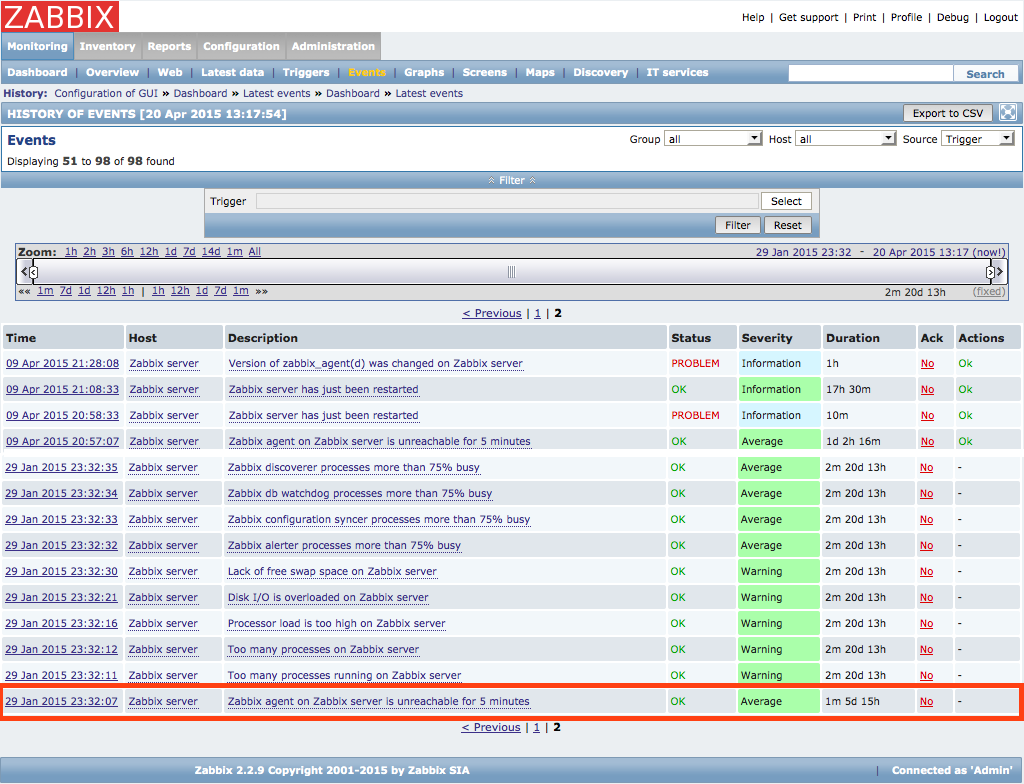

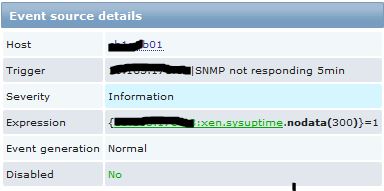
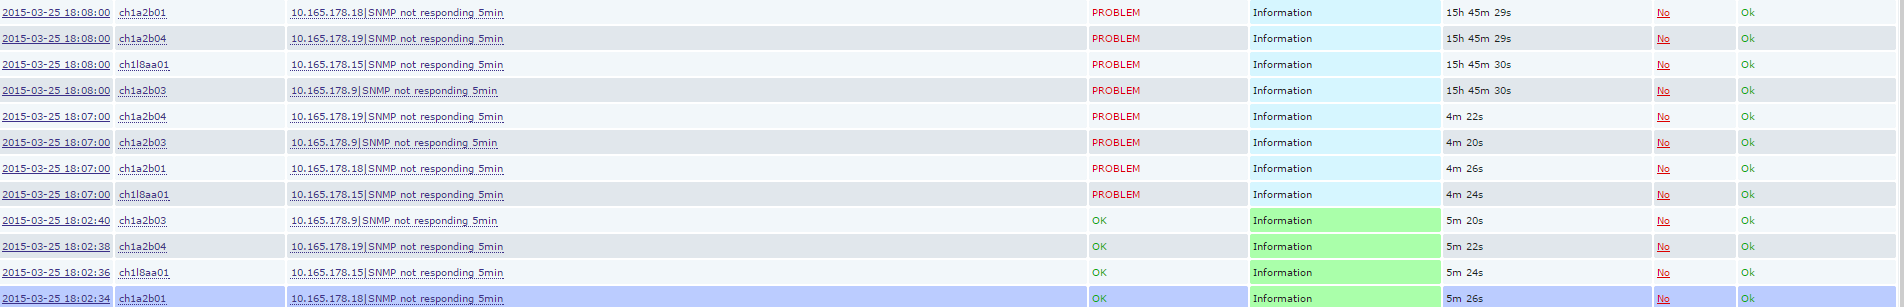
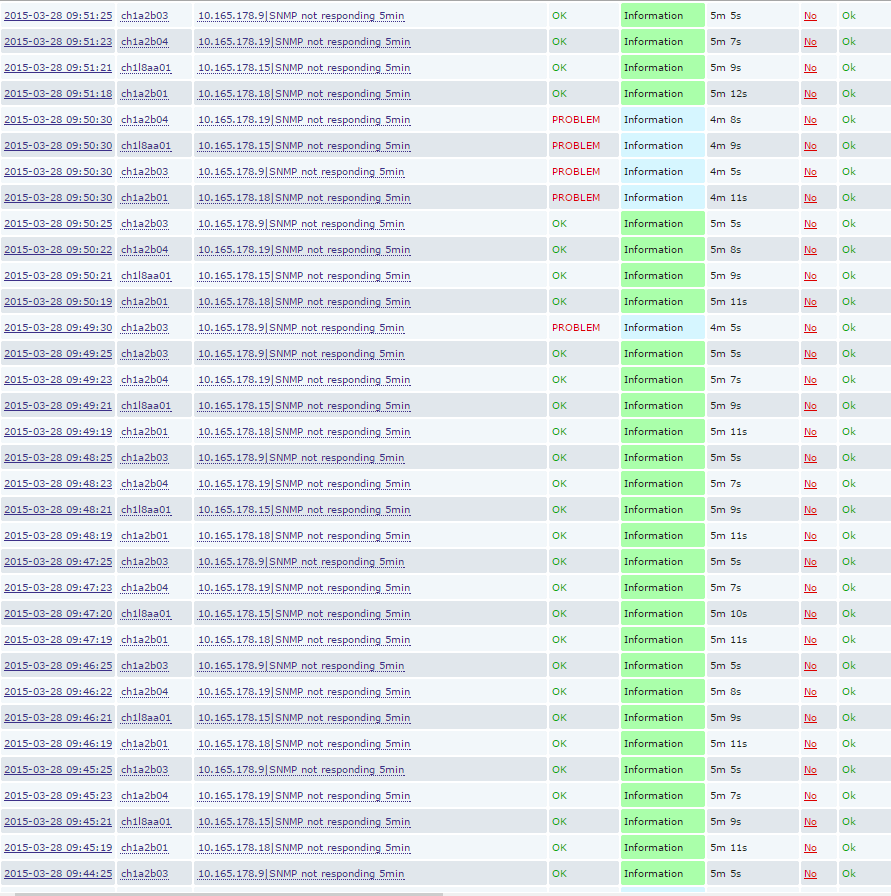
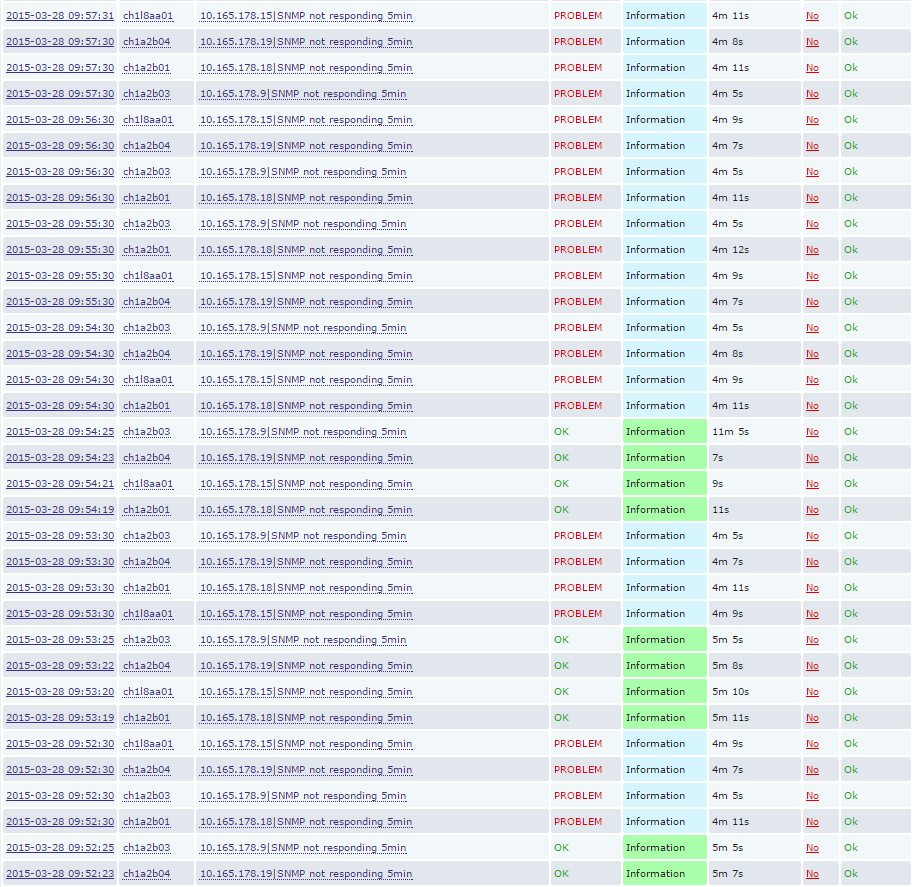
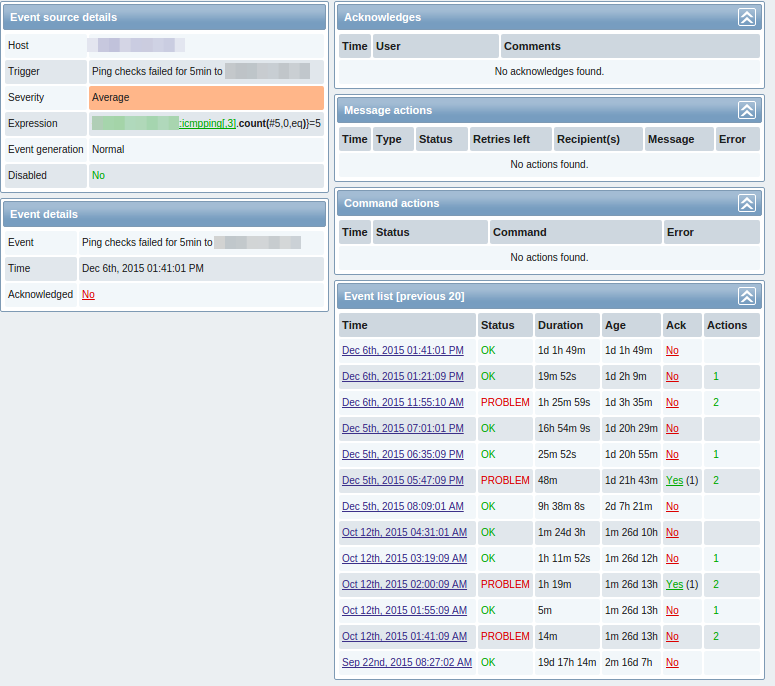
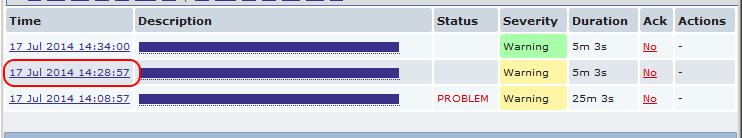
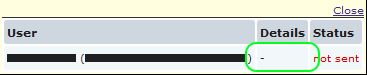
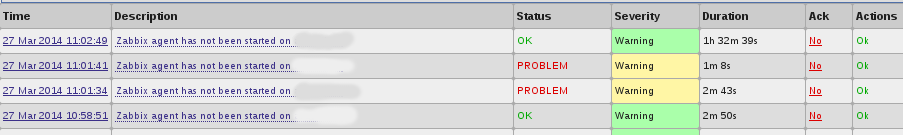
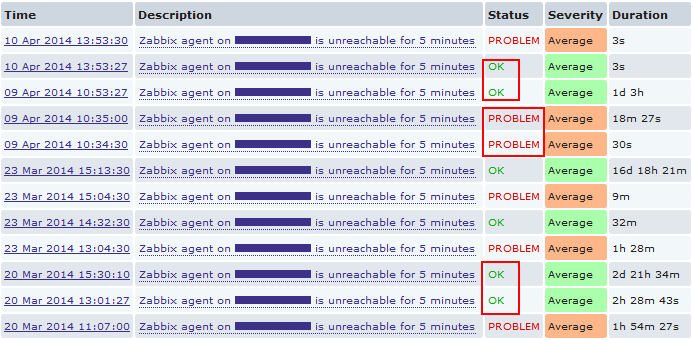
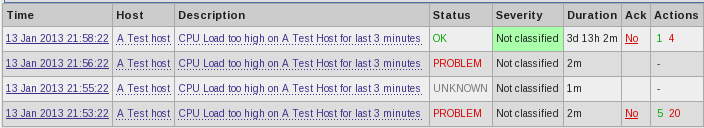
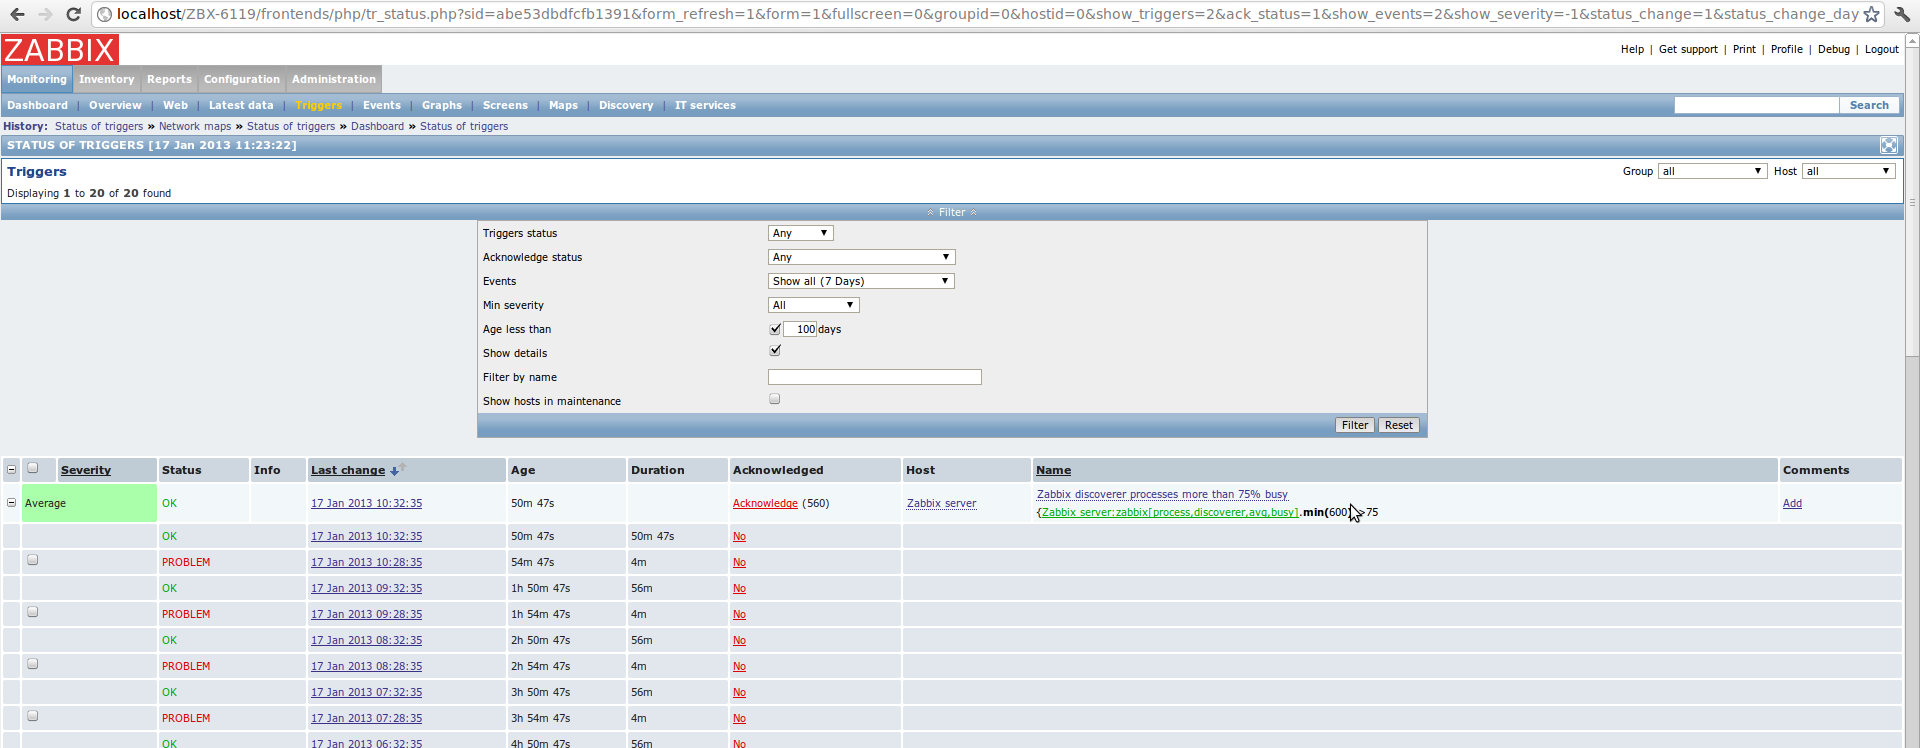
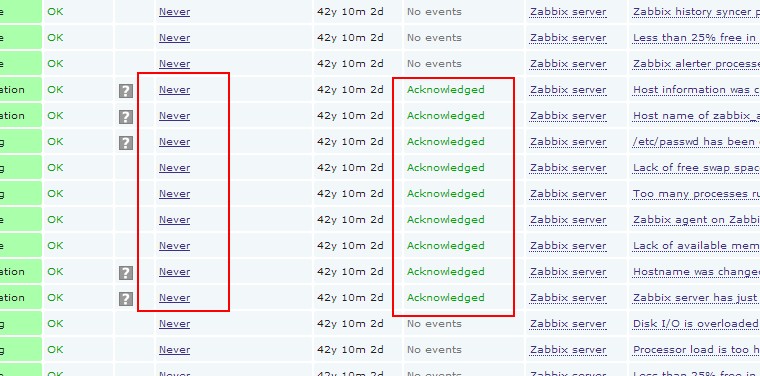