-
Type:
Incident report
-
Resolution: Won't fix
-
Priority:
 Minor
Minor
-
None
-
Affects Version/s: 2.2.11
-
Component/s: Frontend (F)
-
None
-
Environment:zabbix-web, MySQL
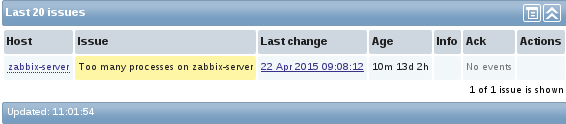
There was a problem several month ago and after some minutes/hours the problem was solved it and everything was fine. During the one of housekeeing processes the original event has been removed from the DB but I think a non graceful restart in MySQL/Server caused the related alarm appears on "Last 20 issues" table on the dashboard.
I had this problem in Zabbix 2.2.9 and after update to 2.2.11 nothing changed.