-
Type:
Incident report
-
Resolution: Won't fix
-
Priority:
 Trivial
-
None
-
Affects Version/s: 2.2.12
-
Component/s: Frontend (F)
-
None
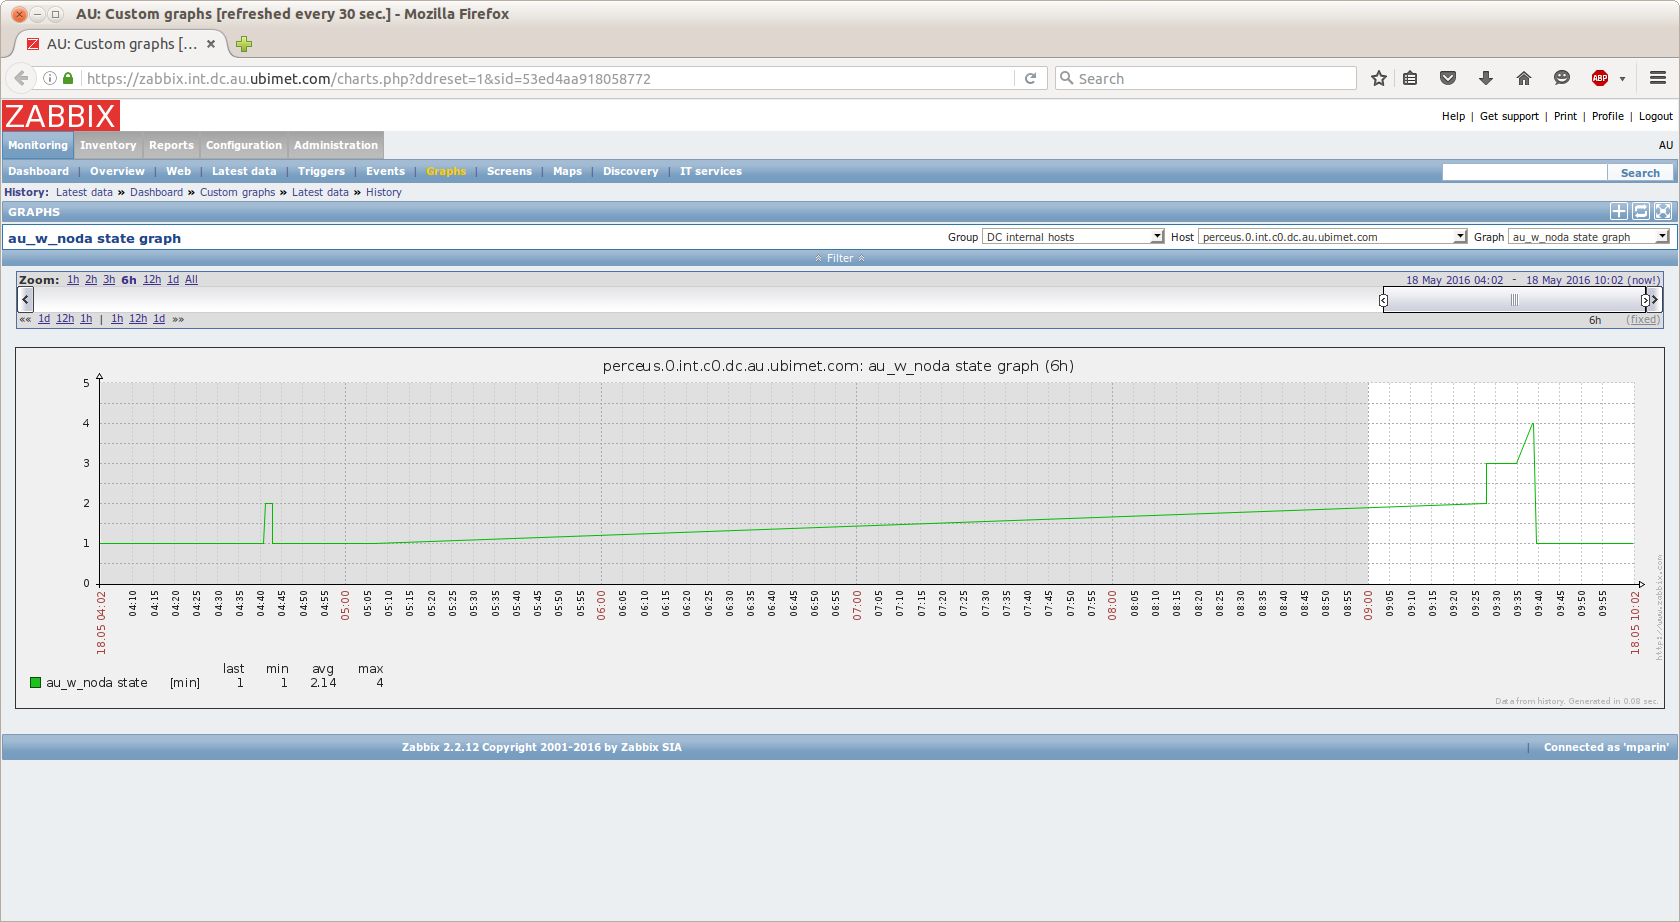
We are attempting to graph the state of a batch process with each number representing a different state. Here is the last 6 hours of data that are stored in the item that we are trying to graph:
2016.May.18 09:40:01 	1
2016.May.18 09:39:01	 4
2016.May.18 09:35:11	 4
2016.May.18 09:35:01	 3
2016.May.18 09:28:18	 3
2016.May.18 09:28:01	 2
2016.May.18 05:07:04	2
2016.May.18 05:07:01 	1
2016.May.18 04:43:18	1
2016.May.18 04:43:01	2
2016.May.18 04:41:44	2
2016.May.18 04:41:02	1
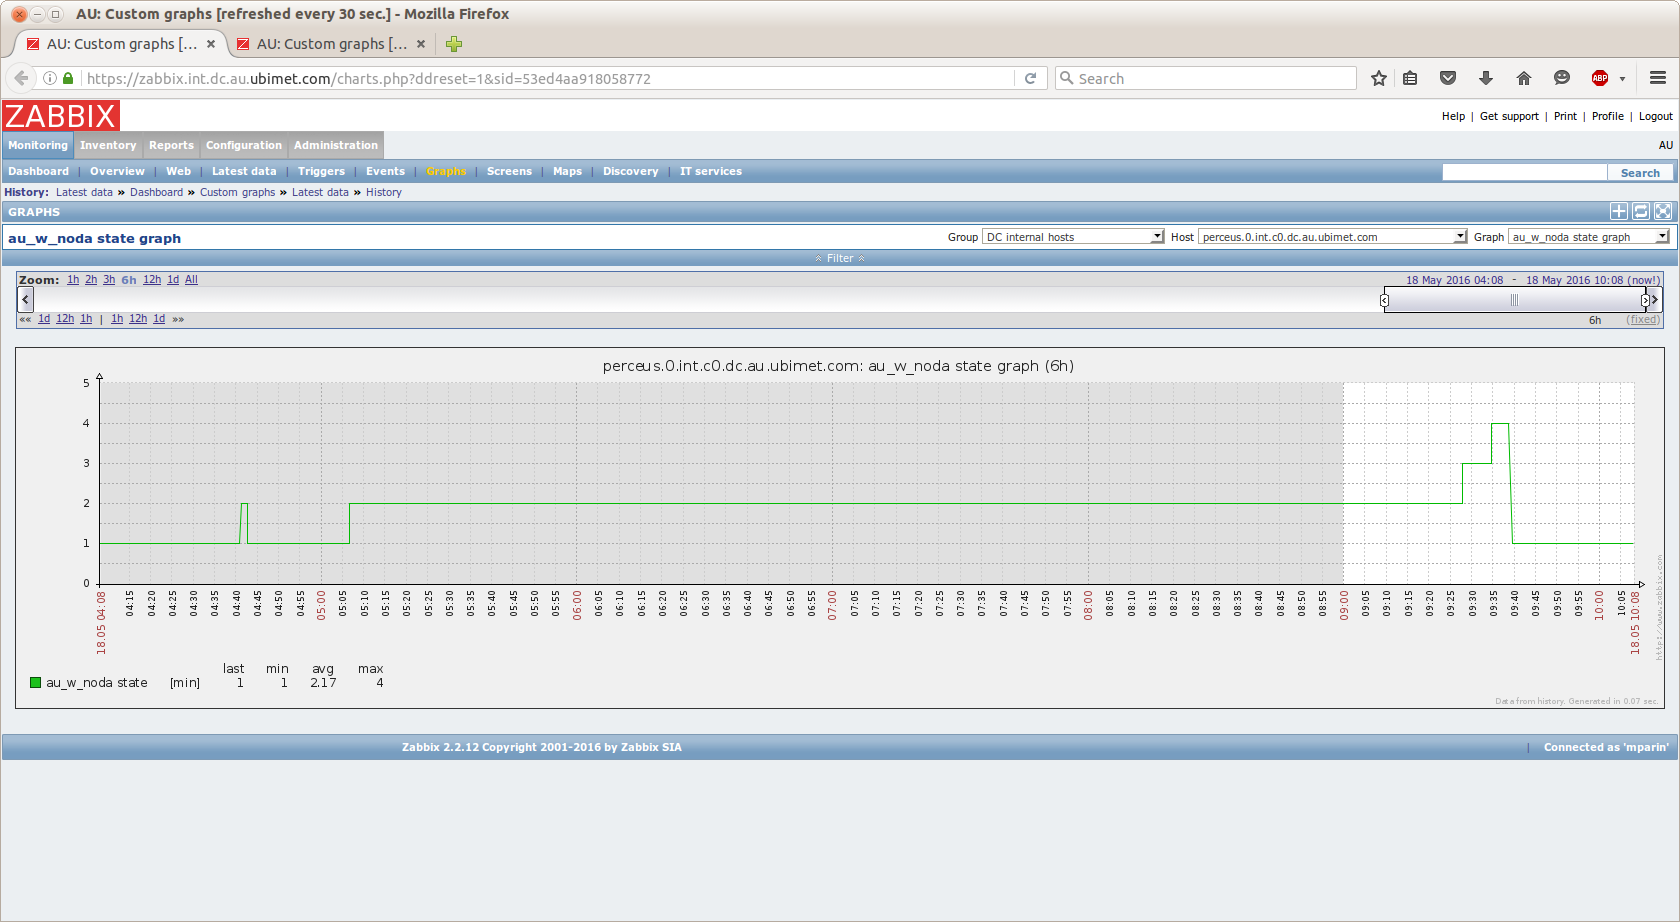
Essentially as the states are integers the graph should look like a series of steps. However, as you can see in the attached screenshot (graph.bad.png) that the value '2016.May.18 05:07:04 2' is ignored and we no longer have the expected and desired 'step graph'. Sometimes this is not the case, in fact a couple of minutes later the graph had automatically updated and displayed all the values in the expected way (see graph.good.png).
Could you please check this behaviour and fix if possible?