-
Type:
Incident report
-
Resolution: Unsupported version
-
Priority:
Minor
-
None
-
Affects Version/s: 2.2.13
-
Component/s: Frontend (F)
There is data of two years and three month. By default the maximum period for the time bar control is set to two years.
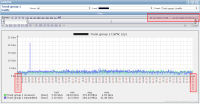
When selecting 'All' in the time period selector of Custom graphs, then the rendered image does not represent the selected period:
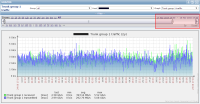
Moreover, when doing a manual page refresh, the selected time period changes - until the automatic refresh takes place:
Btw, making a time selection directly on the rendered image doesn't work neither. The period of the image does not match the selection.
After having increased ZBX_MAX_PERIOD from two years to e.g. five years, everything works as expected again.

