-
Type:
Incident report
-
Resolution: Fixed
-
Priority:
Trivial
-
None
-
Affects Version/s: 3.2.2
-
Component/s: Frontend (F)
-
None
-
4
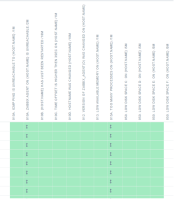
We always display data in Monitoring->Overview by set Trigger status as Any, to show all triggers status. In version < 3.0.1 of zabbix frontend, overview looks like 3.0.1.png.
We have multiple triggers with the same name but different severities, ex. Low disk space with Disaster, High, Average and Warning severity and different disks or paths. Zabbix frontend always grouped all triggers of the same name in one column in versions < 3.0.1.
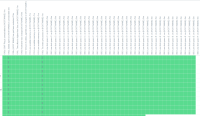
Unfortunately, in version higher than 3.0.1 of zabbix frontend the triggers with the same name but different severities and/or different checking items are not grouped. You can see on 3.2.2.png.
Could improve this functionality to the state in < 3.0.1 version or allow such a setting (checkbox or something else) in the newest versions of zabbix? It will be very helpful.

