-
Type:
Incident report
-
Resolution: Incomplete
-
Priority:
 Minor
Minor
-
None
-
Affects Version/s: 3.0.7
-
Component/s: Frontend (F)
-
Environment:Running Zabbix 3.0.7 on a 64 bit linux server, dedicated appliance. 16GB of ram, mysql, 16 core xeon, 2TB HDD (30% used)
Hello!
I've had this problem for a few versions but finally decided to escalate this issue to you. I first noticed it in version 2, but I don't recall which version (so more or less discard that association)
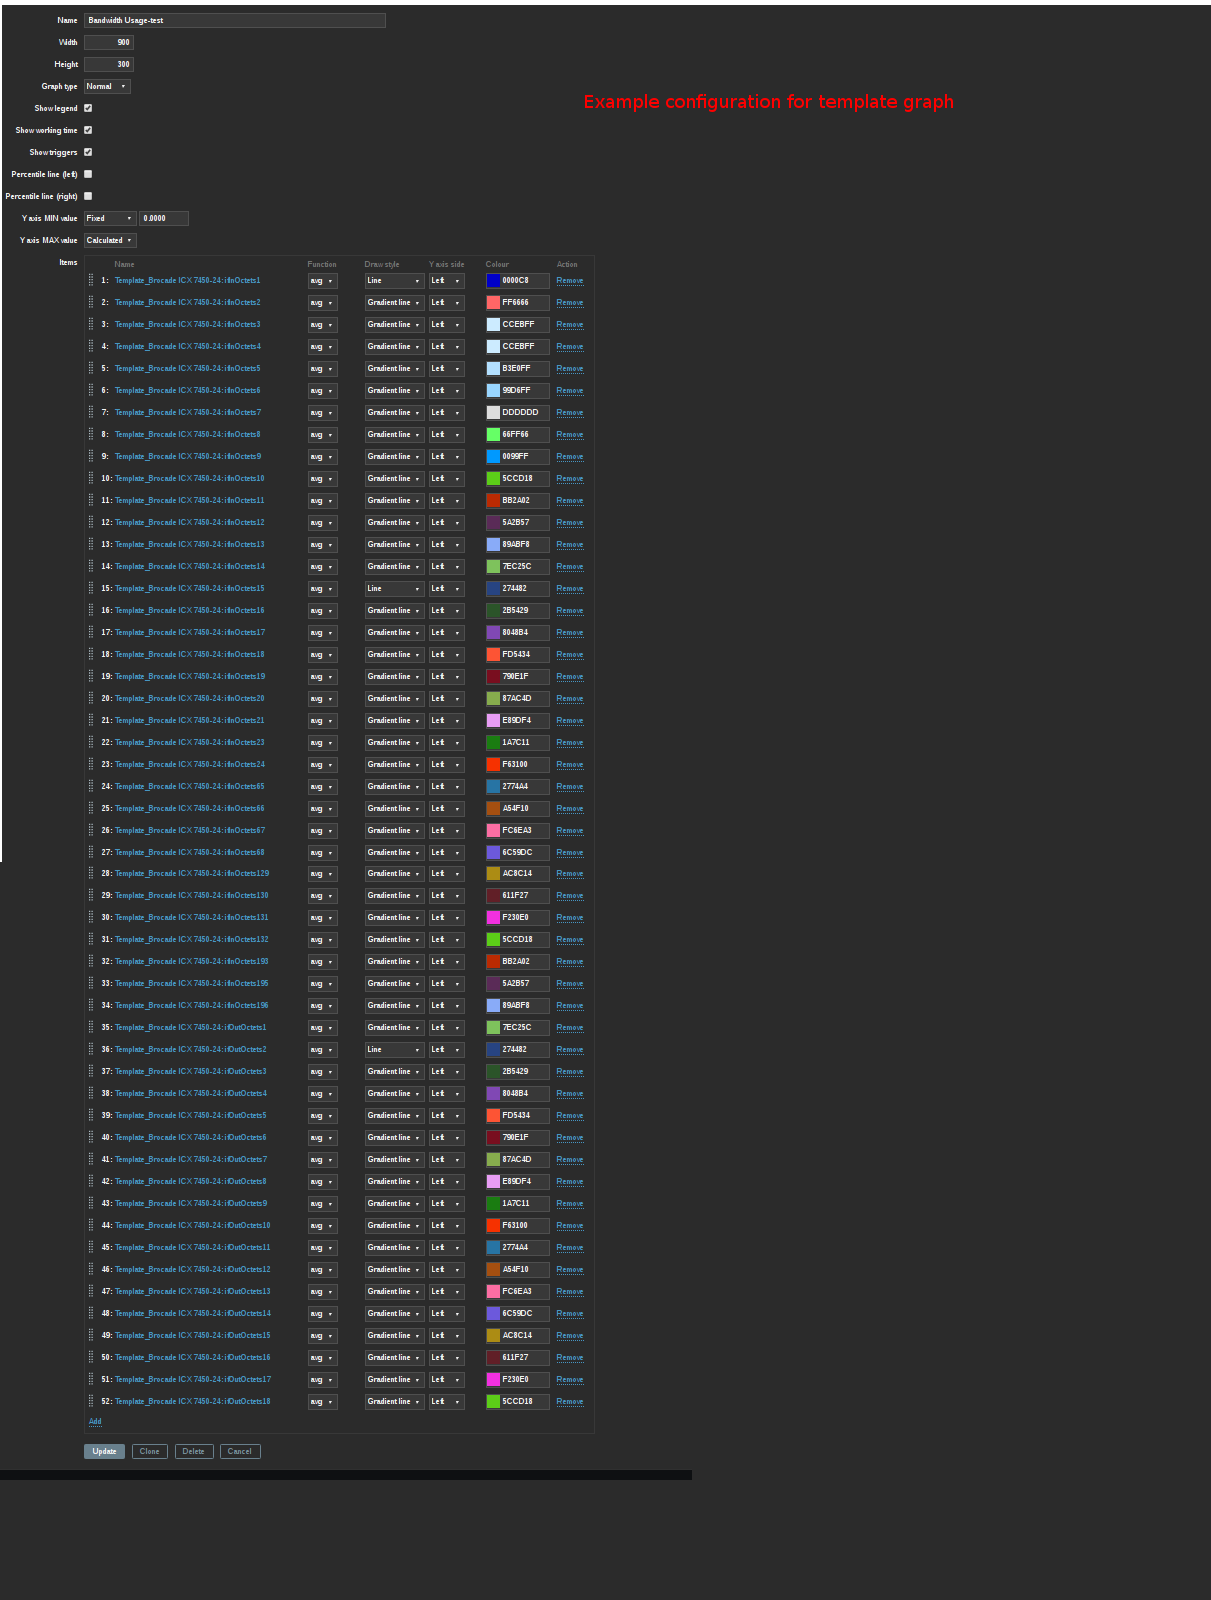
I started to create some more templates and I noticed that I cannot add more than 52 items to a "Normal" graph (I haven't tried adding it to any other graph types because it would just be impractical [such as stacked, pie, etc]).
Background:
What I'm trying to do is graph all of our network interfaces on some of our newer switches. We have never had any switches with more than 24 interfaces, therefore it hasn't been much of an issue until now (the only ones that we had previously we didn't use all of the interfaces so I removed some of the ports that were not in use on both switches from the graph as a work around). On other switches I just graphed individual interfaces (input and output statistics)
The switch that we have is modular (so the interface names aren't contiguous in nature; we have some 10G interfaces, and 1G interfaces, copper, fiber, etc).
Problem:
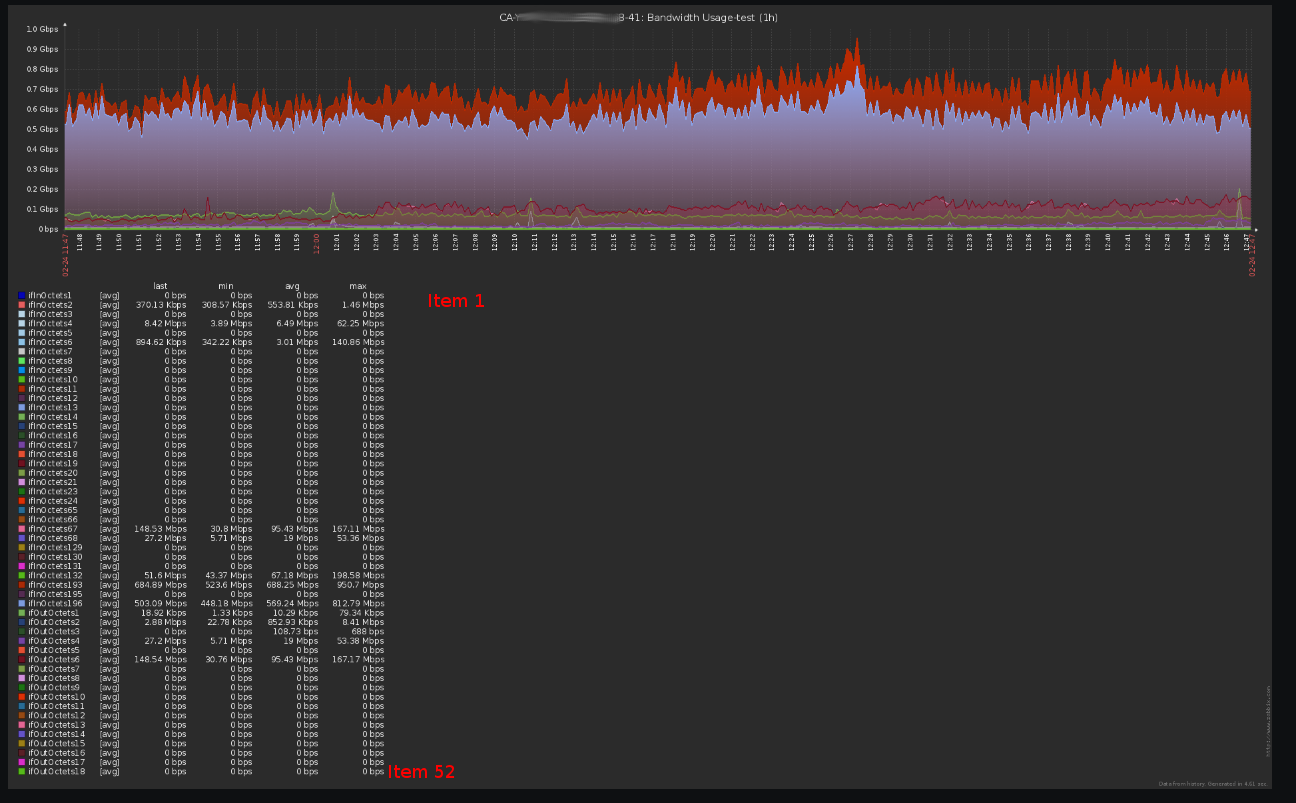
If you try to create a graph with any more than 52 items, the graph will fail to generate and will display a broken picture icon.
These items are all queried every 10 seconds therefore it might have to do with the number of datapoints that zabbix is trying to graph, but changing the time for the graph to generate (5m) or (1h) to (1d) doesn't seem to have any effect on the status.
The problem appears to be present irregardless of the "Draw Style" (Gradient, Line) and the "Function" (All, last, Average). I have verified that all of the options are valid items that can be drawn in other graphs that I created for this template. The hosts have each of the items that are graphing (therefore the items are not in any other state except ENABLED)
See attached documents for further information.
It breaks with 70 items, 60 items, and then 59,58,57,56,55,54,53, and then starts generating at 52 items.