-
Type:
Incident report
-
Resolution: Fixed
-
Priority:
 Major
Major
-
Affects Version/s: 2.2.17, 3.0.8
-
Component/s: Frontend (F)
-
None
-
Sprint 4, Sprint 5, Sprint 6, Sprint 7
-
0.5
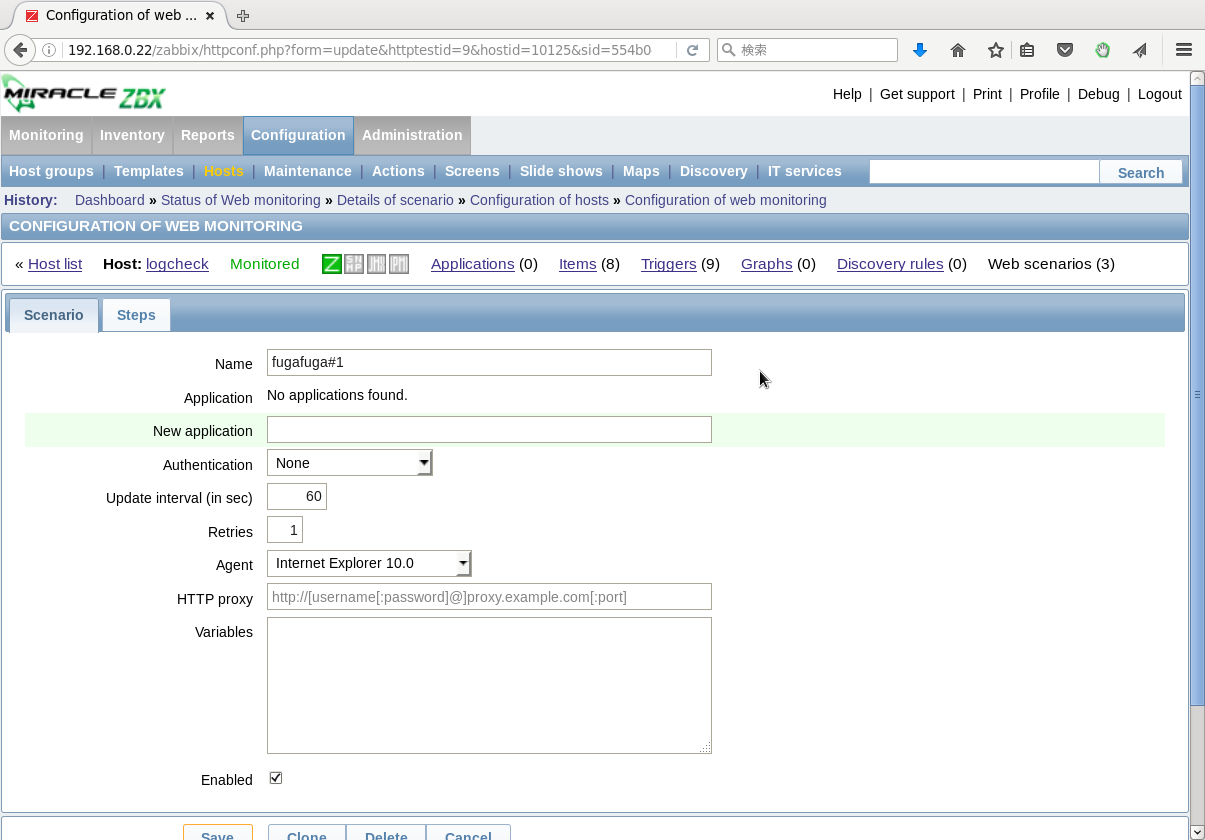
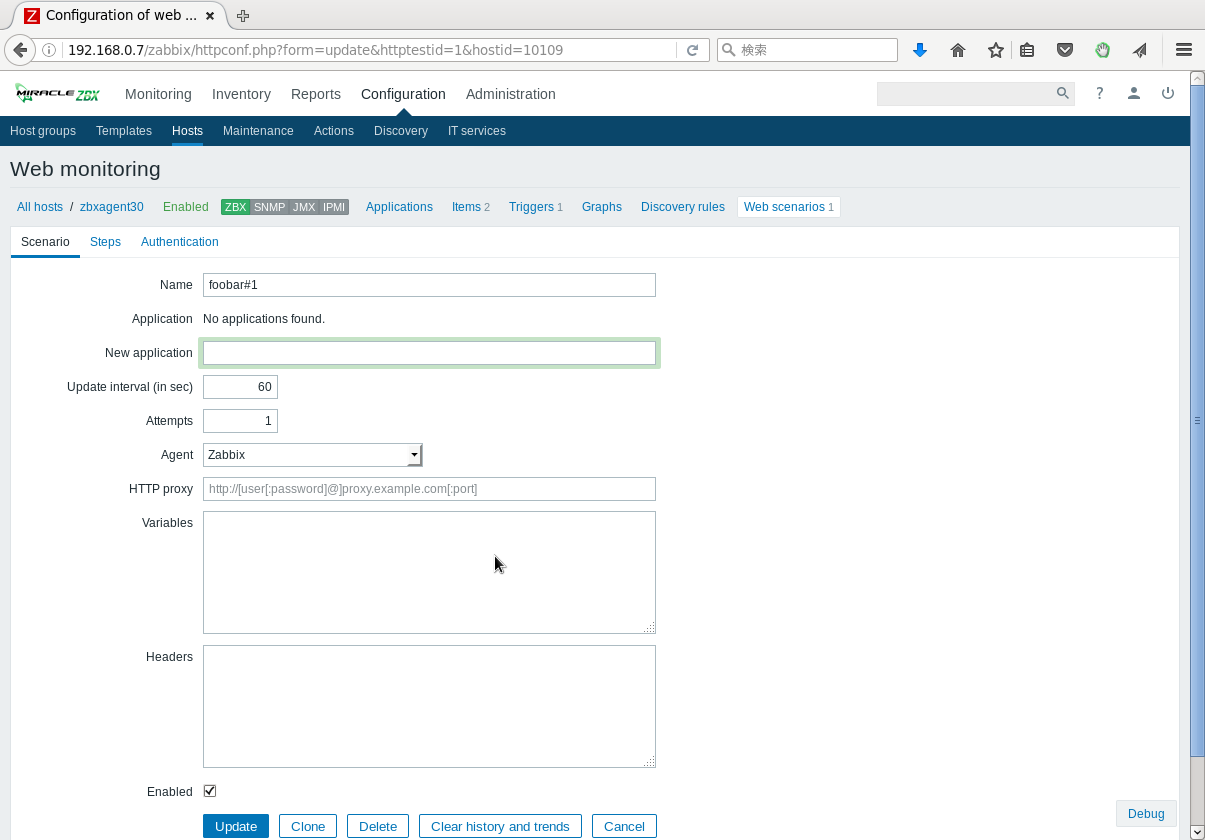
If # character is set to the name of web monitoring scenario , the image of graph of the scenario shows error message.
How to reproduce :
1. Open the following location on Zabbix Web interface .
Configuration -> Hosts -> Web -> Scenarios -> Create or Configuration of web monitoring.
2. Set the name including # for the Scenario .
Name: foobar#1
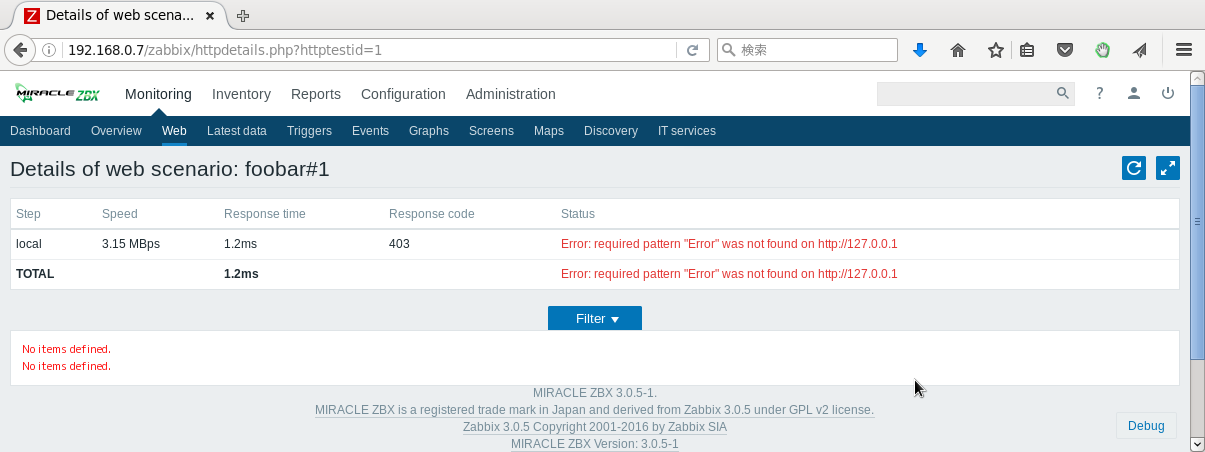
3. Open the following location. And confirm the error message on both Speed and Response time area.
Monitoring -> Web -> Details of the scenario set above.
See also attached image.
We confirmed this problem on version 2.2.16 and 3.0.5 .
If # is set to the name ,it translated wrongly in the URL to show the graph in httpdetails.php.
As a result the error messages are appeared on the these area for graphs.
We fixed this problem using urlencoding().
Please see the attached patch.