-
Type:
Incident report
-
Resolution: Won't fix
-
Priority:
 Major
Major
-
None
-
Affects Version/s: 3.0.8
-
Component/s: Frontend (F)
-
None
-
Environment:RHEL 6, ZABBIX Version 2.2.9 and 3.0.7
We observed that the latest data graph shows different value when we change the time scale in case of no data.
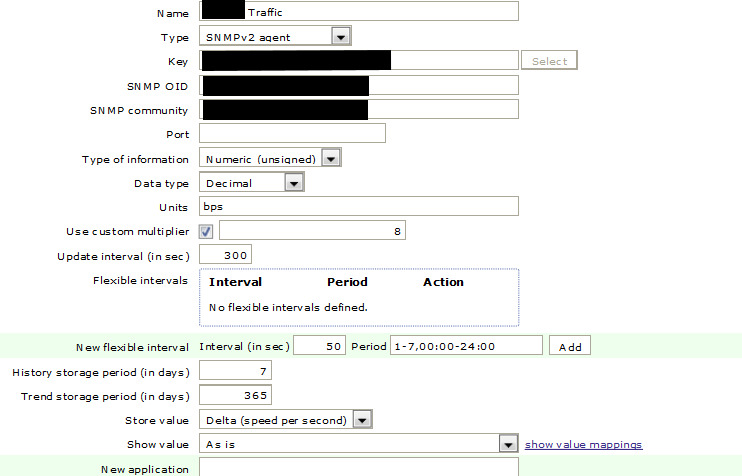
We are monitoring interface traffic using SNMP.
The configuration of the LLD item prototype is as below :

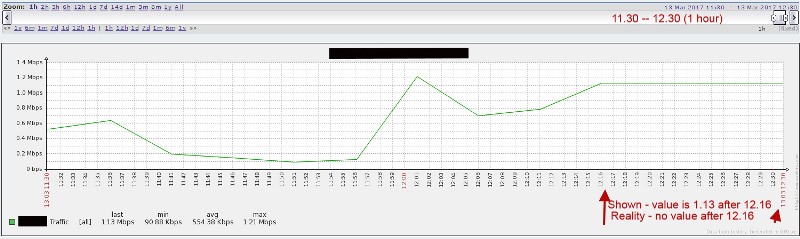
Host unreachable after 12.16 on particular day.
We checked the network interface graph available from latest data.
Case 1: Latest data Graph for time between 11.30 - 12.30 .
As per graph, the network traffic was available between 12.16 - 12.30.

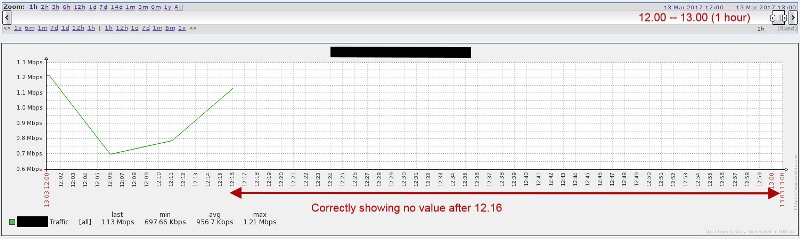
Case 2:Latest data Graph for time between 12.00 - 13.00.
As per graph, the network traffic was NOT available after 12.16.
I posted it on Zabbix forums as well, and it looks to be a fresh case perhaps.