-
Type:
Incident report
-
Resolution: Won't fix
-
Priority:
Trivial
-
None
-
Affects Version/s: 3.2.3
-
Component/s: Proxy (P)
-
None
Hello!
I'm Zabbix 3.2.3 on remote Oracle DB and 8 active proxies.
NVPS about 8000
All proxy have the same configuration :
DataSenderFrequency = 30
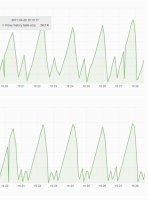
For each proxy I create metric to check History table size every 10 sec.
This table show me saw like graphs: two peak were small with 25 sec interval and one was high with 50 sec interval. And graph was the same for each proxy.
Because of this delay 50 sec, I every minute get queue for all proxy.
For test purposes, I change DataSenderFrequency = 15 for one proxy and I get small peak with 15 sec and high peak with 50 sec interval. So, high peak is the same.
May be somebody know, why this high peak happen? Why peak interval is not the same? Why every third peak higher than other?

