-
Type:
Incident report
-
Resolution: Commercial support required
-
Priority:
 Major
Major
-
None
-
Affects Version/s: 3.4.4
-
Component/s: Server (S)
-
None
Hello,
I am facing an issue with Zabbix performance.
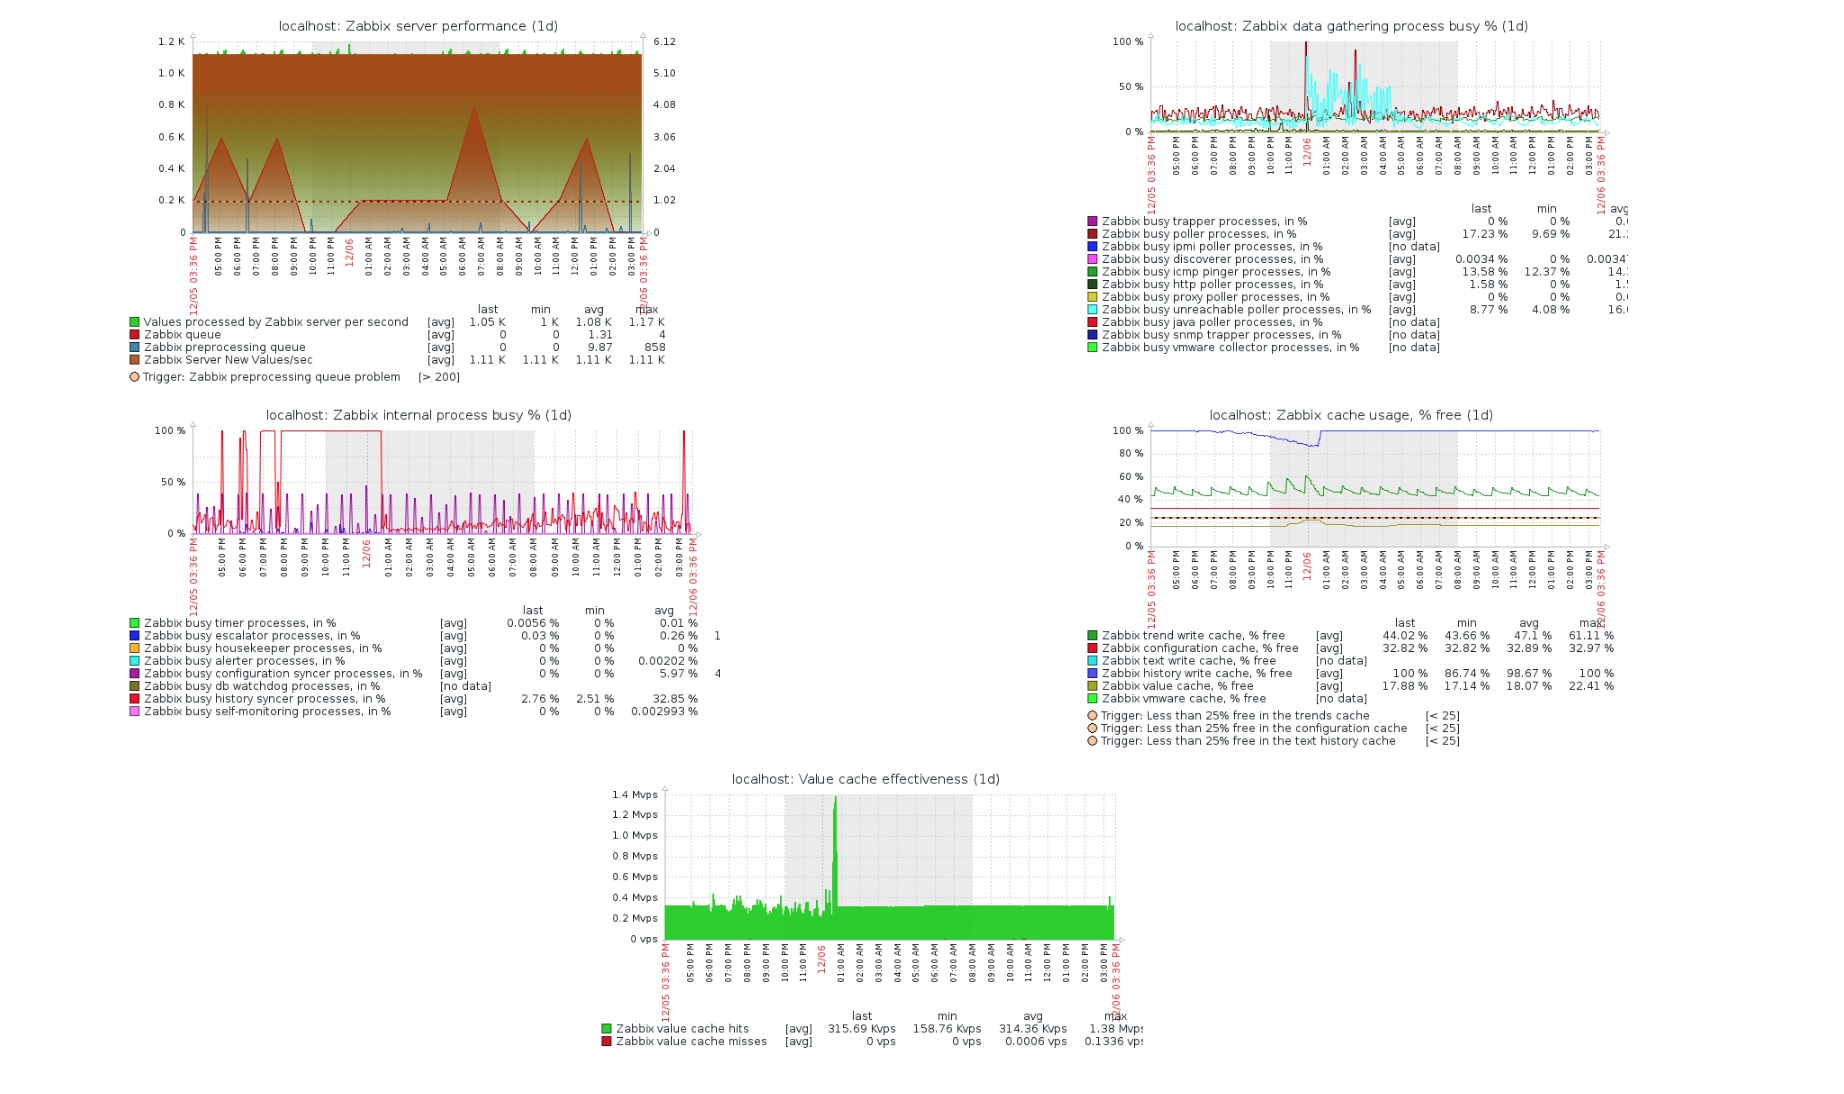
Every day starting from 19:00-20:00 Zabbix history syncer process is getting 100% utilized.
During that time any data that is being gathered by Zabbix server is getting inserted into database with 20-30 minutes of delay. This behaviour ends at 00:00 or 01:00 at night.
I have inspected full Zabbix database query log and what I see is that queries like this appear right before history syncer gets 100% utilized:
Query_ID: 34
Duration: 0.92566761
   Query: SELECT itemid,round(1458* MOD(CAST(clock AS UNSIGNED)+18619,86400)/(86400),0) AS i,COUNT(*) AS count,AVG(value) AS avg,MIN(value) AS min,MAX(value) AS max,MAX(clock) AS clock FROM history_uint WHERE itemid='3278495''1512240581'  AND clock<='1512326981' GROUP BY itemid,i
So this is only one query that lasts almost 1 sec. But there are many similar queries. It seems like trends calculation.
Then i try to 'order by null' :
Query_ID: 35
Duration: 0.05456667
   Query: SELECT itemid,round(1458* MOD(CAST(clock AS UNSIGNED)+18619,86400)/(86400),0) AS i,COUNT(*) AS count,AVG(value) AS avg,MIN(value) AS min,MAX(value) AS max,MAX(clock) AS clock FROM history_uint WHERE itemid='3278483''1512240581'  AND clock<='1512326981' GROUP BY itemid,i order by null
As we can see, query time decreased almost 17 times.
I have no zabbix preprocessing queue, zabbix queue overload during that time. I have neither cache overload and all my poller processes are 20-25% busy. Only Value Cache hits fluctuates from 150 Kvps to 300 Kvps.
Is it a bug that such a query is too long? Can you optimize it? May it be the reason of performance problem?