-
Type:
Incident report
-
Resolution: Won't fix
-
Priority:
Critical
-
None
-
Affects Version/s: 3.2.10
-
Component/s: Server (S)
-
None
-
Environment:# My configuration is:
- Zabbix Server version: 3.2.10
- Zabbix Server host: Virtual Machine running CentOS 7.3.1611 64 bits, 4 vCPs, 16 GB RAM
- Data Base: mysql Ver 15.1 Distrib 10.1.18-MariaDB, for Linux (x86_64) using readline 5.1. At the moment I´m with just one node.
- Data Base host: Physical Host running CentOS 7.4.1708 (Core), 32 CPUs, 87 GB RAM
- Several proxies version 3.2.10, on VMs CentOS 7.4.
- Partition tables enable on history and trend tables.
# Zabbix Serve Configuration (main parameters changed):
StartTrappers=100
MaxHousekeeperDelete=100000
CacheSize=1536M
CacheUpdateFrequency=300
StartDBSyncers=8 (should I increase it?)
HistoryCacheSize=512M (during the problem, it goes to zero)
TrendCacheSize=256M
ValueCacheSize=1G
Timeout=4
LogSlowQueries=10000
# MariaDB Configuration:
open_files_limit = 16364
max_connections = 500
binlog_format=ROW
default_storage_engine=InnoDB
innodb_autoinc_lock_mode=2
innodb_flush_log_at_trx_commit=0
innodb_additional_mem_pool_size = 16M
innodb_autoextend_increment = 256
innodb_buffer_pool_instances = 32
innodb_buffer_pool_size = 32G
innodb_change_buffer_max_size = 50
innodb_concurrency_tickets = 5000
innodb_file_per_table = 1
innodb_flush_method = O_DIRECT
innodb_log_file_size = 512M
innodb_log_files_in_group = 4
innodb_old_blocks_time = 1000
innodb_open_files = 2048
innodb_stats_on_metadata = OFF
innodb_lock_wait_timeout = 50
innodb_io_capacity = 2000
large-pages
binlog-row-event-max-size = 8192
character_set_server = utf8
collation_server = utf8_bin
expire_logs_days = 1
join_buffer_size = 262144
max_allowed_packet = 32M
max_connect_errors = 10000
max_heap_table_size = 134217728
query_cache_type = 0
query_cache_size = 0
slow-query-log = ON
table_open_cache = 2048
thread_cache_size = 64
tmp_table_size = 134217728
wait_timeout = 86400# My configuration is: - Zabbix Server version: 3.2.10 - Zabbix Server host: Virtual Machine running CentOS 7.3.1611 64 bits, 4 vCPs, 16 GB RAM - Data Base: mysql Ver 15.1 Distrib 10.1.18-MariaDB, for Linux (x86_64) using readline 5.1. At the moment I´m with just one node. - Data Base host: Physical Host running CentOS 7.4.1708 (Core), 32 CPUs, 87 GB RAM - Several proxies version 3.2.10, on VMs CentOS 7.4. - Partition tables enable on history and trend tables. # Zabbix Serve Configuration (main parameters changed): StartTrappers=100 MaxHousekeeperDelete=100000 CacheSize=1536M CacheUpdateFrequency=300 StartDBSyncers=8 (should I increase it?) HistoryCacheSize=512M (during the problem, it goes to zero) TrendCacheSize=256M ValueCacheSize=1G Timeout=4 LogSlowQueries=10000 # MariaDB Configuration: open_files_limit = 16364 max_connections = 500 binlog_format=ROW default_storage_engine=InnoDB innodb_autoinc_lock_mode=2 innodb_flush_log_at_trx_commit=0 innodb_additional_mem_pool_size = 16M innodb_autoextend_increment = 256 innodb_buffer_pool_instances = 32 innodb_buffer_pool_size = 32G innodb_change_buffer_max_size = 50 innodb_concurrency_tickets = 5000 innodb_file_per_table = 1 innodb_flush_method = O_DIRECT innodb_log_file_size = 512M innodb_log_files_in_group = 4 innodb_old_blocks_time = 1000 innodb_open_files = 2048 innodb_stats_on_metadata = OFF innodb_lock_wait_timeout = 50 innodb_io_capacity = 2000 large-pages binlog-row-event-max-size = 8192 character_set_server = utf8 collation_server = utf8_bin expire_logs_days = 1 join_buffer_size = 262144 max_allowed_packet = 32M max_connect_errors = 10000 max_heap_table_size = 134217728 query_cache_type = 0 query_cache_size = 0 slow-query-log = ON table_open_cache = 2048 thread_cache_size = 64 tmp_table_size = 134217728 wait_timeout = 86400
I´m having huge problems with my Zabbix Server.
Almost every night I can see many queries like this:
select clock,ns,value from history where itemid=685444 and clock>1504224274 and clock<=1511385830;
select clock,ns,value from history_uint where itemid=39587285 and clock>1511107366 and clock<=1512524342;
select clock,ns,value from history_uint where itemid=31866406 and clock>1511107366 and clock<=1512524685;
select clock,ns,value from history_uint where itemid=39584648 and clock>1511107366 and clock<=1512524326;
select clock,ns,value from history_uint where itemid=41505528 and clock>1511107366 and clock<=1512523898;
What is strange is the fact that the start date in the query is a old date and always are the same:
1504224274 = GM time : 2017-09-01 00:04:34
1511107366 = GM time : 2017-11-19 16:02:46
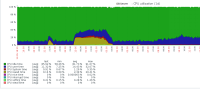
These queries takes about 15 seconds to finish, each one, what makes the DB server stays very slow and Zabbix Server stops processing data.
Any one has a idea what is causing this behavior on the Zabbix Server?
May it be a problem with my "Value Cache Size" that is set to 1 GB today?
Why always the same old start date on the queries?
The items aren´t from the same key and are from different hosts, I mean, there is no pattern, except the start date.
Thanks.


