-
Type:
Problem report
-
Resolution: Fixed
-
Priority:
 Trivial
-
Affects Version/s: 3.2.9, 3.2.10
-
Component/s: Frontend (F)
-
Sprint 25, Sprint 26, Sprint 27, Sprint 28, Sprint 29, Sprint 30, Sprint 31, Sprint 32, Sprint 33, Sprint 34, Sprint 35, Sprint 36, Sprint 37, Sprint 38
-
1
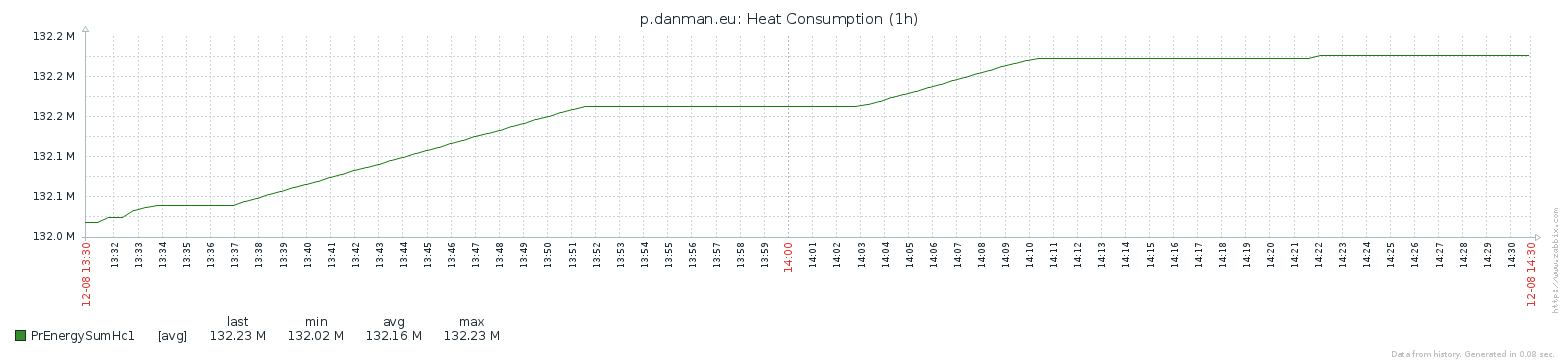
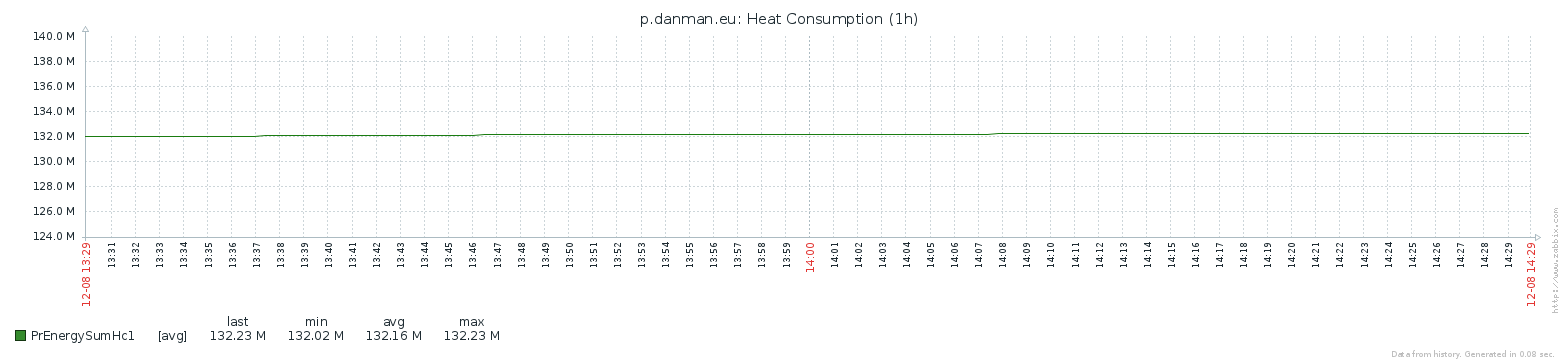
Calculated Y max and min makes the graph useless.
Steps to reproduce:
Monitor an item which has huge value (tens of millions) and raises slowly (in hundreds) and use graph with automatically calculated Ymin and Ymax
Result:
See screenshot chart2-wrong.png
Expected:
See screenshot chart2-ok.png
My fix:
diff --git a/include/classes/graphdraw/CLineGraphDraw.php.orig b/include/classes/graphdraw/CLineGraphDraw.php
index 2abf7c9..cb0ac20 100644
--- a/include/classes/graphdraw/CLineGraphDraw.php.orig
+++ b/include/classes/graphdraw/CLineGraphDraw.php
@@ -2532,7 +2532,7 @@ class CLineGraphDraw extends CGraphDraw {
                                        $absMinY = $oldAbMaxY;
                                }

-                               if (bcdiv((bcsub($absMaxY, $absMinY)), $absMaxY) <= 0.1) {
+                               if (bcdiv((bcsub($absMaxY, $absMinY)), $absMaxY) <= 0) {
                                        if ($this->m_minY[$graphSide] > 0) {
                                                $this->m_minY[$graphSide] = bcmul($this->m_minY[$graphSide], 0.95);
                                        }
Can you rethink this logic somehow?