We had two zabbix crashes in last 7 days.
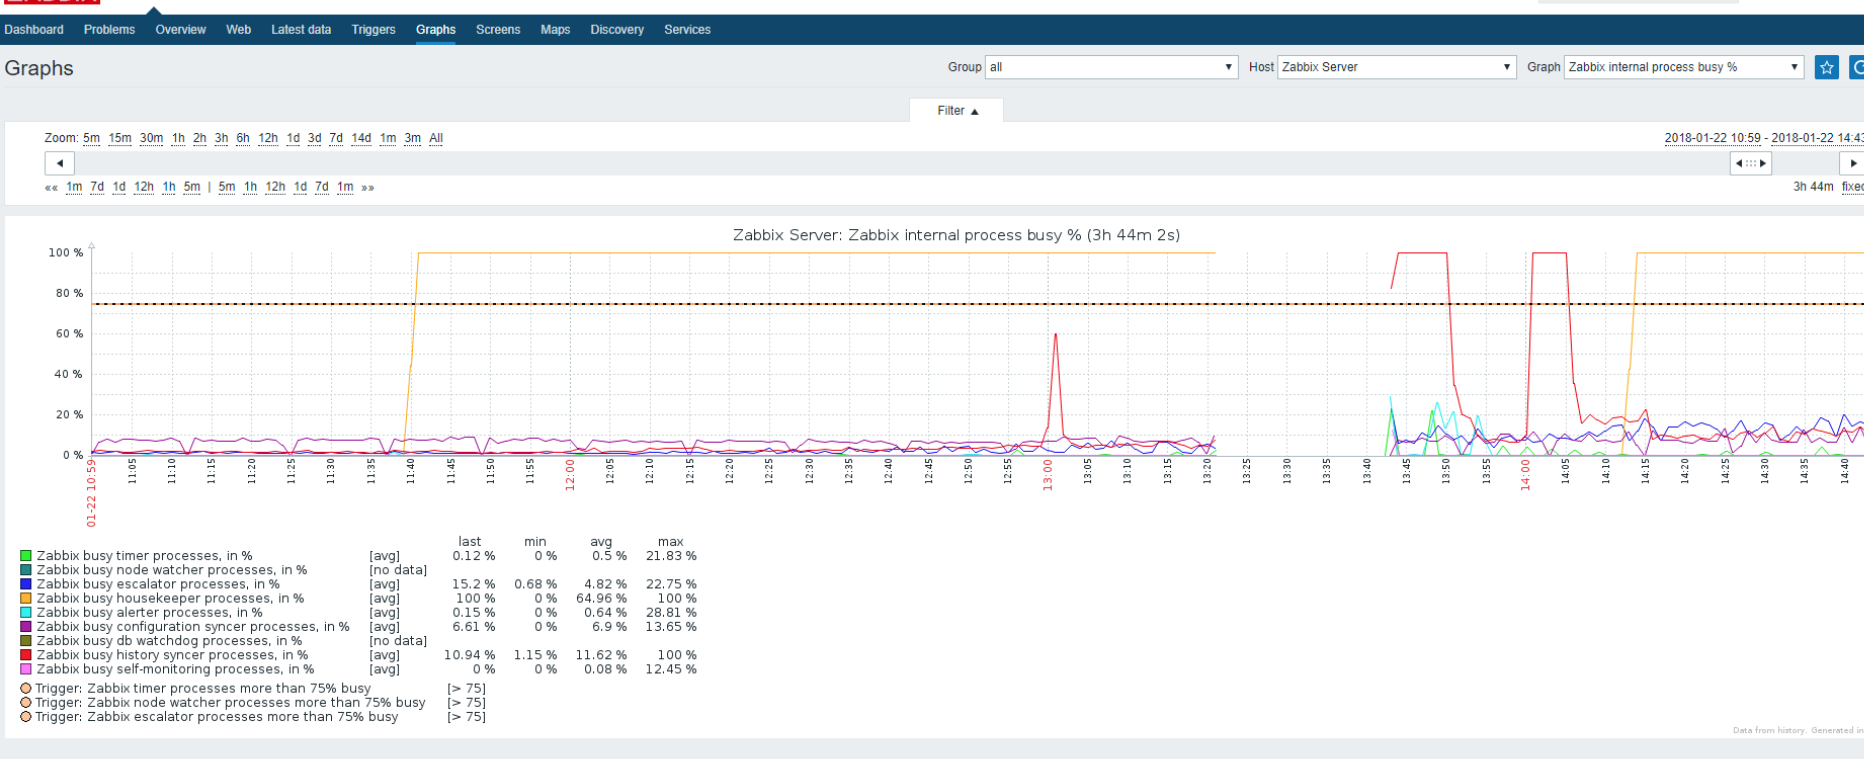
Unfortunately first crash log contains only part of the crash (attached files from 22-th), but the second last crash log from 28-th is fully populated in log:
=======================================
[root@zabbix ~]# tail -n 40 /home/...../zabbix_server.log
 14715:20180128:190014.416 [Z3005] query failed: [1366] Incorrect string value: '\xD0\x90R,la...' for column 'key_' at row 1 [insert into items (itemid,name,key_,hostid,type,value_type,delay,history,trends,status,trapper_hosts,units,formula,logtimefmt,valuemapid,params,ipmi_sensor,snmp_community,snmp_oid,port,snmpv3_securityname,snmpv3_securitylevel,snmpv3_authprotocol,snmpv3_authpassphrase,snmpv3_privprotocol,snmpv3_privpassphrase,authtype,username,password,publickey,privatekey,description,interfaceid,flags,snmpv3_contextname,jmx_endpoint,master_itemid) values (485296,'Average read latency of the datastore $3','vmware.hv.datastore.read[{$URL},{HOST.HOST},1001ÐR,latency]',12260,3,3,'1m','90d','365d',0,'','ms','','',null,'','','','','','',0,0,'',0,'',0,'{$USERNAME}','{$PASSWORD}','','','',2138,4,'','',null),(485297,'Free space of the datastore $3','vmware.hv.datastore.size[{$URL},{HOST.HOST},2000AR,free]',12260,3,0,'1m','90d','365d',1,'','B','','',null,'','','','','','',0,0,'',0,'',0,'{$USERNAME}','{$PASSWORD}','','','',2138,4,'','',null),(485298,'Free space of the datastore $3','vmware.hv.datastore.size[{$URL},{HOST.HOST},3002A,free]',12260,3,0,'1m','90d','365d',1,'','B','','',null,'','','','','','',0,0,'',0,'',0,'{$USERNAME}','{$PASSWORD}','','','',2138,4,'','',null),(485299,'Free space of the datastore $3','vmware.hv.datastore.size[{$URL},{HOST.HOST},3001A,free]',12260,3,0,'1m','90d','365d',1,'','B','','',null,'','','','','','',0,0,'',0,'',0,'{$USERNAME}','{$PASSWORD}','','','',2138,4,'','',null),(485300,'Free space of the datastore $3','vmware.hv.datastore.size[{$URL},{HOST.HOST},3000AR,free]',12260,3,0,'1m','90d','365d',1,'','B','','',null,'','','','','','',0,0,'',0,'',0,'{$USERNAME}','{$PASSWORD}','','','',2138,4,'','',null),(485301,'Percent Free space of the datastore $3','vmware.hv.datastore.size[{$URL},{HOST.HOST},1001ÐR,pfree]',12260,3,0,'1m','90d','365d',1,'','%','','',null,'','','','','','',0,0,'',0,'',0,'{$USERNAME}','{$PASSWORD}','','','',2138,4,'','',null),(485302,'Percent Free space of the datastore $3','vmware.hv.datastore.size[{$URL},{HOST.HOST},ESXi-01 Boot,pfree]',12260,3,0,'1m','90d','365d',1,'','%','','',null,'','','','','','',0,0,'',0,'',0,'{$USERNAME}','{$PASSWORD}','','','',2138,4,'','',null),(485303,'Percent Free space of the datastore $3','vmware.hv.datastore.size[{$URL},{HOST.HOST},3001A,pfree]',12260,3,0,'1m','90d','365d',1,'','%','','',null,'','','','','','',0,0,'',0,'',0,'{$USERNAME}','{$PASSWORD}','','','',2138,4,'','',null),(485304,'Average write latency of the datastore $3','vmware.hv.datastore.write[{$URL},{HOST.HOST},1001ÐR,latency]',12260,3,3,'1m','90d','365d',0,'','ms','','',null,'','','','','','',0,0,'',0,'',0,'{$USERNAME}','{$PASSWORD}','','','',2138,4,'','',null),(485305,'Average write latency of the datastore $3','vmware.hv.datastore.write[{$URL},{HOST.HOST},3001A,latency]',12260,3,3,'1m','90d','365d',0,'','ms','','',null,'','','','','','',0,0,'',0,'',0,'{$USERNAME}','{$PASSWORD}','','','',2138,4,'','',null),(485306,'Average read latency of the datastore $3','vmware.hv.datastore.read[{$URL},{HOST.HOST},3001A,latency]',12260,3,3,'1m','90d','365d',0,'','ms','','',null,'','','','','','',0,0,'',0,'',0,'{$USERNAME}','{$PASSWORD}','','','',2138,4,'','',null),(485307,'Free space of the datastore $3','vmware.hv.datastore.size[{$URL},{HOST.HOST},1001ÐR,free]',12260,3,0,'1m','90d','365d',1,'','B','','',null,'','','','','','',0,0,'',0,'',0,'{$USERNAME}','{$PASSWORD}','','','',2138,4,'','',null),(485308,'Free space of the datastore $3','vmware.hv.datastore.size[{$URL},{HOST.HOST},3026AR,free]',12260,3,0,'1m','90d','365d',1,'','B','','',null,'','','','','','',0,0,'',0,'',0,'{$USERNAME}','{$PASSWORD}','','','',2138,4,'','',null),(485309,'Free space of the datastore $3','vmware.hv.datastore.size[{$URL},{HOST.HOST},3025AR,free]',12260,3,0,'1m','90d','365d',1,'','B','','',null,'','','','','','',0,0,'',0,'',0,'{$USERNAME}','{$PASSWORD}','','','',2138,4,'','',null),(485310,'Free space of the datastore $3','vmware.hv.datastore.size[{$URL},{HOST.HOST},3024AR,free]',12260,3,0,'1m','90d','365d',1,'','B','','',null,'','','','','','',0,0,'',0,'',0,'{$USERNAME}','{$PASSWORD}','','','',2138,4,'','',null),(485311,'Free space of the datastore $3','vmware.hv.datastore.size[{$URL},{HOST.HOST},3021AR,free]',12260,3,0,'1m','90d','365d',1,'','B','','',null,'','','','','','',0,0,'',0,'',0,'{$USERNAME}','{$PASSWORD}','','','',2138,4,'','',null),(485312,'Free space of the datastore $3','vmware.hv.datastore.size[{$URL},{HOST.HOST},2021AR,free]',12260,3,0,'1m','90d','365d',1,'','B','','',null,'','','','','','',0,0,'',0,'',0,'{$USERNAME}','{$PASSWORD}','','','',2138,4,'','',null),(485313,'Free space of the datastore $3','vmware.hv.datastore.size[{$URL},{HOST.HOST},2023AR,free]',12260,3,0,'1m','90d','365d',1,'','B','','',null,'','','','','','',0,0,'',0,'',0,'{$USERNAME}','{$PASSWORD}','','','',2138,4,'','',null),(485314,'Free space of the datastore $3','vmware.hv.datastore.size[{$URL},{HOST.HOST},2022AR,free]',12260,3,0,'1m','90d','365d',1,'','B','','',null,'','','','','','',0,0,'',0,'',0,'{$USERNAME}','{$PASSWORD}','','','',2138,4,'','',null),(485315,'Free space of the datastore $3','vmware.hv.datastore.size[{$URL},{HOST.HOST},1002AR,free]',12260,3,0,'1m','90d','365d',1,'','B','','',null,'','','','','','',0,0,'',0,'',0,'{$USERNAME}','{$PASSWORD}','','','',2138,4,'','',null),(485316,'Free space of the datastore $3','vmware.hv.datastore.size[{$URL},{HOST.HOST},2011SRM-HeadOffice_PlaceHolder,free]',12260,3,0,'1m','90d','365d',1,'','B','','',null,'','','','','','',0,0,'',0,'',0,'{$USERNAME}','{$PASSWORD}','','','',2138,4,'','',null),(485317,'Free space of the datastore $3','vmware.hv.datastore.size[{$URL},{HOST.HOST},3014A,free]',12260,3,0,'1m','90d','365d',1,'','B','','',null,'','','','','','',0,0,'',0,'',0,'{$USERNAME}','{$PASSWORD}','','','',2138,4,'','',null),(485318,'Free space of the datastore $3','vmware.hv.datastore.size[{$URL},{HOST.HOST},3005A,free]',12260,3,0,'1m','90d','365d',1,'','B','','',null,'','','','','','',0,0,'',0,'',0,'{$USERNAME}','{$PASSWORD}','','','',2138,4,'','',null),(485319,'Free space of the datastore $3','vmware.hv.datastore.size[{$URL},{HOST.HOST},3004A,free]',12260,3,0,'1m','90d','365d',1,'','B','','',null,'','','','','','',0,0,'',0,'',0,'{$USERNAME}','{$PASSWORD}','','','',2138,4,'','',null),(485320,'Free space of the datastore $3','vmware.hv.datastore.size[{$URL},{HOST.HOST},3003L,free]',12260,3,0,'1m','90d','365d',1,'','B','','',null,'','','','','','',0,0,'',0,'',0,'{$USERNAME}','{$PASSWORD}','','','',2138,4,'','',null),(485321,'Free space of the datastore $3','vmware.hv.datastore.size[{$URL},{HOST.HOST},ESXi-01 Boot,free]',12260,3,0,'1m','90d','365d',1,'','B','','',null,'','','','','','',0,0,'',0,'',0,'{$USERNAME}','{$PASSWORD}','','','',2138,4,'','',null),(485322,'Free space of the datastore $3','vmware.hv.datastore.size[{$URL},{HOST.HOST},2002A,free]',12260,3,0,'1m','90d','365d',1,'','B','','',null,'','','','','','',0,0,'',0,'',0,'{$USERNAME}','{$PASSWORD}','','','',2138,4,'','',null),(485323,'Free space of the datastore $3','vmware.hv.datastore.size[{$URL},{HOST.HOST},2001AR,free]',12260,3,0,'1m','90d','365d',1,'','B','','',null,'','','','','','',0,0,'',0,'',0,'{$USERNAME}','{$PASSWORD}','','','',2138,4,'','',null);
]
 14715:20180128:190014.433 [Z3005] query failed: [1271] Illegal mix of collations for operation ' IN ' [select distinct t.triggerid,t.description,t.expression,t.recovery_expression from triggers t,functions f,items i where t.triggerid=f.triggerid and f.itemid=i.itemid and i.hostid=12260 and t.description in ('Free space on datastore 1001ÐR under 10%','Free space on datastore 1001ÐR under 5%','Free space on datastore 3001A under 10%','Free space on datastore 3001A under 5%','Free space on datastore ESXi-01 Boot under 10%','Free space on datastore ESXi-01 Boot under 5%') and not (t.triggerid between 76572 and 76581 or t.triggerid between 77048 and 77057 or t.triggerid in (76520,76564,76566,76568,76569,76570,76583,76584,77039,77040,77042,77044,77045,77046,77059,77060))]
 14715:20180128:190014.439 [Z3005] query failed: [1366] Incorrect string value: '\xD0\x90R un...' for column 'description' at row 2 [insert into triggers (triggerid,description,expression,priority,status,comments,url,type,value,state,flags,recovery_mode,recovery_expression,correlation_mode,correlation_tag,manual_close) values (86232,'Free space on datastore 3001A under 5%','{135845}<5',5,0,'','',0,0,0,4,0,'',0,'',0),(86233,'Free space on datastore 1001ÐR under 10%','{135846}<10',5,0,'','',0,0,0,4,0,'',0,'',0),(86234,'Free space on datastore ESXi-01 Boot under 10%','{135847}<10',5,0,'','',0,0,0,4,0,'',0,'',0),(86235,'Free space on datastore 3001A under 10%','{135848}<10',5,0,'','',0,0,0,4,0,'',0,'',0),(86236,'Free space on datastore 1001ÐR under 5%','{135849}<5',5,0,'','',0,0,0,4,0,'',0,'',0),(86237,'Free space on datastore ESXi-01 Boot under 5%','{135850}<5',5,0,'','',0,0,0,4,0,'',0,'',0);
]
 14715:20180128:190014.445 [Z3005] query failed: [1270] Illegal mix of collations (latin1_swedish_ci,IMPLICIT), (utf8_general_ci,COERCIBLE), (utf8_general_ci,COERCIBLE) for operation ' IN ' [select g.name from graphs g,graphs_items gi,items i where g.graphid=gi.graphid and gi.itemid=i.itemid and i.hostid=12260 and g.name in ('VMWare Hypervisor Monitoring - R/W Latency - 3001A','VMWare Hypervisor Monitoring - R/W Latency - 1001ÐR') and not (g.graphid between 28960 and 28967 or g.graphid in (20345,20349,20351,20352,20353,20354,20657,20932,25257,28970,28971))]
 14715:20180128:190014.450 [Z3005] query failed: [1366] Incorrect string value: '\xD0\x90R' for column 'name' at row 2 [insert into graphs (graphid,name,width,height,yaxismin,yaxismax,show_work_period,show_triggers,graphtype,show_legend,show_3d,percent_left,percent_right,ymin_type,ymin_itemid,ymax_type,ymax_itemid,flags) values (38921,'VMWare Hypervisor Monitoring - R/W Latency - 3001A',900,200,0.000000,100.000000,1,1,0,1,0,0.000000,0.000000,0,null,0,null,4),(38922,'VMWare Hypervisor Monitoring - R/W Latency - 1001ÐR',900,200,0.000000,100.000000,1,1,0,1,0,0.000000,0.000000,0,null,0,null,4);
]
 14715:20180128:190014.454 [Z3005] query failed: [1271] Illegal mix of collations for operation ' IN ' [select g.name from graphs g,graphs_items gi,items i where g.graphid=gi.graphid and gi.itemid=i.itemid and i.hostid=12260 and g.name in ('VMWare Hypervisor Monitoring - Free Space - 3001A','VMWare Hypervisor Monitoring - Free Space - 1001ÐR','VMWare Hypervisor Monitoring - Free Space - ESXi-01 Boot') and not (g.graphid between 32140 and 32149 or g.graphid in (32132,32134,32136,32137,32138,32151,32152,32153))]
 14715:20180128:190014.460 [Z3005] query failed: [1366] Incorrect string value: '\xD0\x90R' for column 'name' at row 2 [insert into graphs (graphid,name,width,height,yaxismin,yaxismax,show_work_period,show_triggers,graphtype,show_legend,show_3d,percent_left,percent_right,ymin_type,ymin_itemid,ymax_type,ymax_itemid,flags) values (38921,'VMWare Hypervisor Monitoring - Free Space - 3001A',900,200,0.000000,100.000000,1,1,0,1,0,0.000000,0.000000,0,null,0,null,4),(38922,'VMWare Hypervisor Monitoring - Free Space - 1001ÐR',900,200,0.000000,100.000000,1,1,0,1,0,0.000000,0.000000,0,null,0,null,4),(38923,'VMWare Hypervisor Monitoring - Free Space - ESXi-01 Boot',900,200,0.000000,100.000000,1,1,0,1,0,0.000000,0.000000,0,null,0,null,4);
]
 14716:20180128:190017.364 Got signal [signal:11(SIGSEGV),reason:1,refaddr:0x0]. Crashing ...
 14716:20180128:190017.364 ====== Fatal information: ======
 14716:20180128:190017.365 program counter not available for this architecture
 14716:20180128:190017.365 === Registers: ===
 14716:20180128:190017.365 register dump not available for this architecture
 14716:20180128:190017.365 === Backtrace: ===
 14716:20180128:190017.369 12: 0x49c3ab <zbx_set_common_signal_handlers+667> at /usr/local/sbin/zabbix_server
 14716:20180128:190017.369 11: 0x80455779d <pthread_sigmask+1293> at /lib/libthr.so.3
 14716:20180128:190017.369 10: 0x804556d6f <pthread_getspecific+3743> at /lib/libthr.so.3
 14716:20180128:190017.370 9: 0x7ffffffff193
 14716:20180128:190017.370 8: 0x455439 <zbx_tm_get_remote_tasks+153> at /usr/local/sbin/zabbix_server
 14716:20180128:190017.370 7: 0x441a90 <zbx_send_proxy_data_respose+64> at /usr/local/sbin/zabbix_server
 14716:20180128:190017.370 6: 0x441d57 <zbx_recv_proxy_data+455> at /usr/local/sbin/zabbix_server
 14716:20180128:190017.370 5: 0x43fabc <trapper_thread+2396> at /usr/local/sbin/zabbix_server
 14716:20180128:190017.370 4: 0x4a5980 <zbx_thread_start+32> at /usr/local/sbin/zabbix_server
 14716:20180128:190017.370 3: 0x422eb8 <MAIN_ZABBIX_ENTRY+1240> at /usr/local/sbin/zabbix_server
 14716:20180128:190017.371 2: 0x49b4e5 <daemon_start+437> at /usr/local/sbin/zabbix_server
 14716:20180128:190017.371 1: 0x422920 <main+1264> at /usr/local/sbin/zabbix_server
 14716:20180128:190017.371 0: 0x41a47f <_start+383> at /usr/local/sbin/zabbix_server
 14716:20180128:190017.371 === Memory map: ===
 14716:20180128:190017.371 memory map not available for this platform
 14716:20180128:190017.371 ================================
 14618:20180128:190017.395 One child process died (PID:14716,exitcode/signal:1). Exiting ...
 14734:20180128:190017.453 cannot write to IPC socket: Bad file descriptor
 14618:20180128:190020.191 syncing history data...
 14618:20180128:190020.370 syncing history data done
 14618:20180128:190020.370 syncing trend data...
 14618:20180128:190027.559 syncing trend data done
 14618:20180128:190027.559 Zabbix Server stopped. Zabbix 3.4.0 (revision 71467).
==============================
Then we started zabbix service manually without problems (after both crashes).
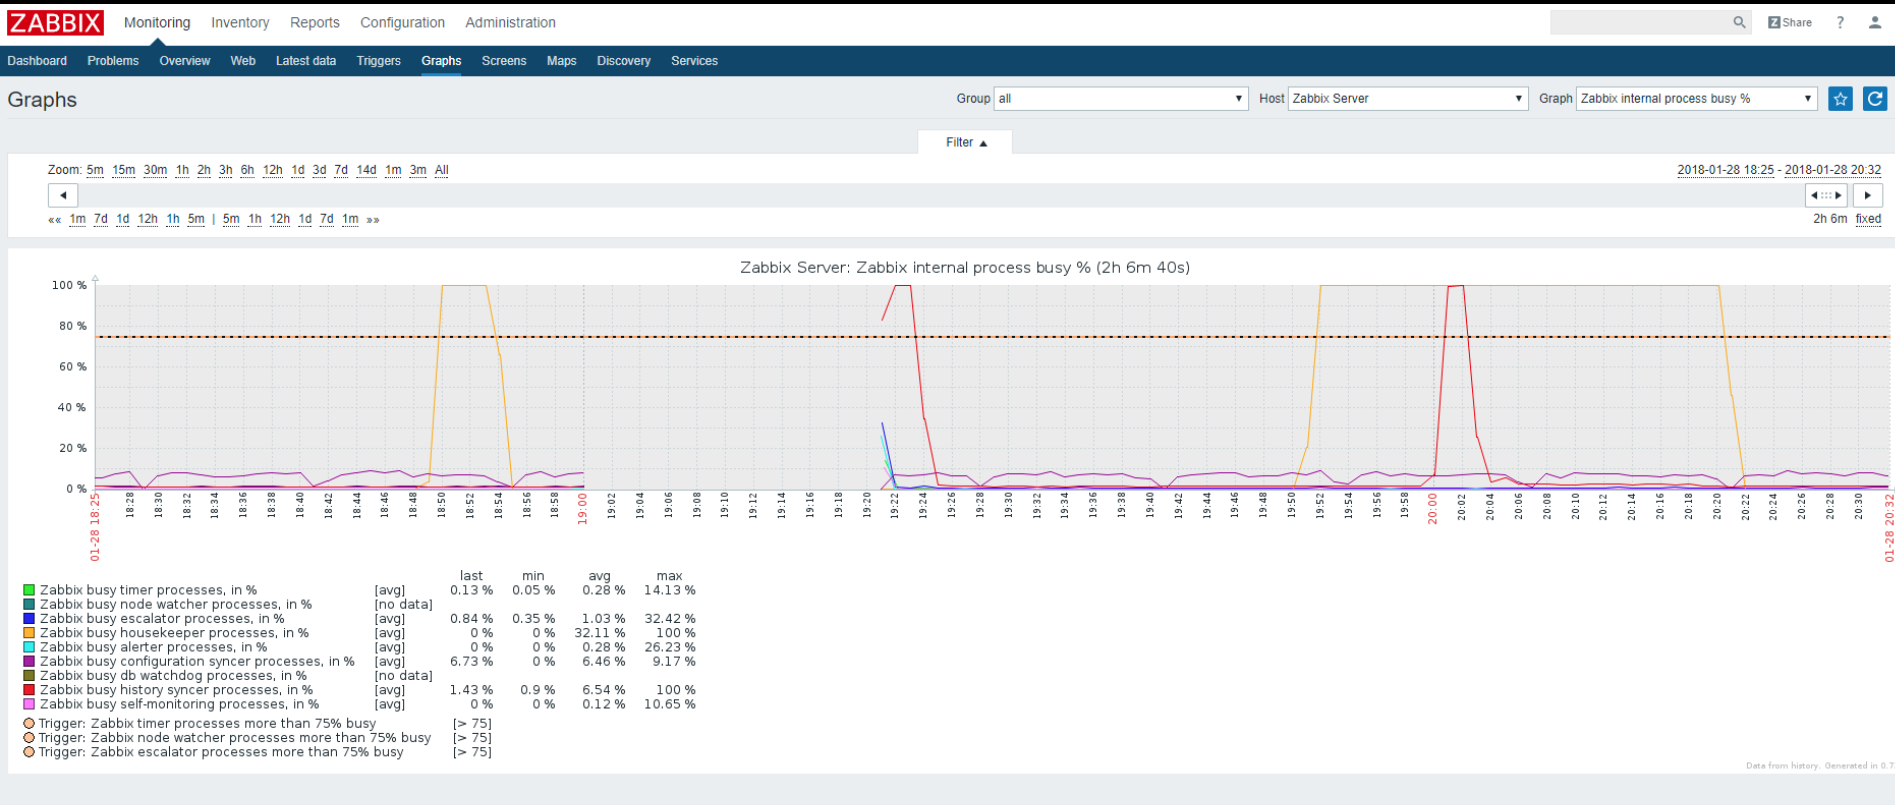
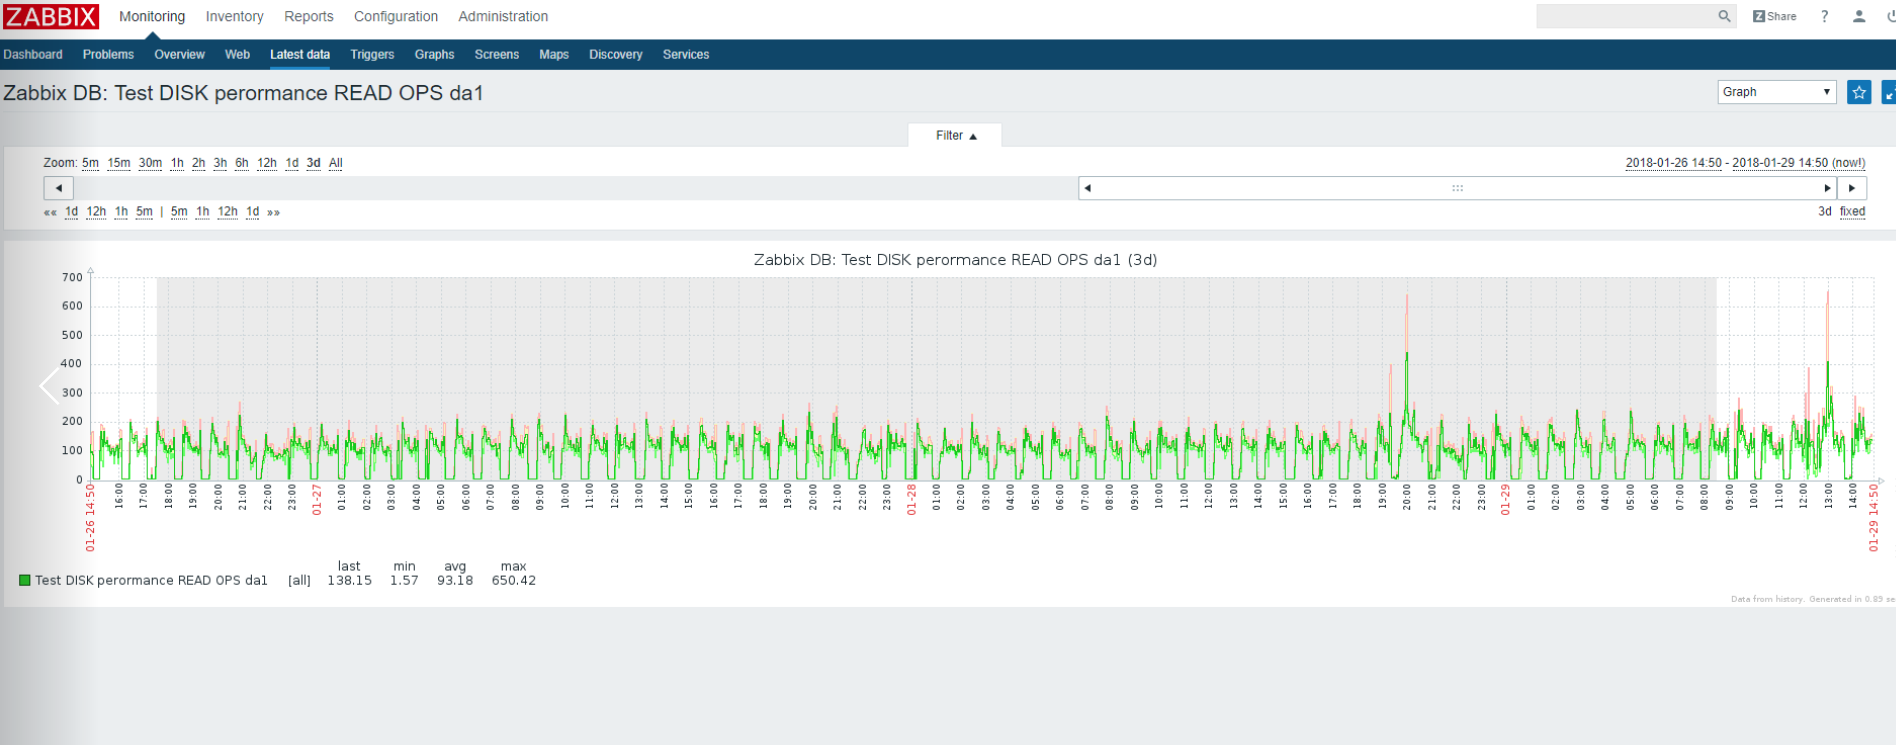
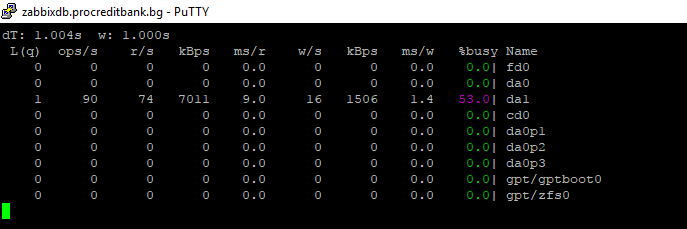
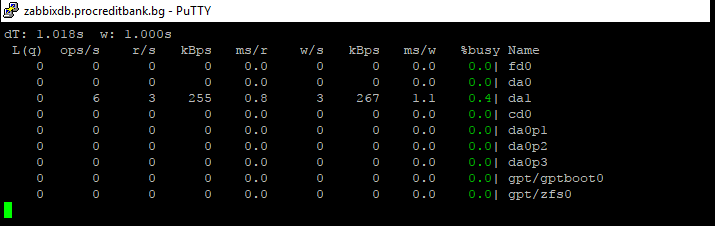
Additional information: On first crash (22-th Jan) we had housekeeping prolonged for unusual longer time period, but on second crash housekeeping wasn't involved at all. Also, our ZabbixDB (separate machine) data disk is a bit overloaded most of the time by mysql reads - at around 90-100% busy (screenshots attached), with some regular pauses at around 0% - seen on screenshots.
Reproducing the problem is not easy, it is not predictable. This is a production environment and zabbix service outage is highly undesirable. Debug level 4, if we leave it for longer, causes the server to be CPU overloaded, so for now we leave it on default DebugLevel=3.