-
Type:
Incident report
-
Resolution: Duplicate
-
Priority:
Minor
-
None
-
Affects Version/s: 3.4.5
-
Component/s: Frontend (F)
Hello
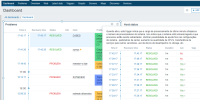
We have a trigger with many events. In our default Dashboad we have the "Problems" widget (see image). This widget generates a very slow query when this trigger is displayed (more than 1 min of execution time).
This problem occurs only with this trigger that has many events.
The slow query is
SELECT DISTINCT e.eventid,e.clock,e.ns,e.objectid,er1.r_eventid
FROM events e LEFT JOIN event_recovery er1 ON er1.eventid=e.eventid
WHERE e.source='0' AND e.object='0' AND e.objectid='580090' AND e.eventid<='280382509' AND e.value='1'
ORDER BY e.eventid DESC LIMIT 20
The query plan
| id | select_type | table | partitions | type | possible_keys | key | key_len | ref | rows | filtered | Extra |
| 1 | SIMPLE | e | NULL | range | PRIMARY,events_1,events_2 | PRIMARY | 8 | NULL | 53393594 | 0.00 | Using where; Using temporary |
| 1 | SIMPLE | er1 | NULL | eq_ref | PRIMARY | PRIMARY | 8 | zabbix20.e.eventid | 1 | 100.00 | NULL |
For another trigger with less events the plan is
| id | select_type | table | partitions | type | possible_keys | key | key_len | ref | rows | filtered | Extra |
| 1 | SIMPLE | e | NULL | ref | PRIMARY,events_1,events_2 | events_1 | 16 | const,const,const | 815 | 5.00 | Using index condition; Using where; Using temporary; Using filesort |
| 1 | SIMPLE | er1 | NULL | eq_ref | PRIMARY | PRIMARY | 8 | zabbix20.e.eventid | 1 | 100.00 | NULL |
As you can see, Mysql does a full scan on events table when the trigger has many events.
mysql> select count(1)
-> FROM
-> events e LEFT JOIN event_recovery er1 ON
-> er1.eventid=e.eventid
-> WHERE
-> e.source='0' AND
-> e.object='0' AND
-> e.objectid='580090' AND
-> e.eventid<='280395347' AND
-> e.value='1';
| count(1) |
| 14127 |
1 row in set (0.45 sec)
The problem is related to the query limit. The same query without the limit is fast even for this trigger with many events.
Query plan without limit
| id | select_type | table | partitions | type | possible_keys | key | key_len | ref | rows | filtered | Extra |
| 1 | SIMPLE | e | NULL | ref | PRIMARY,events_1,events_2 | events_1 | 16 | const,const,const | 52396 | 5.00 | Using index condition; Using where; Using temporary; Using filesort |
| 1 | SIMPLE | er1 | NULL | eq_ref | PRIMARY | PRIMARY | 8 | zabbix20.e.eventid | 1 | 100.00 | NULL |
See
https://www.percona.com/blog/2006/09/01/mysql-order-by-limit-performance-optimization/
This problem only occurs in this widget. In the event details screen, the search is fast. The query for the event details screen changes a bit:
SELECT DISTINCT e.eventid,e.source,e.object,e.objectid,e.clock,e.ns,e.acknowledged,er1.r_eventid
FROM events e LEFT JOIN event_recovery er1 ON er1.eventid=e.eventid
WHERE e.source='0' AND e.object='0' AND e.objectid='580090' AND e.eventid<='280392998' AND e.value='1'
ORDER BY e.clock DESC,e.eventid DESC LIMIT 20
Thank you
- duplicates
-
ZBX-12867 Too slow dashboard when big events table
-
- Closed
-
