-
Type:
Problem report
-
Resolution: Duplicate
-
Priority:
 Critical
-
None
-
Affects Version/s: 3.4.5, 3.4.6
-
Component/s: Server (S)
-
Environment:Ubuntu 16.04 LTS server with Zabbix agent v3.4.6 under monitoring
CentOS 7.4 based server with Zabbix server v3.4.6
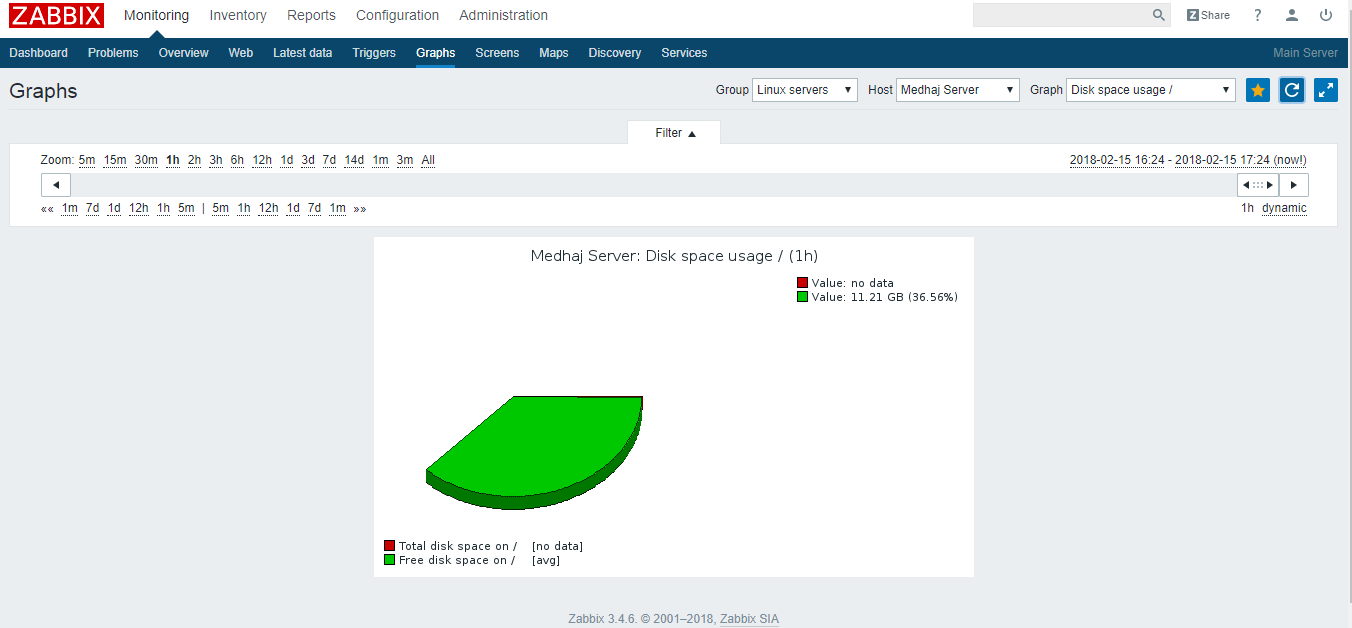
After upgrading to Zabbix server v3.4.6, under monitroing->graphs when I am selecting "disk usage /" for any server which I am monitoring, it is showing NO DATA and thus no pie graph is plotted.
But under DATA OVERVIEW, the numerical value is coming. Thus, this indicates that the data is from the agent is being fetched successfully.
But, it is not plotting graph so what is the possible reason?
- duplicates
-
-

- Closed
-