-
Type:
Problem report
-
Resolution: Fixed
-
Priority:
Major
-
Affects Version/s: 3.4.6
-
Component/s: Templates (T)
-
None
-
Environment:rhel 7 mysql 5.7 esx vm
-
Sprint 48, Jan 2019, Sprint 50 (Mar 2019), Sprint 51 (Apr 2019)
-
0.5
Internal events are being generated at the rate of 200-300K per hour causing DB performance particularly on subsequent housekeeping.
This was occurring at 3.4.3, we upgraded to 3.4.6, then downgraded to 3.4.4.
Multiple triggers from the same or similar prototype are involved, sample problem expression:
 {csg5k1:net.if.in.errors[ifInErrors.436744192].avg(5m)}>{$IF_ERRORS_WARN:"Ethernet2/4"}
or {csg5k1:net.if.out.errors[ifOutErrors.436744192].avg(5m)}>{$IF_ERRORS_WARN:"Ethernet2/4"}
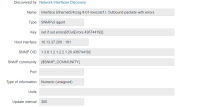
Some of these items are "no longer discoverable" but seem to have current data.
From events table:
mysql> SELECT *, from_unixtime(clock) FROM `events` where objectid = '557484' and clock > 1518703402;
+------------+--------+--------+----------+------------+-------+--------------+-----------+----------------------+
| eventid    | source | object | objectid | clock      | value | acknowledged | ns        | from_unixtime(clock) |
+------------+--------+--------+----------+------------+-------+--------------+-----------+----------------------+
| 2190699837 |      3 |      0 |   557484 | 1518703403 |     1 |            0 | 229287230 | 2018-02-15 08:03:23  |
| 2190699841 |      3 |      0 |   557484 | 1518703403 |     0 |            0 | 296987531 | 2018-02-15 08:03:23  |
| 2190699900 |      3 |      0 |   557484 | 1518703703 |     1 |            0 | 169720459 | 2018-02-15 08:08:23  |
| 2190699904 |      3 |      0 |   557484 | 1518703703 |     0 |            0 | 341357790 | 2018-02-15 08:08:23  |
| 2190699947 |      3 |      0 |   557484 | 1518704003 |     1 |            0 | 759683866 | 2018-02-15 08:13:23  |
| 2190699951 |      3 |      0 |   557484 | 1518704003 |     0 |            0 | 889302993 | 2018-02-15 08:13:23  |
| 2190700003 |      3 |      0 |   557484 | 1518704303 |     1 |            0 | 161123348 | 2018-02-15 08:18:23  |
| 2190700007 |      3 |      0 |   557484 | 1518704303 |     0 |            0 | 266823146 | 2018-02-15 08:18:23  |
| 2190700046 |      3 |      0 |   557484 | 1518704603 |     1 |            0 | 791924074 | 2018-02-15 08:23:23  |
| 2190700050 |      3 |      0 |   557484 | 1518704603 |     0 |            0 | 791924074 | 2018-02-15 08:23:23  |
+------------+--------+--------+----------+------------+-------+--------------+-----------+----------------------+
10 rows in set (1.13 sec)
I haven't found any corresponding messages or internal item events.
Volume of events is causing total zabbix failure.
