-
Type:
Problem report
-
Resolution: Fixed
-
Priority:
 Minor
Minor
-
Affects Version/s: 3.4.11
-
Component/s: Frontend (F)
-
None
-
Sprint 40, Sprint 41, Sprint 42, Sprint 43, Sprint 44
-
2
Create a zabbix trapper item (float), send a value (or identical values) in range between (including) -13.94 and -13.99.
From latest data page, on a simple graph (height = 200 px), these values will not be shown.
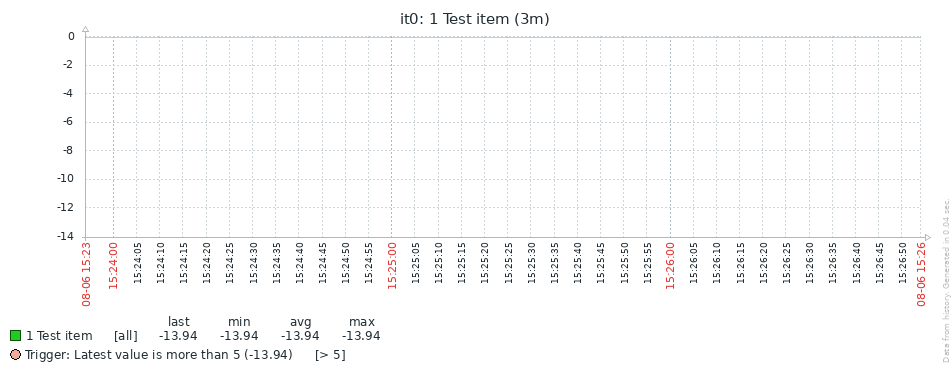
I suppose they are drawn on a most bottom pixels line and supposedly overwritten by X axis line.
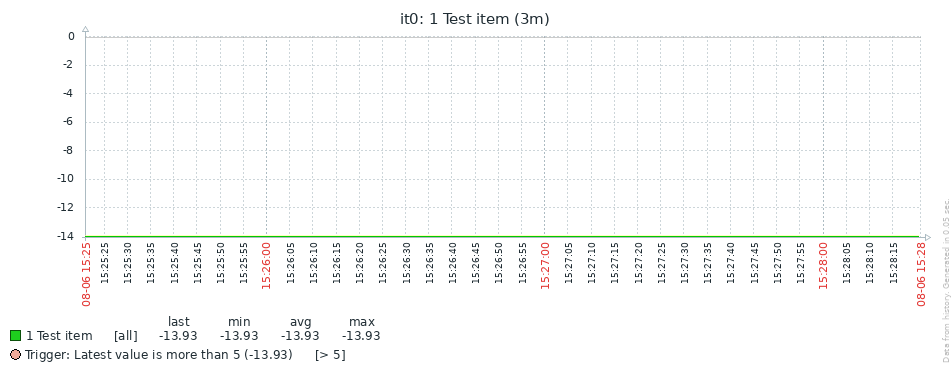
Note that values out of the range will be shown:
-14.00 shown with different Y axis scale.
-13.93 as a line above X axis;
