-
Type:
Problem report
-
Resolution: Fixed
-
Priority:
 Trivial
-
Affects Version/s: 3.4.13
-
Component/s: Server (S)
-
None
Steps to reproduce:
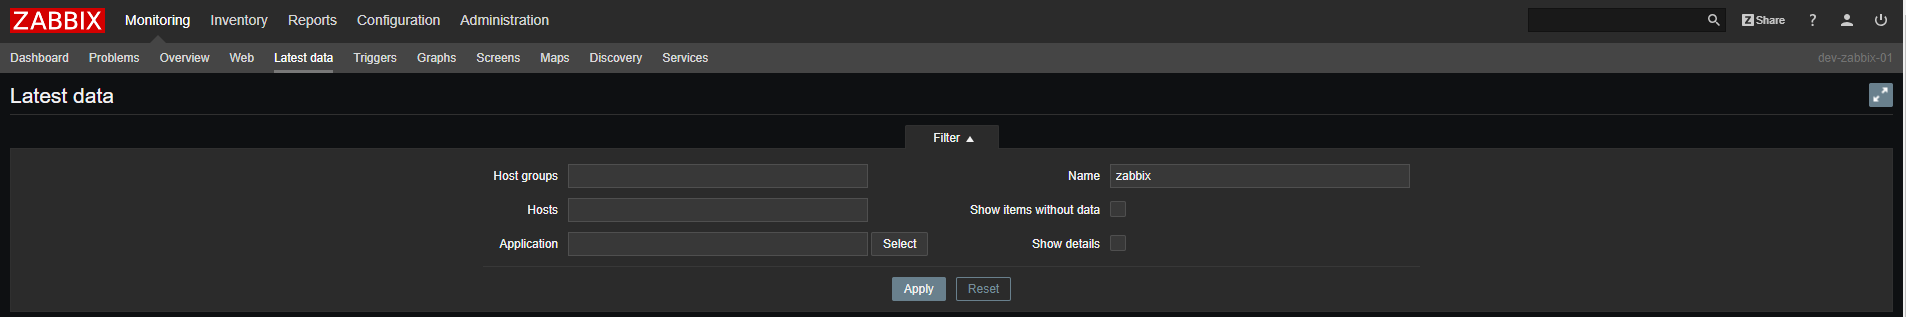
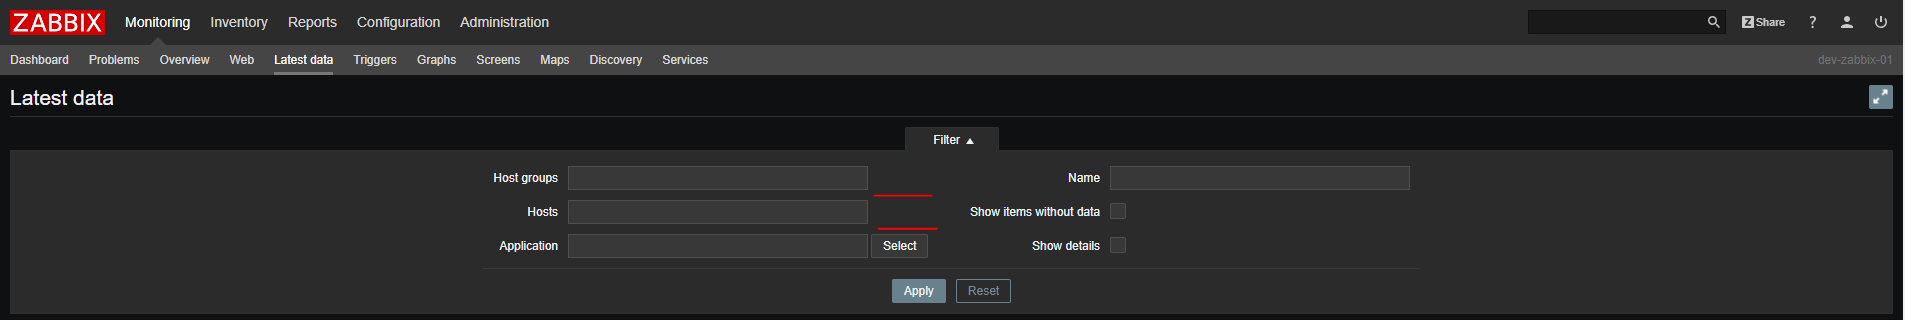
- Using Chrome v69 and Zabbix Server v3.4.13 navigate to Monitoring > Latest Data
- Host Groups and Hosts are both missing the Select button and I cannot click inside of them
- If I type something in the Name: section and click apply I get an HTTP 500 error
Result:
See the screenshot for how this is functioning incorrectly in v3.4.13 and Chrome 69
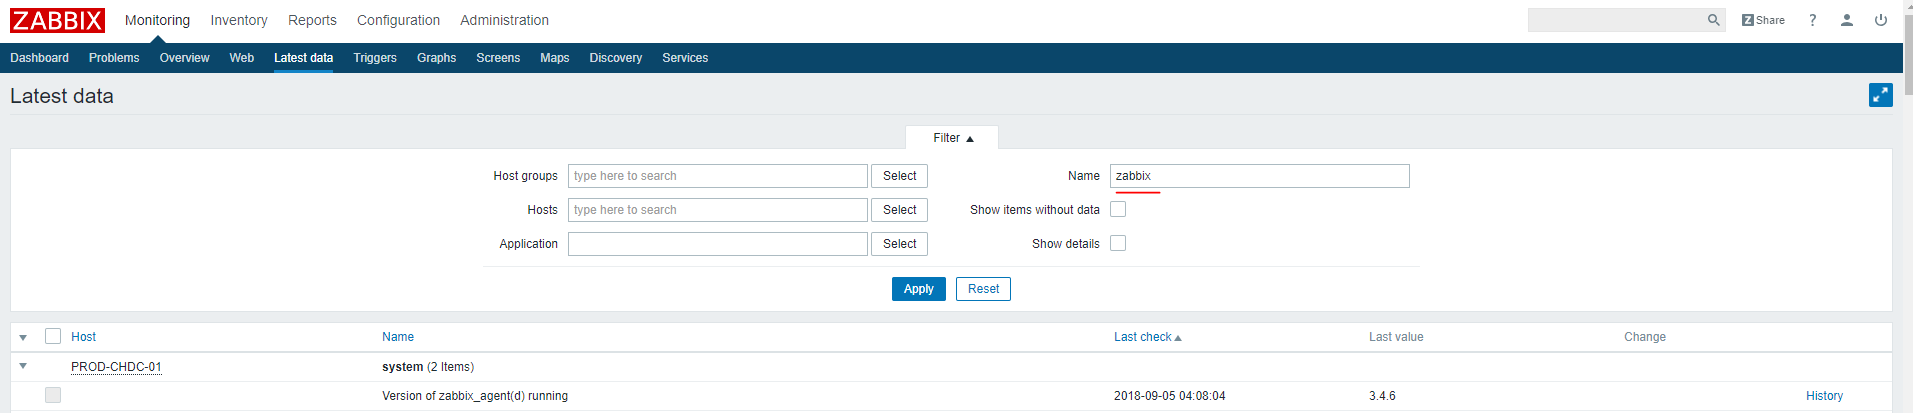
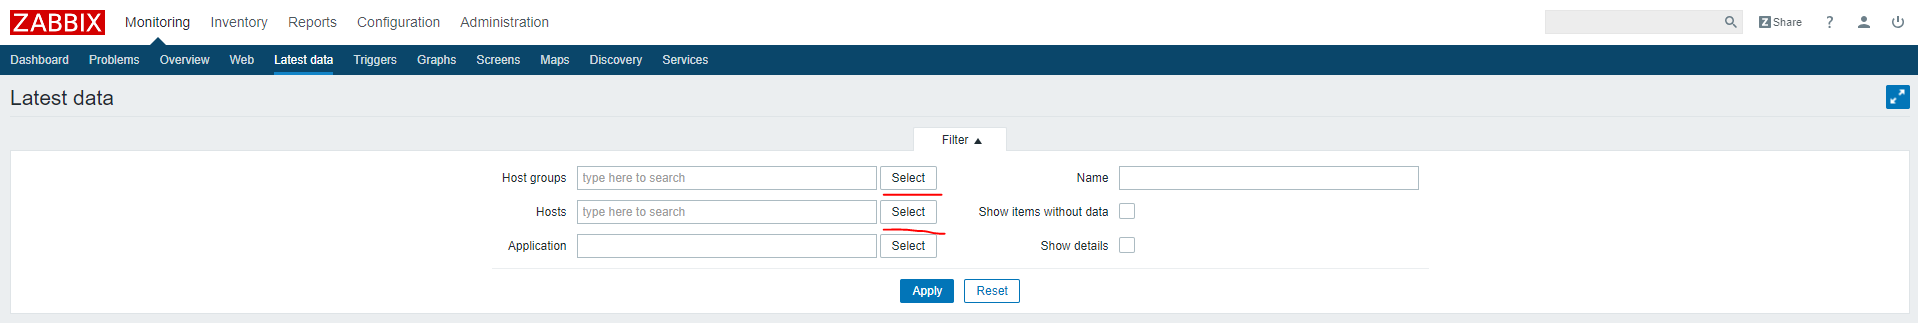
Expected:
See the screenshot this is working correctly in v3.4.12 and Chrome 69