-
Type:
Problem report
-
Resolution: Fixed
-
Priority:
 Major
Major
-
Affects Version/s: 4.0.1
-
Component/s: Frontend (F)
-
Sprint 46, Nov 2018
-
0.25
Steps to reproduce:
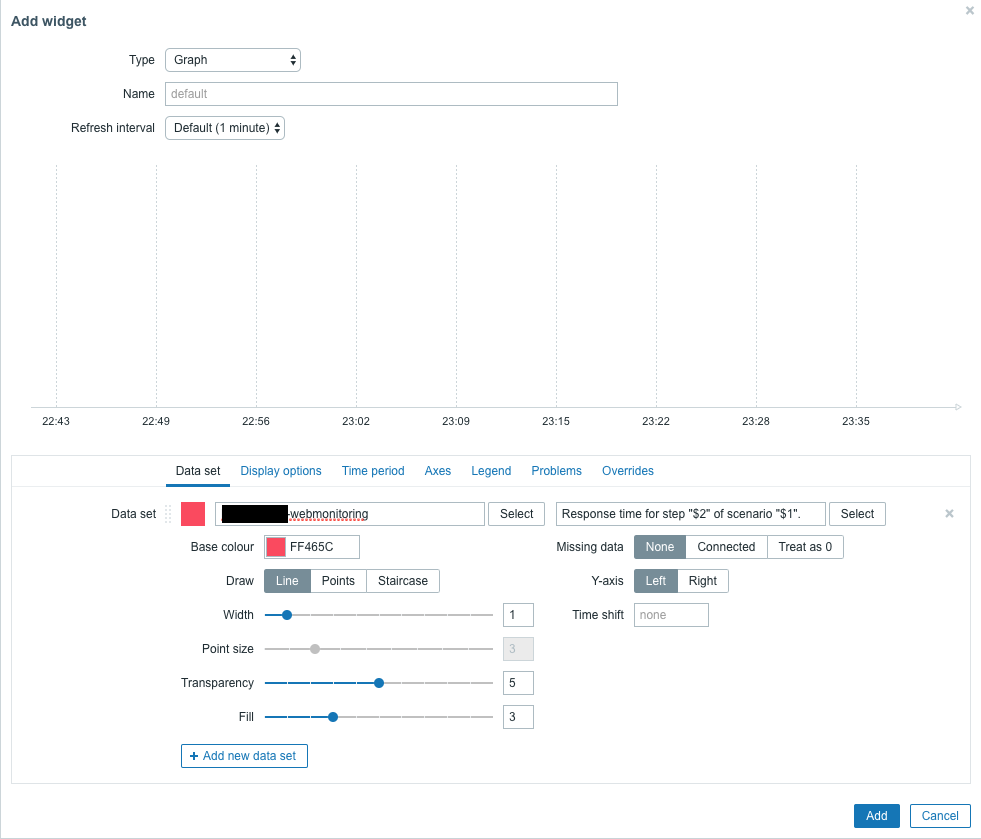
- Add a new widget of type Graph
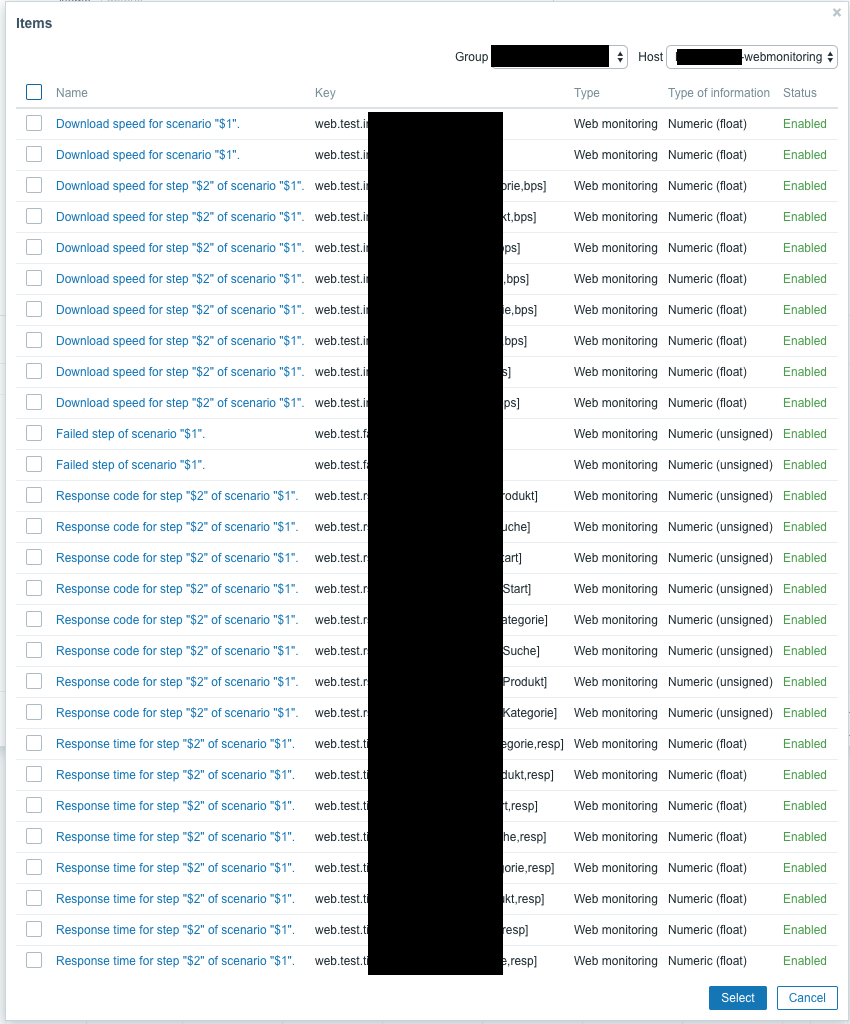
- In the data set select the webmonitoring host and open the item dialog.
- Select a random item, eg. Response time for step "$2" of scenario "$1".
Result:
Although the item is selected via the dialog, the resulting graph is empty (see screenshot attached).
Expected:
I expected the response time being rendered on the graph.
There is a specific note about positional macros in the documentation:
Note that item names containing deprecated positional macros ($1-$9) are not resolved in this field. Therefore it will not be possible to add any of the items named like CPU $2 time individually to the graph using its resolved name (like CPU user time); while using its unresolved name CPU $2 time will add all corresponding items to the graph (e.g. CPU user time, CPU system time, CPU idle time, etc.).
So either this is a bug in the graphs, the documentation or in the dialog.
