-
Type:
Incident report
-
Resolution: Cannot Reproduce
-
Priority:
 Major
Major
-
None
-
Affects Version/s: None
-
Component/s: Proxy (P), Server (S)
-
None
-
Environment:zabbix_server (Zabbix) 3.4.14
zabbix_proxy (Zabbix) 3.4.14
Zabbix deployment structure:
Switch(snmpv2) → proxy → Internet
Switch(snmpv2) → proxy → Internet → Server
Switch(snmpv2) → proxy → Internet
When the fault occurs:
zabbix server network has experienced serious packet loss.
phenomenon:
1、proxy log
13995:20181114:005331.315 cannot send heartbeat message to server at "syszabbix.qiniu.io": ZBX_TCP_READ() timed out
13995:20181114:005531.034 cannot send heartbeat message to server at "syszabbix.qiniu.io": ZBX_TCP_READ() timed out
13995:20181114:005731.281 cannot send heartbeat message to server at "syszabbix.qiniu.io": ZBX_TCP_READ() timed out
2、server log
12389:20181114:005629.457 failed to accept an incoming connection: connection rejected, getpeername() failed: [107] Transport endpoint is not connected
12389:20181114:005629.457 failed to accept an incoming connection: connection rejected, getpeername() failed: [107] Transport endpoint is not connected
12389:20181114:005629.457 failed to accept an incoming connection: connection rejected, getpeername() failed: [107] Transport endpoint is not connected
12386:20181114:005747.497 failed to accept an incoming connection: connection rejected, getpeername() failed: [107] Transport endpoint is not connected
12386:20181114:005747.497 failed to accept an incoming connection: connection rejected, getpeername() failed: [107] Transport endpoint is not connected
12386:20181114:005747.497 failed to accept an incoming connection: connection rejected, getpeername() failed: [107] Transport endpoint is not connected
12386:20181114:005747.497 failed to accept an incoming connection: connection rejected, getpeername() failed: [107] Transport endpoint is not connected
12386:20181114:005747.497 failed to accept an incoming connection: connection rejected, getpeername() failed: [107] Transport endpoint is not connected
12386:20181114:005747.497 failed to accept an incoming connection: connection rejected, getpeername() failed: [107] Transport endpoint is not connected
12386:20181114:005747.498 failed to accept an incoming connection: connection rejected, getpeername() failed: [107] Transport endpoint is not connected
12386:20181114:005747.498 failed to accept an incoming connection: connection rejected, getpeername() failed: [107] Transport endpoint is not connected
12386:20181114:005747.498 failed to accept an incoming connection: connection rejected, getpeername() failed: [107] Transport endpoint is not connected
12386:20181114:005747.498 failed to accept an incoming connection: connection rejected, getpeername() failed: [107] Transport endpoint is not connected
12386:20181114:005747.498 failed to accept an incoming connection: connection rejected, getpeername() failed: [107] Transport endpoint is not connected
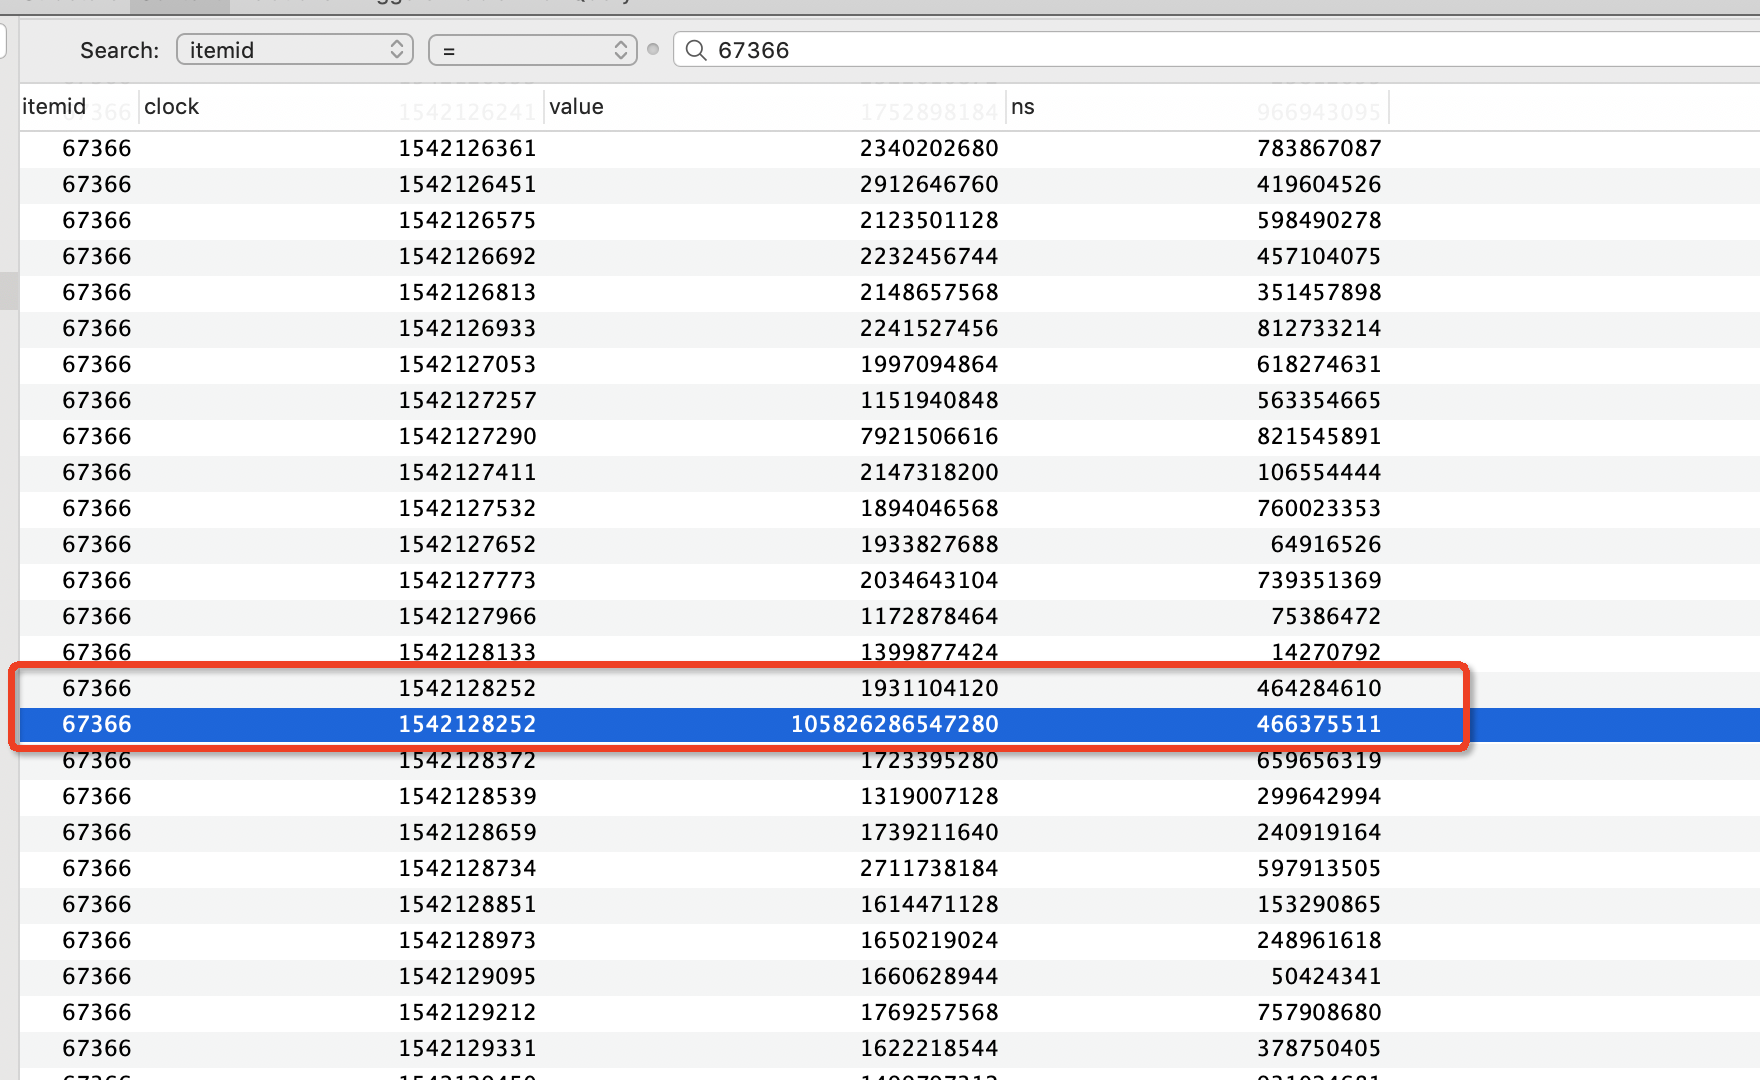
3、the same clock time appears twice the value.(as shown)
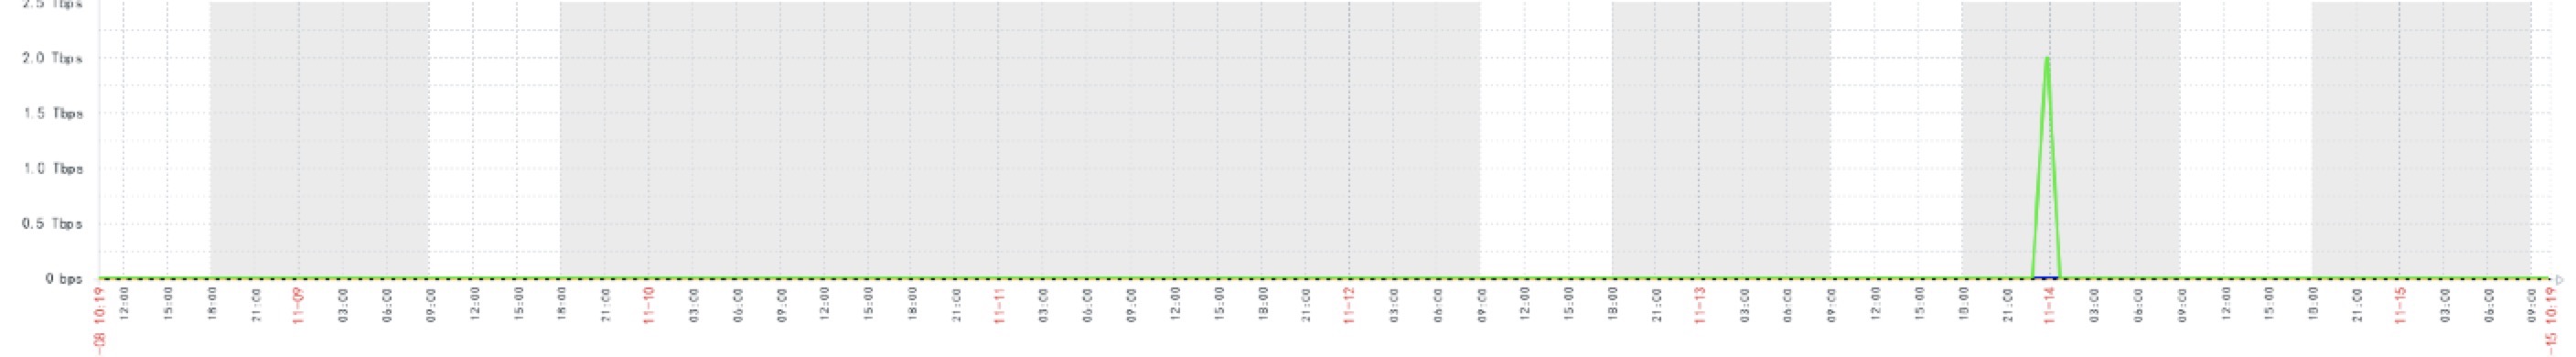
4、the flow chart shows that the flow is too high.(as shown)
Summary of related issues (the following are unresolved issues)
1、https://support.zabbix.com/browse/ZBX-14318
2、https://support.zabbix.com/browse/ZBX-14322
Doubt:
When the zabbix proxy and the zabbix server transmit data, the network has packet loss, and the packet retransmission causes the multiple values to be repeated and accumulated due to some reason.
Remarks:
When the zabbix server network loses packets, not all monitoring items have traffic bursts. The same switch may have a problem with the A port, and the B port is ok.