-
Type:
Incident report
-
Resolution: Incomplete
-
Priority:
 Major
Major
-
None
-
Affects Version/s: 4.0.1
-
Component/s: Frontend (F), Server (S)
Hello
I don't exactly know how to explain this... and I believe there should be two issues opened for my case but I first explain the case then you may judge.
I installed zabbix on a rather not very fast server (by terms of IO) with Postgres as the backend DB. At first it was doing well, then we added templates and hosts and set housekeeper, and IO overload problems begun to start.
It's good to mention that increasing size of history cache didn't help.
Then we met elasticsearch solution. We were thinking it can help if we store values inside of it instead of postgres. Afterwards, it was doing well for a bunch of days (housekeeper was doing like a flash), but then we met massive timeout in all network related checks. Also there was a problem with frontend (second issue) that if we dropped an indice (time based ingests, as you mentioned in your migration guide), frontend was not scanning for trends OR trends were missing (as we know trends are still stored in Postgres).
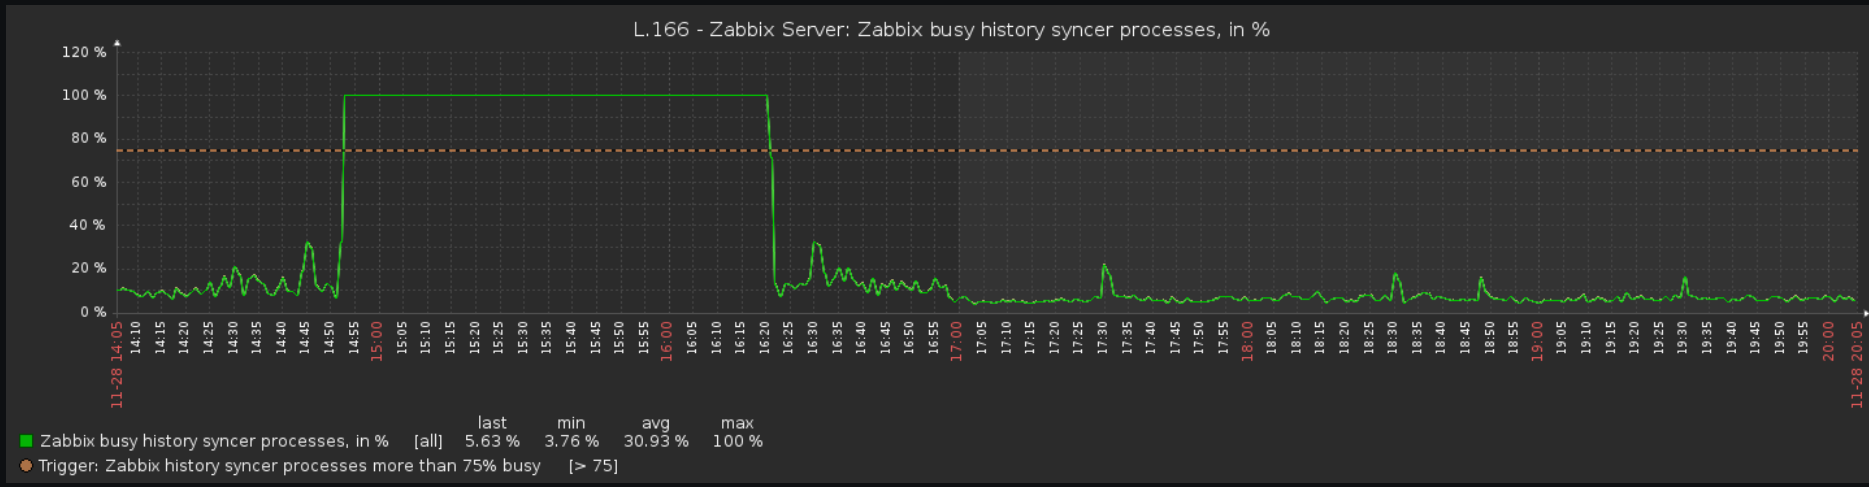
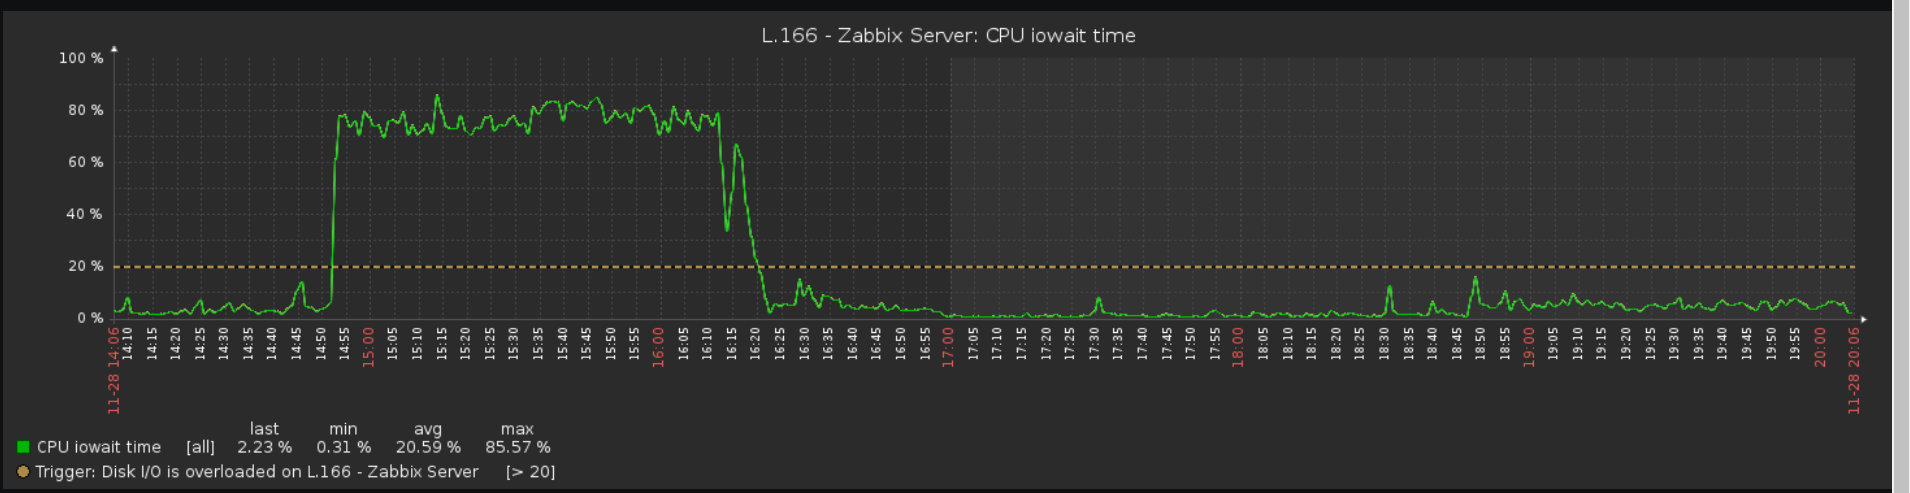
Anyway, meanwhile that massive timeout was happening, IO was completely busy with unbelievable 40-80 MBytes/sec read operations all done by java (elasticsearch ones). Surprise that write speed was around 0-100 KB/sec
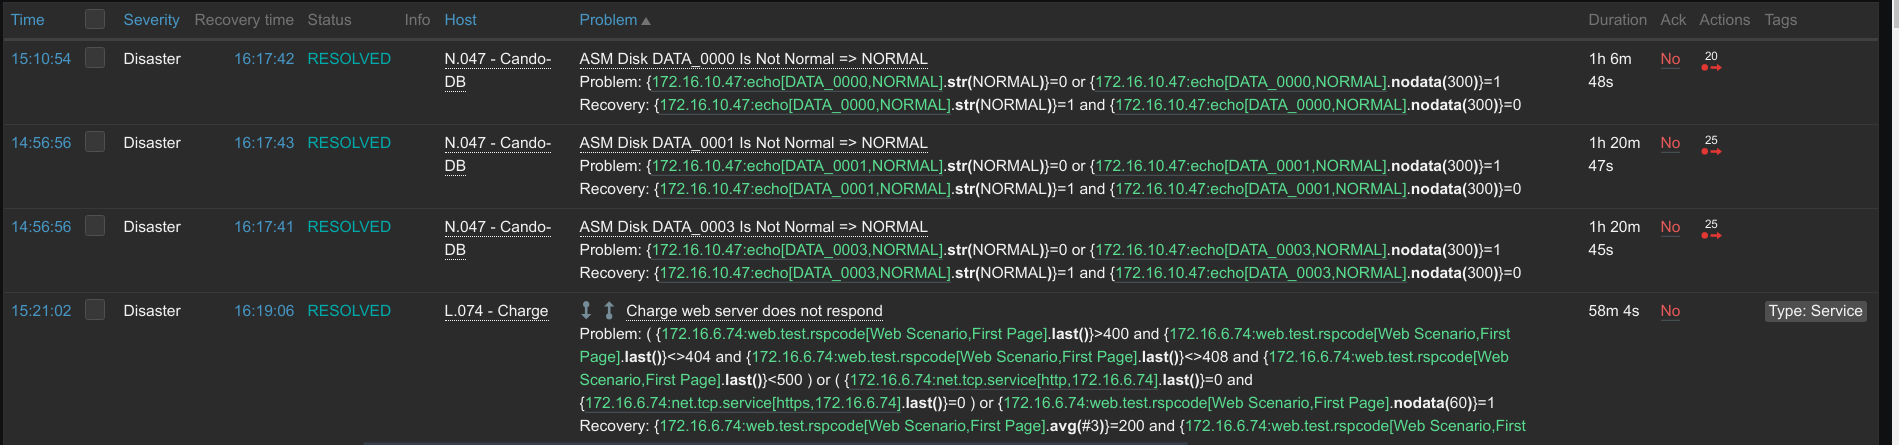
It was really strange until today for me, during those hours zabbix frontend couldn't get items from elasticsearch (or maybe zabbix server, for trigger evaluation, I'm not sure about latter one). Believe me or not, even zabbix[uptime] was missing values, all items were missing values in fact. I even had a trigger on zabbix[uptime] with the following statement:
{Template App Zabbix Server:zabbix[uptime].nodata(120)}=1
and even this one was fired! I believe all network timeouts were happening due to overload and timeout on initializing libcurl, though I'm not sure about this.
One time I fixed this issue with closing all elasticsearch uinit and udbl indices. This time, I brought Elasicsearch down for around 1 min, zabbix server was complaining about it, and then I brought it back. Magic happened again. Issues were being resolved, IO overload was getting fixed, and guess what? Slow queries were being logged in zabbix_server.log, with massive inserts in trends_uint and trends tables (Postgres)!
I believe your trending has problems with both server and frontend, please do something about it...
Until then this is what I do (though irrelevant): I bring uint and udbl back to postgres, override history housekeeping to 7d, increase size of WAL in Postgres, let string and log remain in elastic (better compression, far less checkpoints in Postgres), decrease number of db syncers to one (less overhead on Postgres and Elasticsearch) while increasing zabbix history buffer size and Postgres buffer size, and increase checkpoint timeout in Postgres.
Logs and screenshots are attached.