-
Type:
Problem report
-
Resolution: Fixed
-
Priority:
 Trivial
-
Affects Version/s: 4.0.2, 4.2.0alpha2
-
Component/s: Frontend (F)
-
Sprint 48, Jan 2019, Sprint 49 (Feb 2019)
-
0.25
Steps to reproduce:
- Create a new dashboard;
- Add new classic graph widget and select graph "Zabbix internal process busy %" from Zabbix server graphs;
- Confirm changes and save dashboard;
- Try to zoom in using selection box in graph widget.
Result:
Selection box is only 18px height.
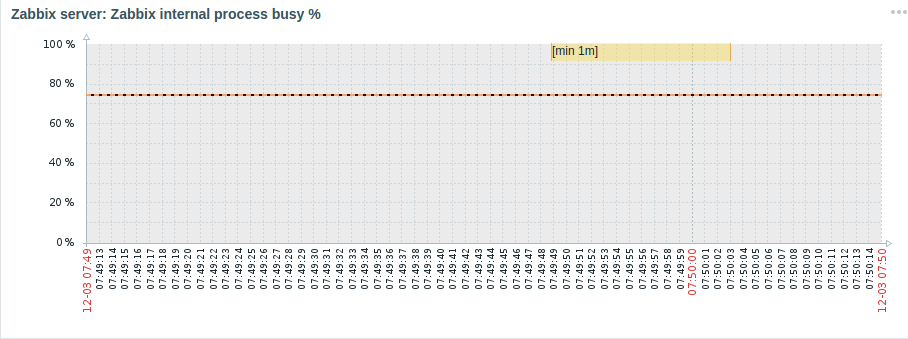
Expected:
Should be equally high as graph.
