-
Type:
Problem report
-
Resolution: Duplicate
-
Priority:
 Trivial
-
None
-
Affects Version/s: 4.0.2
-
Component/s: Frontend (F)
-
None
-
Environment:OS: RHEL 7.4
Frontend: Apache 2.4.6
PHP: 5.4.16
grep -ri php_value /etc/httpd/conf.d/zabbix.conf
php_value mysql.connect_timeout 500
php_value default_socket_timeout 500
php_value max_execution_time 500
php_value memory_limit 8192M
php_value post_max_size 512M
php_value upload_max_filesize 512M
php_value max_input_time 500
php_value always_populate_raw_post_data -1
php_value date.timezone Europe/Rome
Number of hosts (enabled/disabled/templates) 3587 3398 / 26 / 163
Number of items (enabled/disabled/not supported) 486367 448488 / 31339 / 6540
Number of triggers (enabled/disabled [problem/ok]) 201326 197561 / 3765 [1603 / 195958]
Number of users (online) 31 5
Required server performance, new values per second 1965.44
OS: RHEL 7.4 Frontend: Apache 2.4.6 PHP: 5.4.16 grep -ri php_value /etc/httpd/conf.d/zabbix.conf php_value mysql.connect_timeout 500 php_value default_socket_timeout 500 php_value max_execution_time 500 php_value memory_limit 8192M php_value post_max_size 512M php_value upload_max_filesize 512M php_value max_input_time 500 php_value always_populate_raw_post_data -1 php_value date.timezone Europe/Rome Number of hosts (enabled/disabled/templates) 3587 3398 / 26 / 163 Number of items (enabled/disabled/not supported) 486367 448488 / 31339 / 6540 Number of triggers (enabled/disabled [problem/ok]) 201326 197561 / 3765 [1603 / 195958] Number of users (online) 31 5 Required server performance, new values per second 1965.44
Hello,
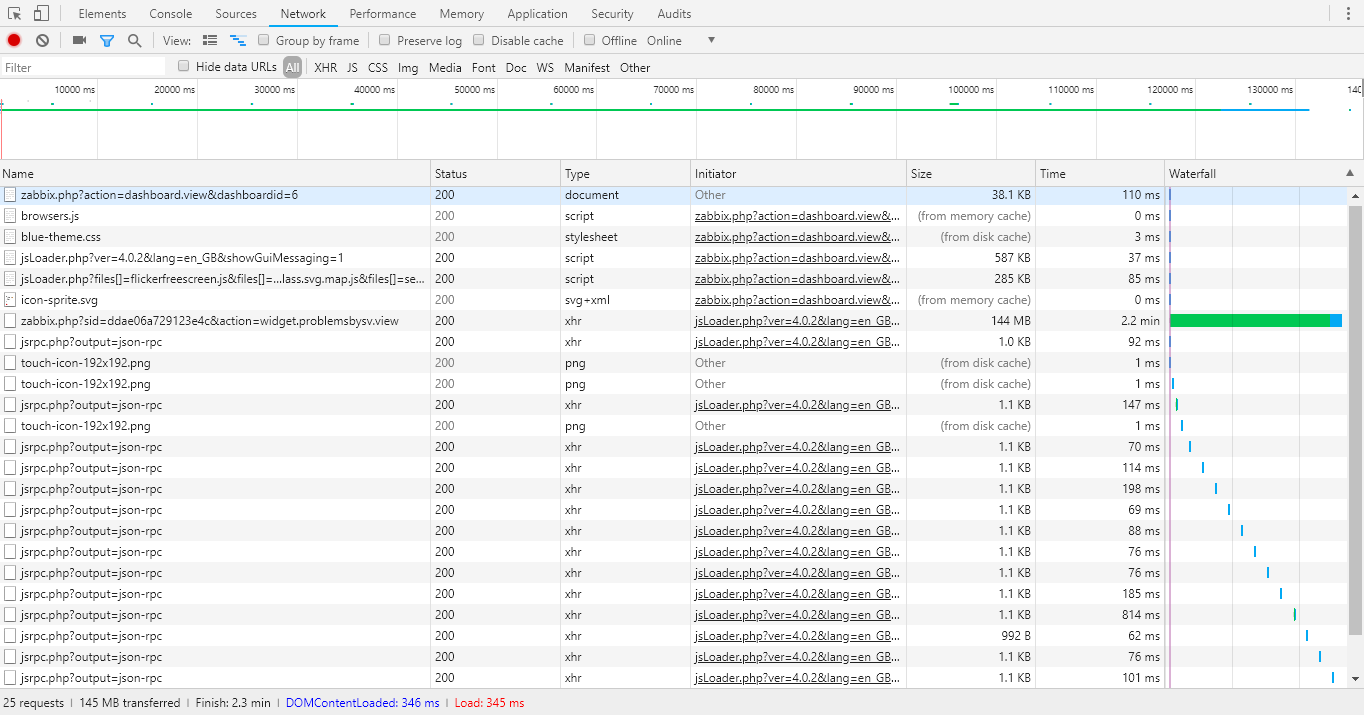
after we upgrade from 3.4.14 to 4.0.1 we have noticed that the widget "problem by severity" takes very long time to load.
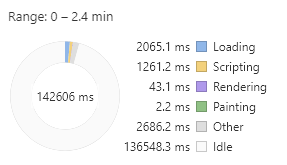
We have done deep checks on systems performance and we haven't found nothing relevant. The CPU, memory and network statistics don't show any spike or overload.
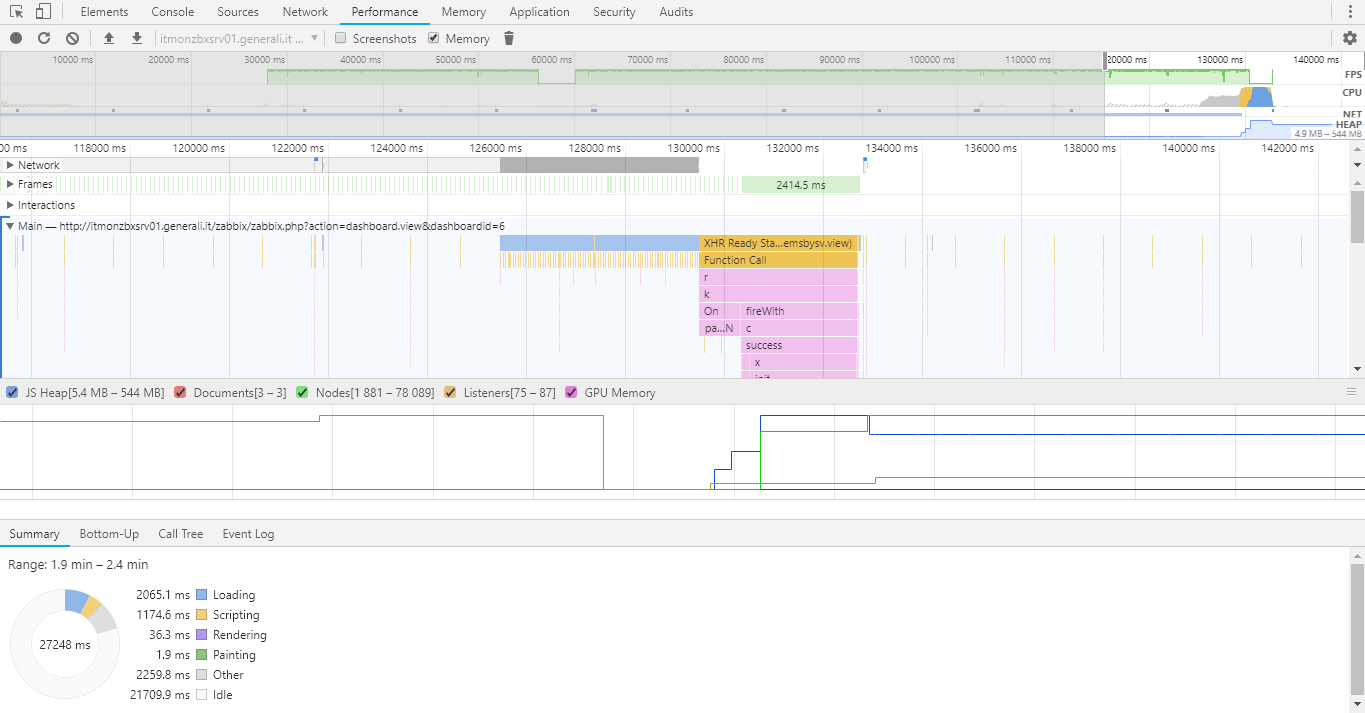
We have performed some analysis on the client browser and we found that it takes about 2 minutes to execute a POST of 144MB. Most of this time the browser is in idle state.
We have tried to create a test dashboard with only the widget "problems by severity" and then load the page with debug mode enabled, the result below:
******************** Script profiler ********************
Total time: 111.188555
Total SQL time: 42.166975
SQL count: 1519 (selects: 1138 | executes: 389)
Peak memory usage: 521M
Memory limit: 8192M
Steps to reproduce:
- Upgrade to 4.0.1
- Login and wait the main dashboard to load
Result:
See screenshot attached
Kind Regards
Vittorio
- duplicates
-
-

- Closed
-