-
Type:
Problem report
-
Resolution: Unresolved
-
Priority:
 Trivial
-
None
-
Affects Version/s: 4.2.0alpha2
-
Component/s: Frontend (F)
On Y axis minimum step range is 0.2, it's not enough for item values with 2 and 3 digits after decimal point.
(1) two digits after decimal point
Steps to reproduce: Send different values on trapper from 2.68 till 2.78 (two digits after point)
Result: graph line is between 2.6 and 2.8, without tooltip isn't clear which exactly value is on graph. On the classic graph Y axis step is 0.02 and the item values are clearly visible
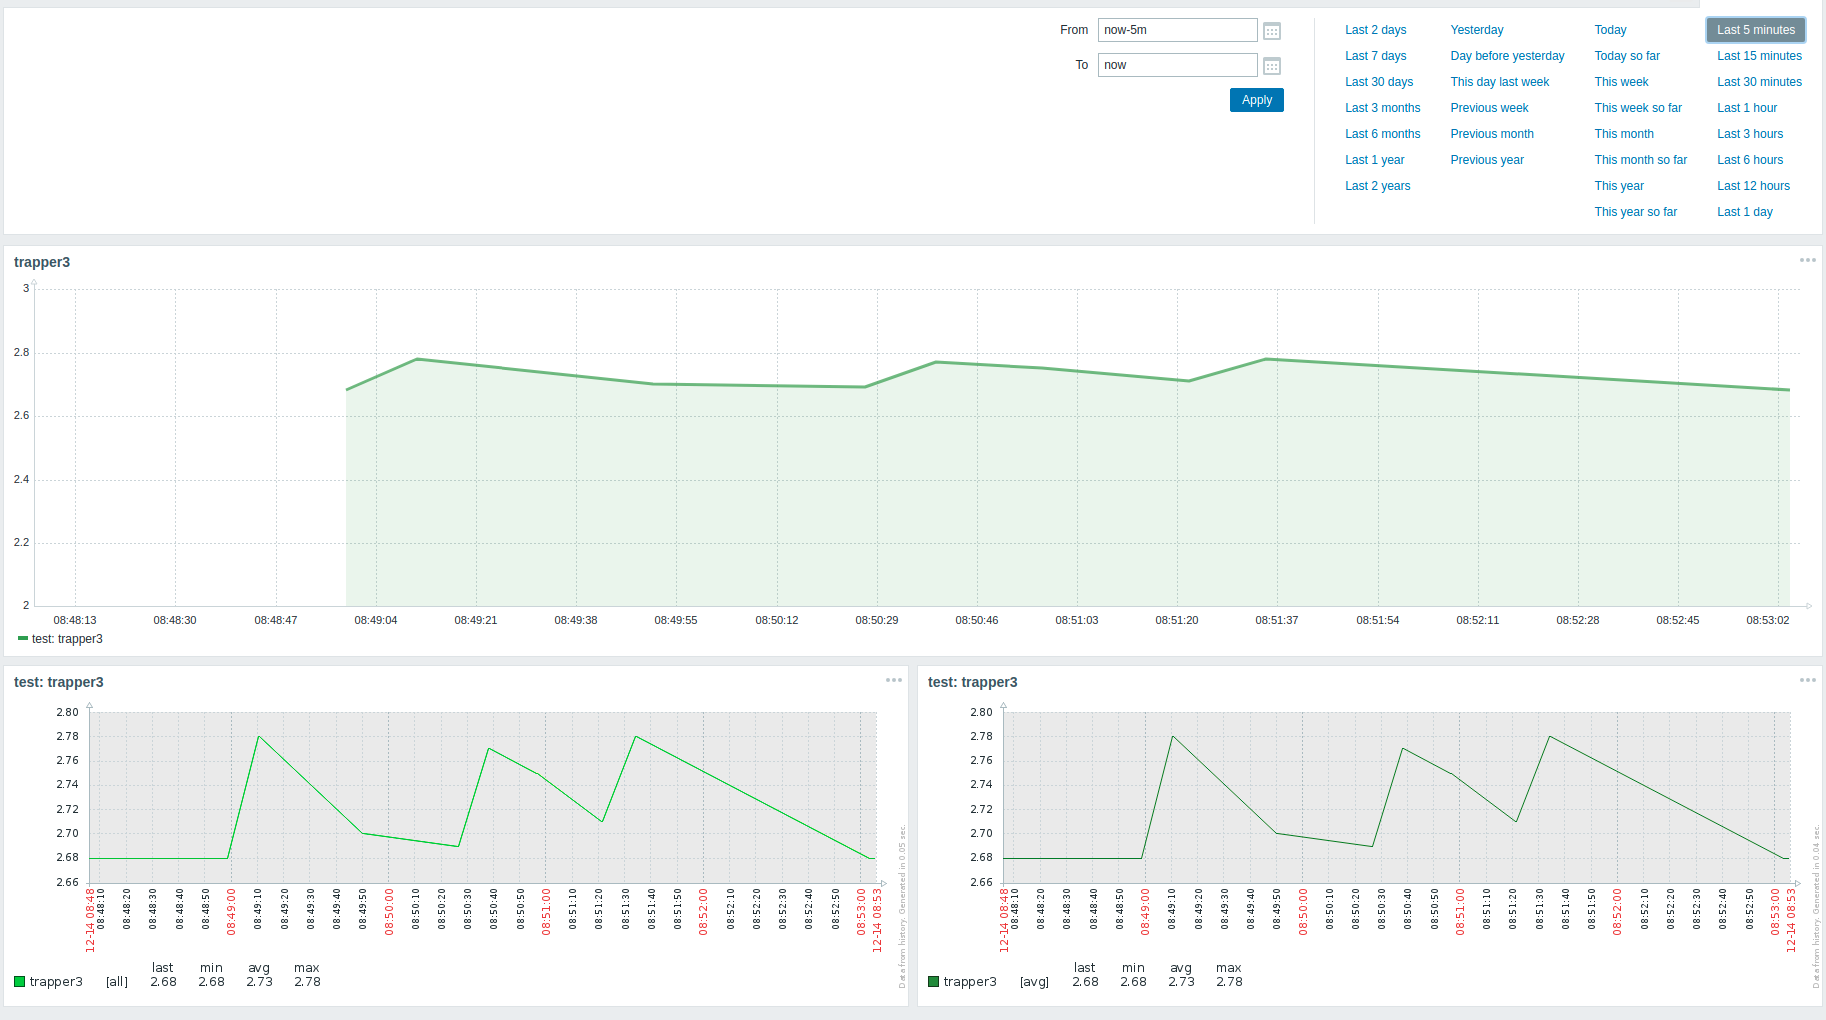
Expected: Y axis step range is 0.0.2
(2) three digits after point
Steps to reproduce: Send different values on trapper from 2.780 till 2.790 (three digits after point)
Result: in tooltip are two digits after point and on graph almost straight line
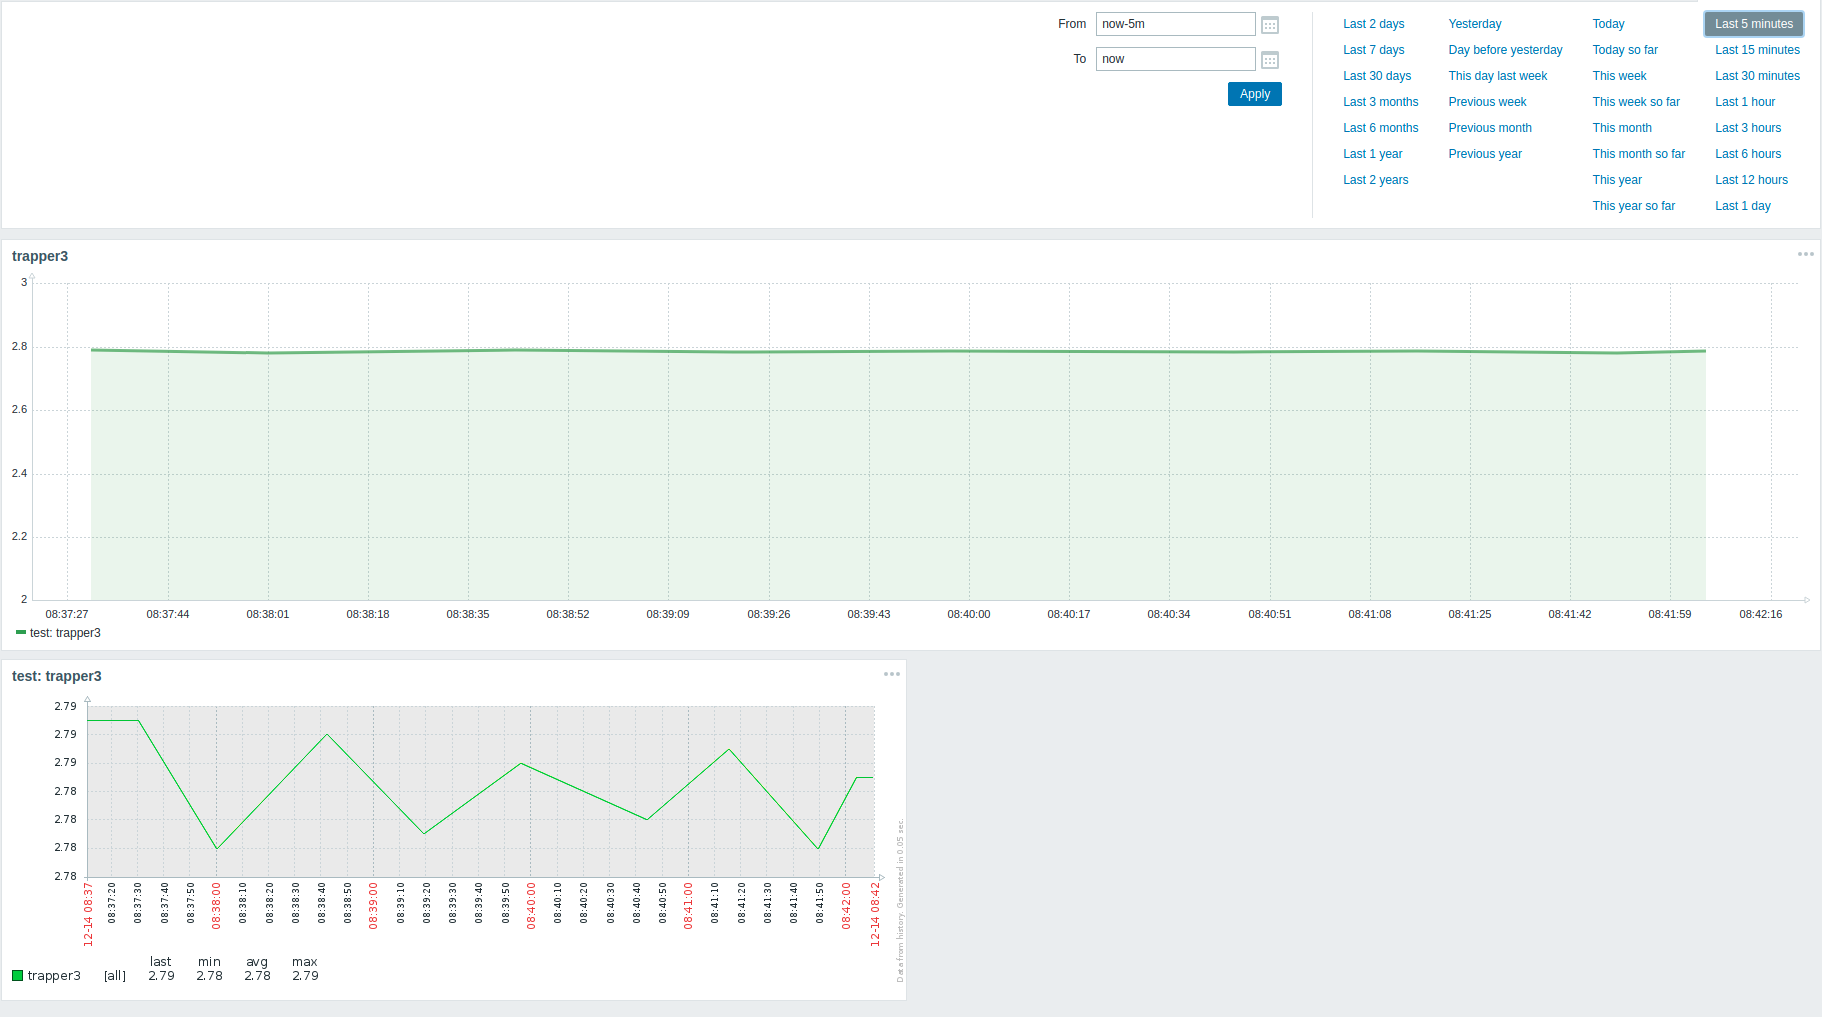
Expected: in tooltip three digits after point and more clearer line on the graph
(3) Can't set float number for min and max values of Y axis
Steps to reproduce:
- Go to widget configuration tab Axes
- Set min 5.6 and max 7.4
Result: on graph Y axis min 5 and max 8
Expected: min 5.6 and max 7.4

