-
Type:
Problem report
-
Resolution: Fixed
-
Priority:
 Minor
Minor
-
None
-
Affects Version/s: 4.0.5
-
Component/s: None
-
None
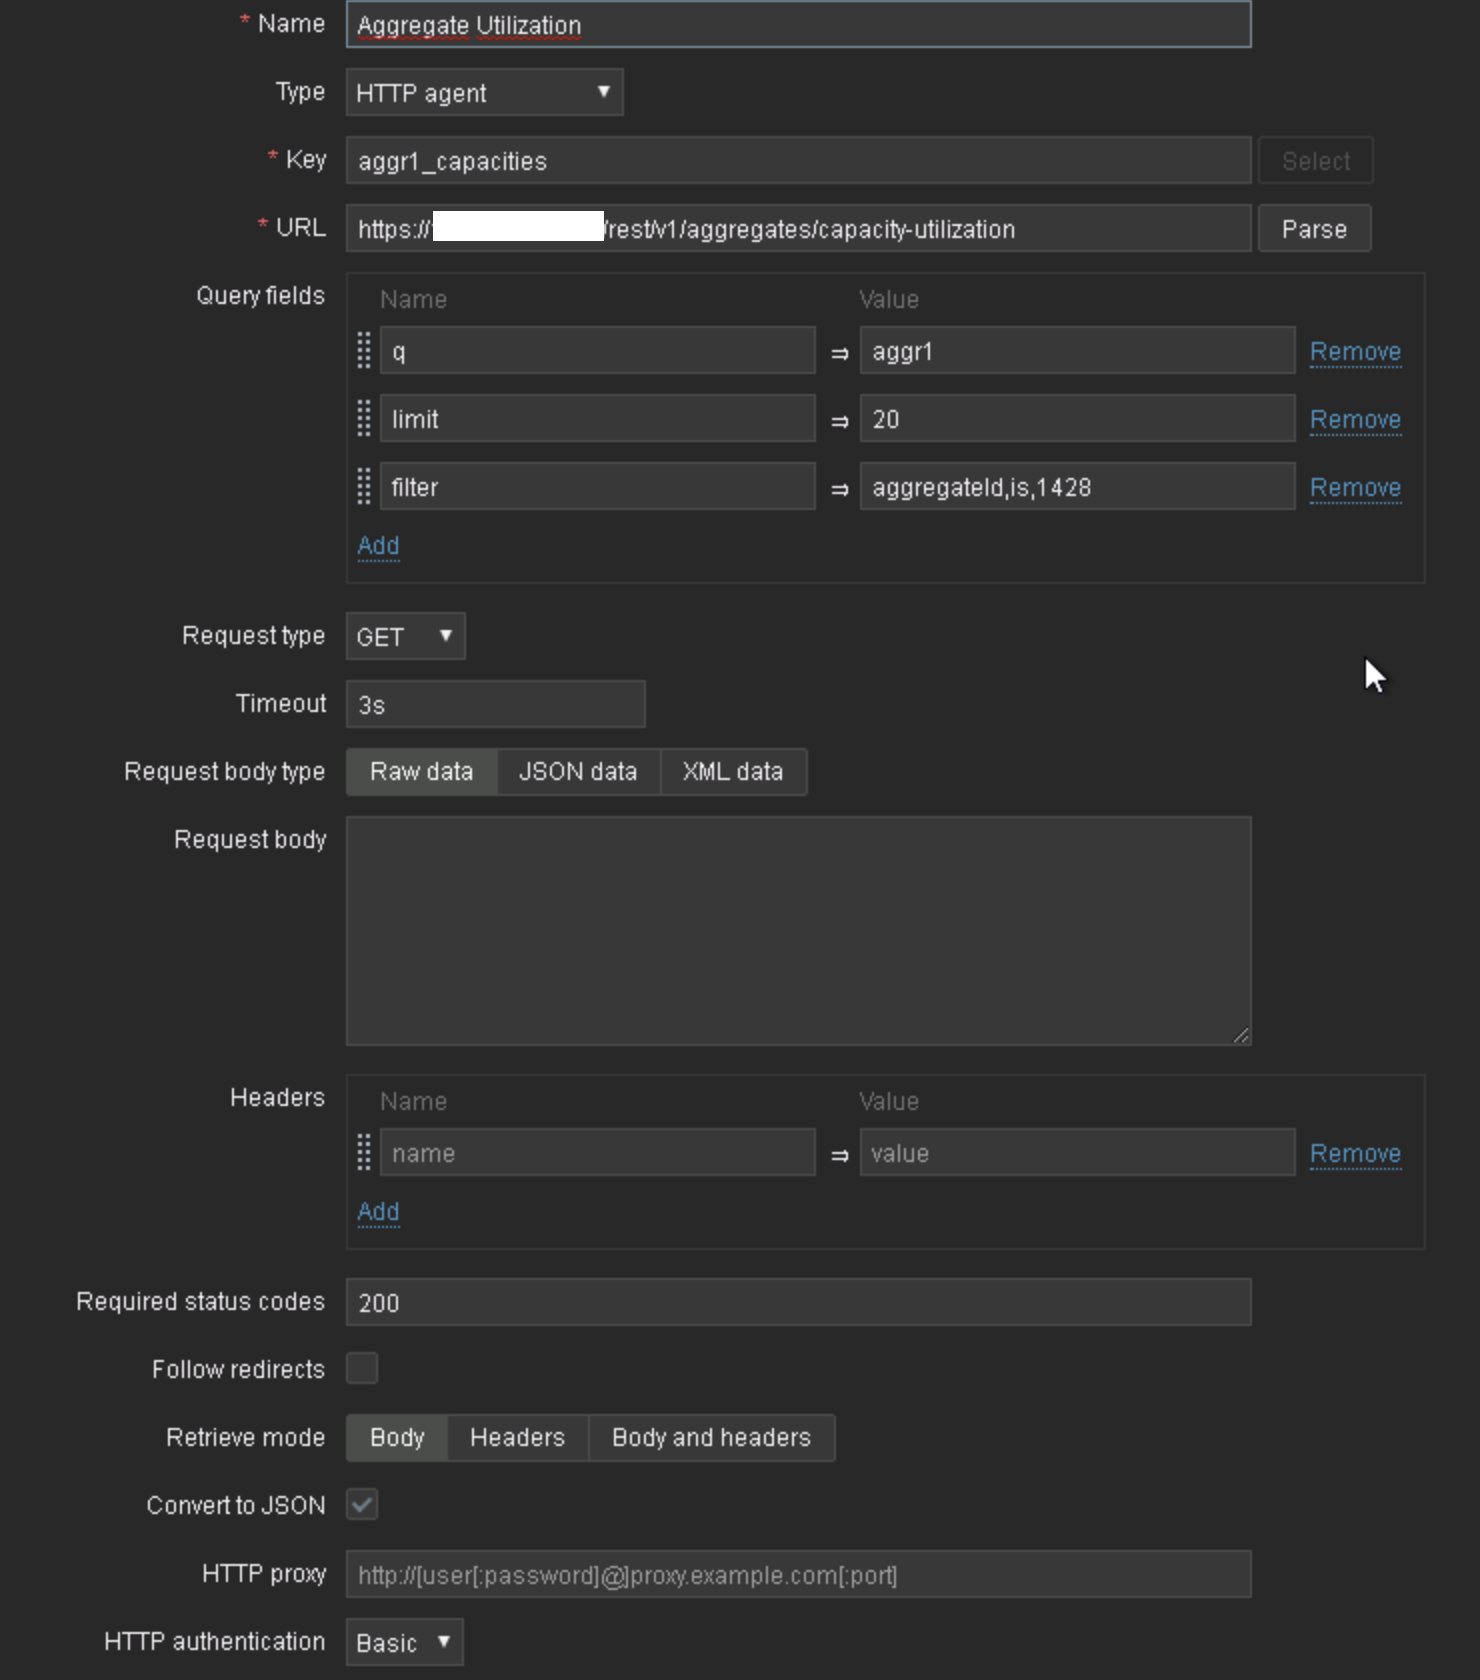
I'd like to use HTTP agent item to monitor "availableDataPercentage" from the http GET call. I selected "convert to JSON" and this is the output I'm getting (Monitoring->Latest Data):
\{"body":"\{\"_embedded\":\{\"netapp:aggregateCapacityAndUtilizationList\":[\{\"node\":\{\"id\":1385,\"label\":\"mynetapp\",\"unsupportedStatisticTypes\":[]},\"usedDataCapacity\":141.31,\"usedDataPercentage\":0.22,\"availableDataCapacity\":62740.31,\"availableDataPercentage\":99.78,\"dailyGrowthRatePercentage\":0.05,\"snapshotReserveUsedPercentage\":0.0,\"snapshotReserveAvailableCapacity\":3309.56,\"snapshotReserveAvailablePercentage\":100.0,\"snapshotReserveTotalCapacity\":3309.56,\"snapshotCopiesReserveFullThresholdPercentage\":\"90\",\"totalCommitted\":225623.0,\"growthRateSensitivityThreshold\":\"2.0\",\"growthRateThresholdPercentage\":\"1\",\"spaceFullThresholdPercentage\":\"90\",\"spaceNearlyFullThresholdPercentage\":\"80\",\"overcommittedCapacityPercentage\":258.81,\"overcommittedThresholdPercentage\":\"100\",\"nearlyOvercommittedThresholdPercentage\":\"95\",\"daysUntilFullThreshold\":\"7\",\"externalCapacityTierSpaceUsed\":0.0,\"externalCapacityTier\":null,\"aggregateType\":\"SSD\",\"snapLockType\":\"Non-Snaplock\",\"totalDataCapacity\":62881.62,\"snapshotReserveUsedCapacity\":0.0,\"aggregateState\":\"Online\",\"daysToFull\":1954,\"aggregate\":\{\"id\":1428,\"label\":\"aggr1\",\"unsupportedStatisticTypes\":[]},\"raidType\":\"RAID-DP\",\"cluster\":\{\"id\":1220,\"label\":\"mycluster\",\"unsupportedStatisticTypes\":[]},\"haPair\":\"netappnode-01/netappnode-02\",\"resourceKey\":\"a89eed0b-18a5-11e9-b726-00c128ed1b00:type=aggregate,uuid=861990f9-cd01-47a2-a56e-ec98ab40f005\"}]},\"_links\":\{\"self\":\{\"href\":\"https://10.240.138.241/rest/aggregates/capacity-utilization\"},\"curies\":[\{\"href\":\"https://100.100.100.150/rest/\{#rel}\",\"name\":\"netapp\",\"templated\":true}]},\"totalCount\":1}"}
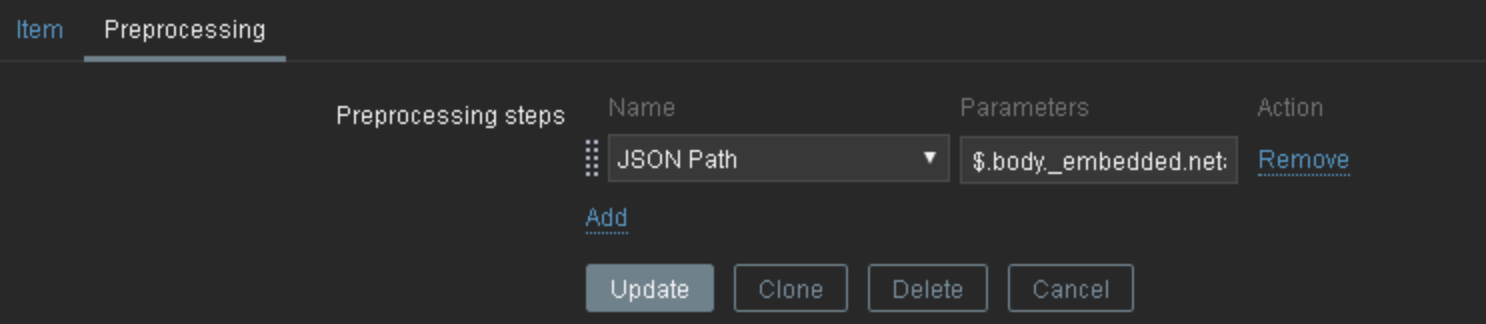
When I try to use preprocessing to be able to monitor a specific value (in this case availableDataPercentage) the query doesn't work (see attached screenshots).
$.body._embedded.netapp:aggregateCapacityAndUtilizationList[0].usedDataPercentage
Here's the output from Latest Data without "Convert to JSON" option checked:
\{\"_embedded\":\{\"netapp:aggregateCapacityAndUtilizationList\":[\{\"node\":\{\"id\":1385,\"label\":\"mynetapp\",\"unsupportedStatisticTypes\":[]},\"usedDataCapacity\":141.31,\"usedDataPercentage\":0.22,\"availableDataCapacity\":62740.31,\"availableDataPercentage\":99.78,\"dailyGrowthRatePercentage\":0.05,\"snapshotReserveUsedPercentage\":0.0,\"snapshotReserveAvailableCapacity\":3309.56,\"snapshotReserveAvailablePercentage\":100.0,\"snapshotReserveTotalCapacity\":3309.56,\"snapshotCopiesReserveFullThresholdPercentage\":\"90\",\"totalCommitted\":225623.0,\"growthRateSensitivityThreshold\":\"2.0\",\"growthRateThresholdPercentage\":\"1\",\"spaceFullThresholdPercentage\":\"90\",\"spaceNearlyFullThresholdPercentage\":\"80\",\"overcommittedCapacityPercentage\":258.81,\"overcommittedThresholdPercentage\":\"100\",\"nearlyOvercommittedThresholdPercentage\":\"95\",\"daysUntilFullThreshold\":\"7\",\"externalCapacityTierSpaceUsed\":0.0,\"externalCapacityTier\":null,\"aggregateType\":\"SSD\",\"snapLockType\":\"Non-Snaplock\",\"totalDataCapacity\":62881.62,\"snapshotReserveUsedCapacity\":0.0,\"aggregateState\":\"Online\",\"daysToFull\":1954,\"aggregate\":\{\"id\":1428,\"label\":\"aggr1\",\"unsupportedStatisticTypes\":[]},\"raidType\":\"RAID-DP\",\"cluster\":\{\"id\":1220,\"label\":\"mycluster\",\"unsupportedStatisticTypes\":[]},\"haPair\":\"netappnode-01/netappnode-02\",\"resourceKey\":\"a89eed0b-18a5-11e9-b726-00c128ed1b00:type=aggregate,uuid=861990f9-cd01-47a2-a56e-ec98ab40f005\"}]},\"_links\":\{\"self\":\{\"href\":\"https://10.240.138.241/rest/aggregates/capacity-utilization\"},\"curies\":[\{\"href\":\"https://100.100.100.150/rest/\{#rel}\",\"name\":\"netapp\",\"templated\":true}]},\"totalCount\":1}