-
Type:
Incident report
-
Resolution: Incomplete
-
Priority:
 Trivial
-
None
-
Affects Version/s: 4.2.3
-
Component/s: Server (S)
-
Environment:Zabbix Server (RHEL 7.6), AWS EC2 c4.xlarge
Zabbix frontend (RHEL 7.6), AWS EC2 m4.large
Zabbix DB: AWS RDS (MariaDB 10.0.24), db.m4.xlarge
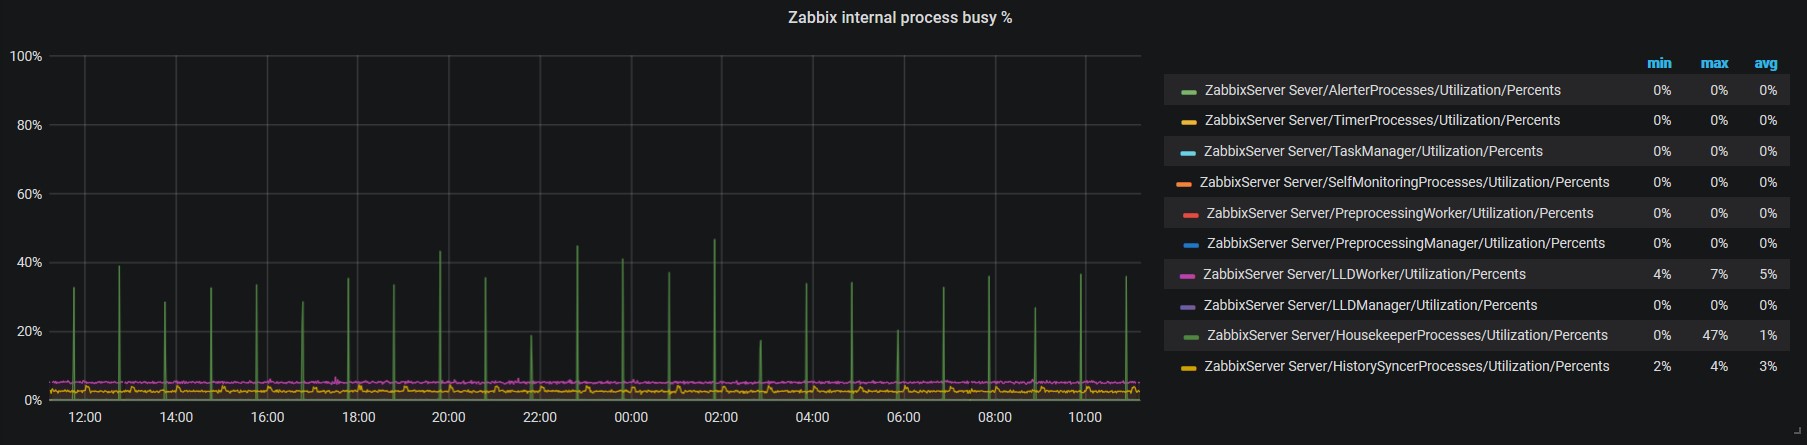
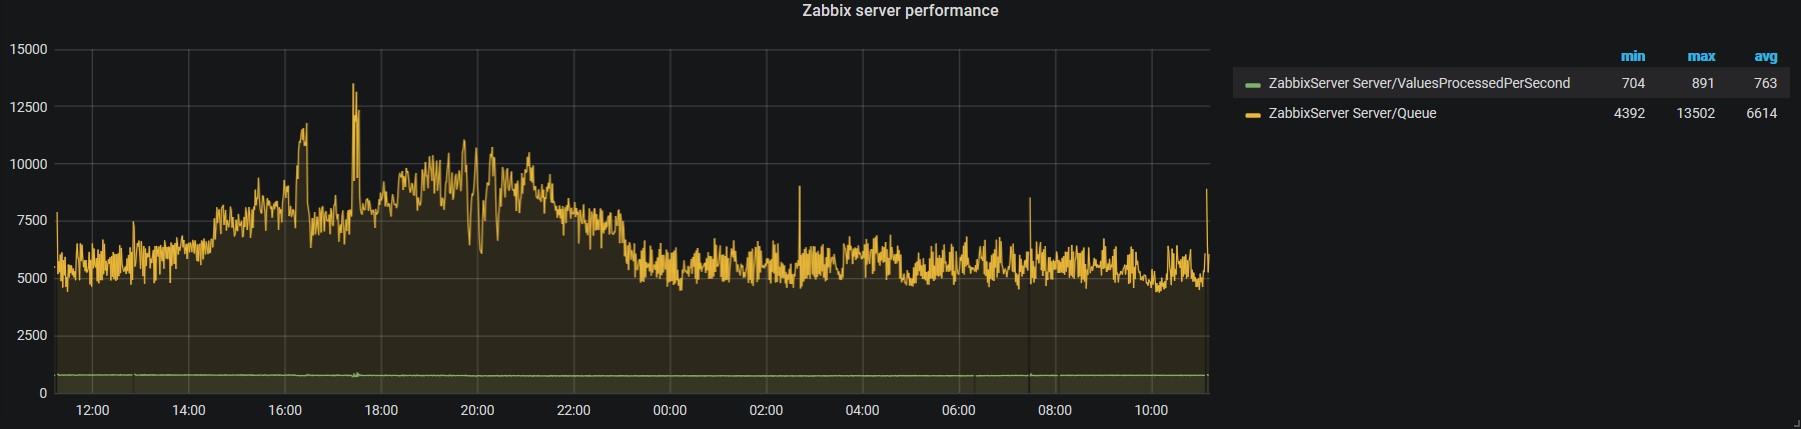
Server info:
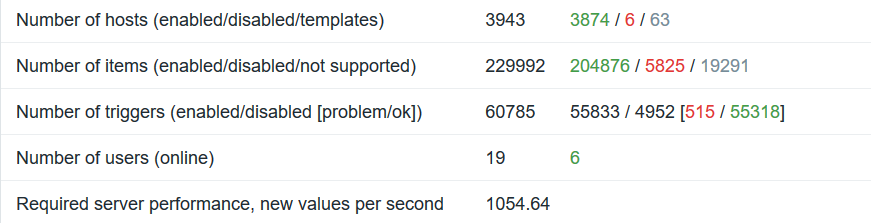
Incident details:
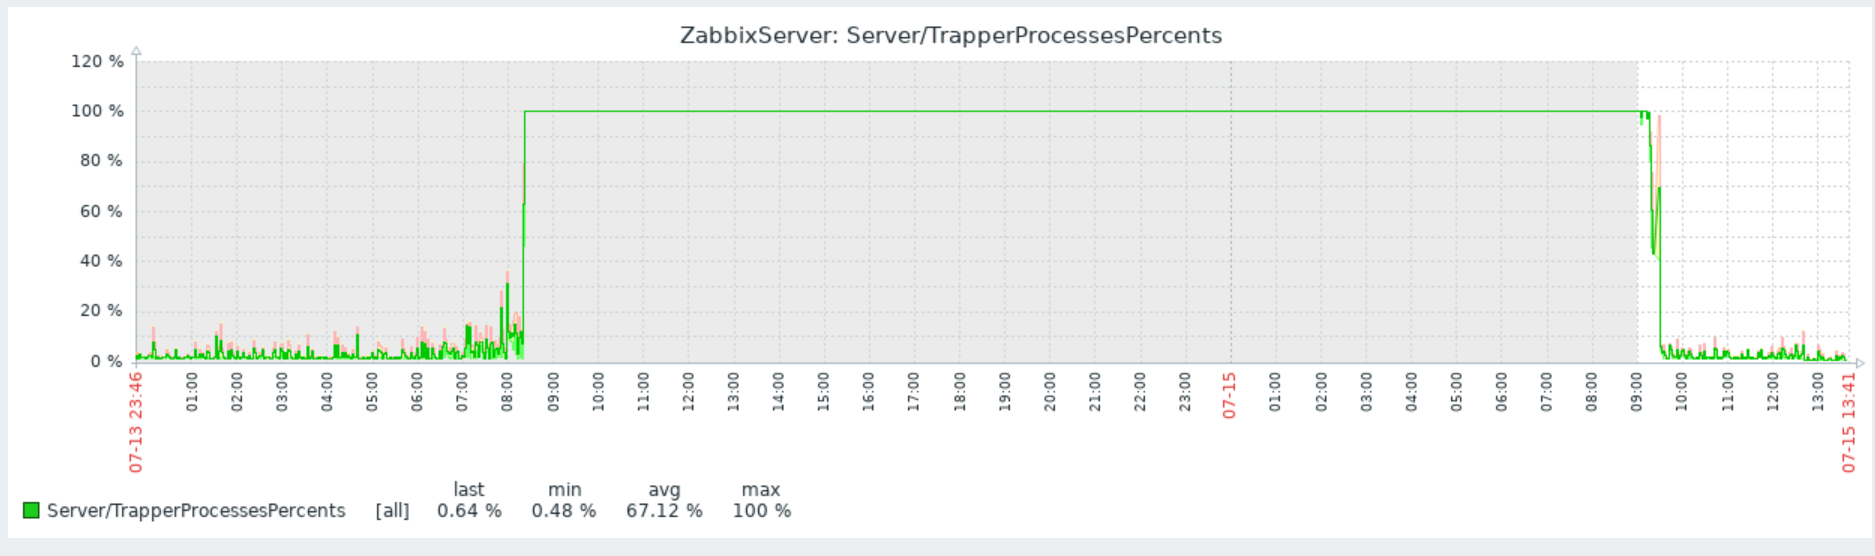
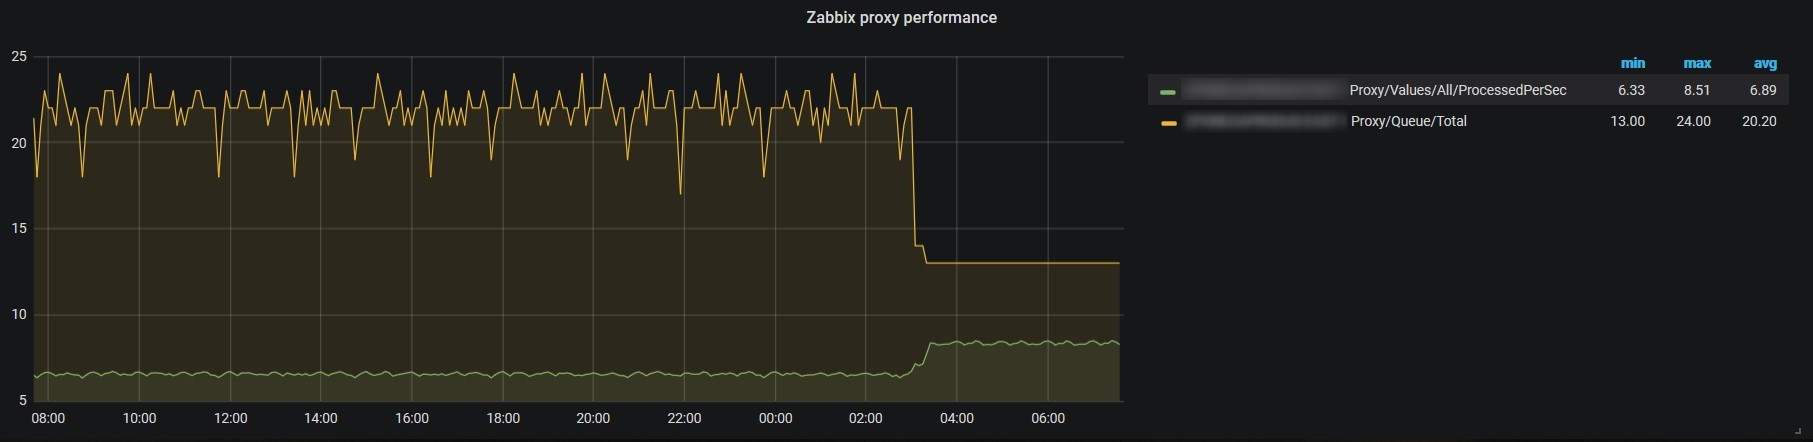
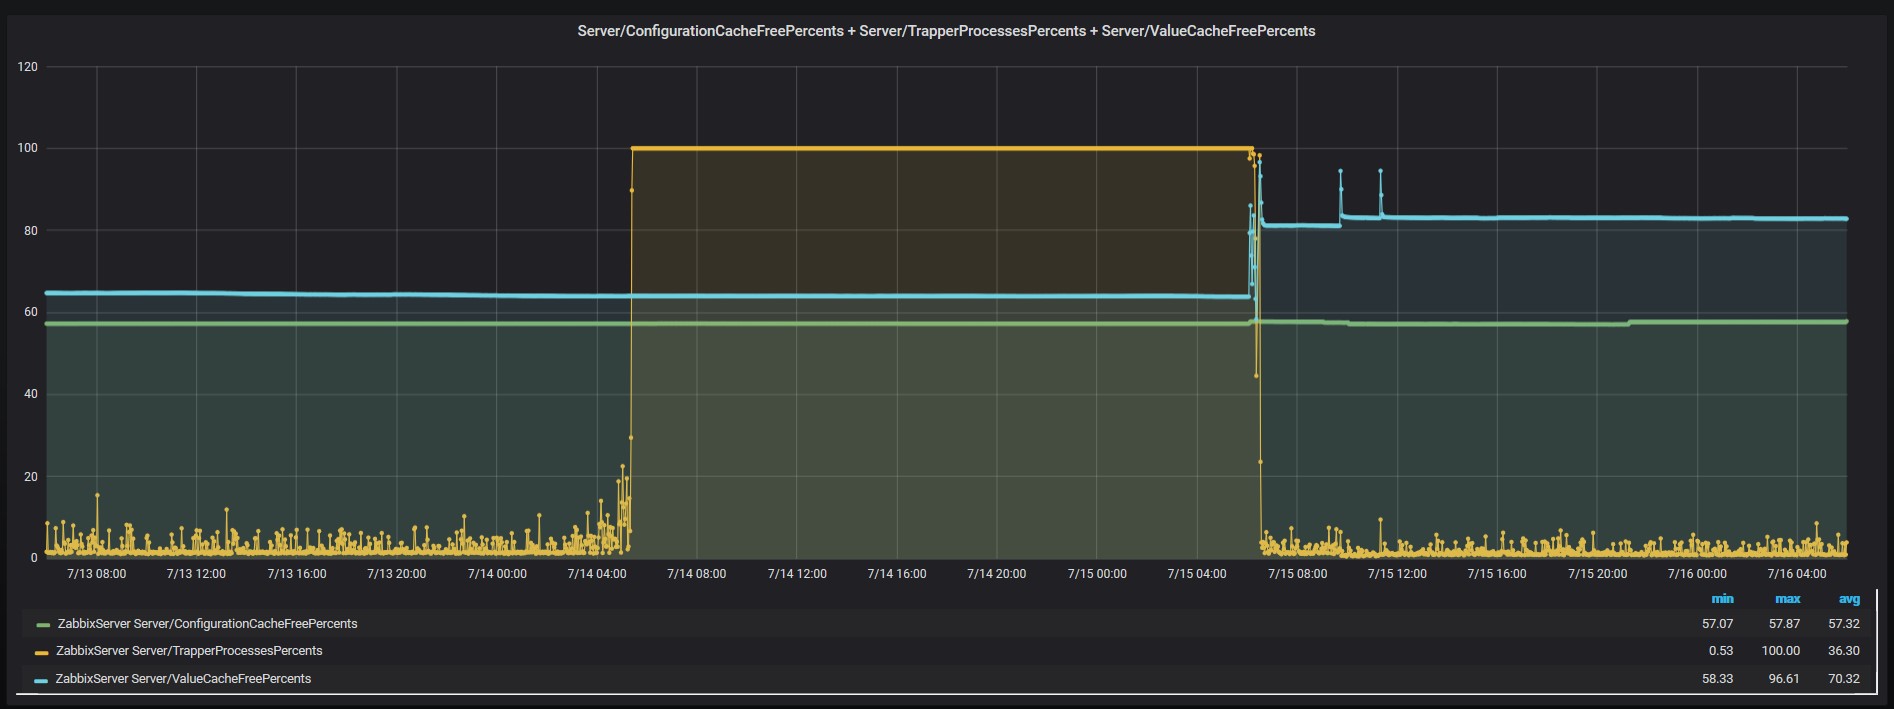
- Zabbix server trapper busy processes increased significantly from its typical value (~1-3%) to 100%.

- Zabbix proxies cannot connect to Zabbix server. Zabbix_proxy.log contains the following lines:
10957:20190714:052308.169 received configuration data from server at "*******", datalen 426293
 10958:20190714:052602.513 cannot send heartbeat message to server at "*******": ZBX_TCP_READ() timed out
 10958:20190714:052702.517 cannot send heartbeat message to server at "*******": ZBX_TCP_READ() timed out
 10958:20190714:052802.520 cannot send heartbeat message to server at "*******": ZBX_TCP_READ() timed out
 10958:20190714:052902.523 cannot send heartbeat message to server at "*******": ZBX_TCP_READ() timed out
 10958:20190714:053002.526 cannot send heartbeat message to server at "*******": ZBX_TCP_READ() timed out
 10958:20190714:053102.529 cannot send heartbeat message to server at "*******": ZBX_TCP_READ() timed out
Agents that are monitored by Zabbix server itself stay green and data is being collected. Zabbix server logs contains no suspicious records, just info about items that became unsupported.
The environment stays in that condition for several hours and Zabbix server starts receiving data from Zabbix proxies only after a reboot via
# systemctl restart zabbix-server
Proxy log:
10959:20190715:061449.816 Unable to connect to the server [******************]:10051 [cannot connect to [[******************]:10051]: [111] Connection refused]. Will retry every 1 second(s)
 10959:20190715:061455.824 Connection restored.
 10957:20190715:061824.192 received configuration data from server at "******************", datalen 426293
 10960:20190715:062122.585 executing housekeeper
It could be related to network issues, but we couldn't find any evidences.
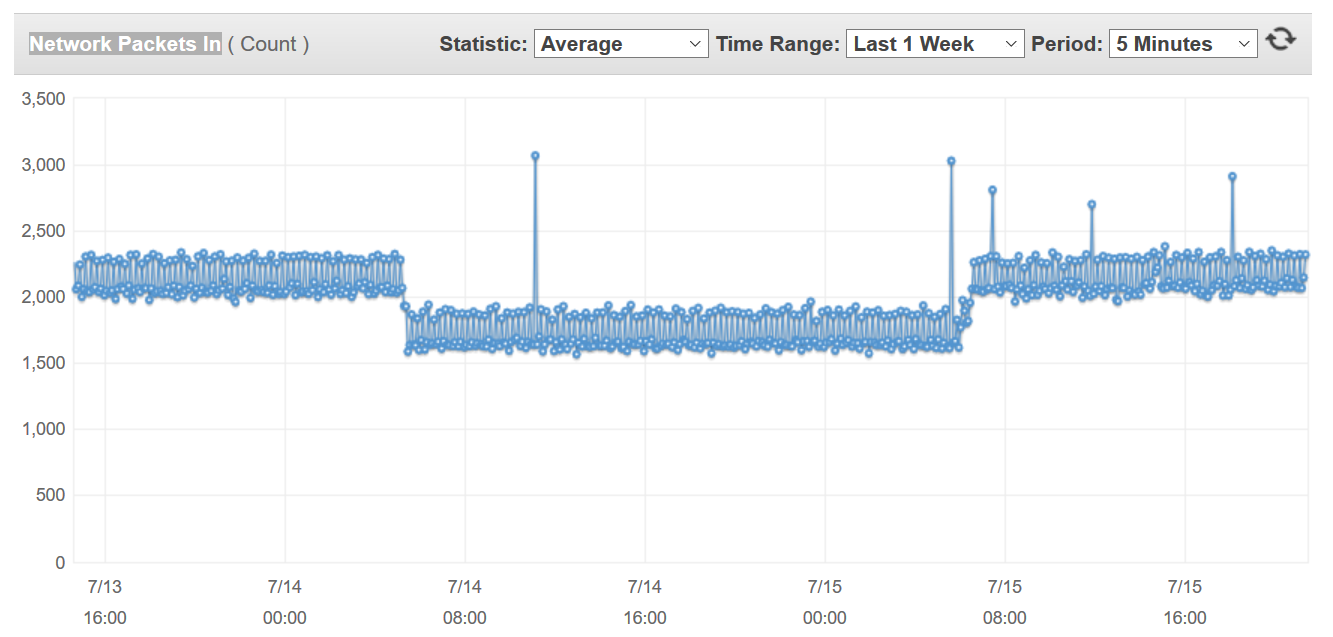
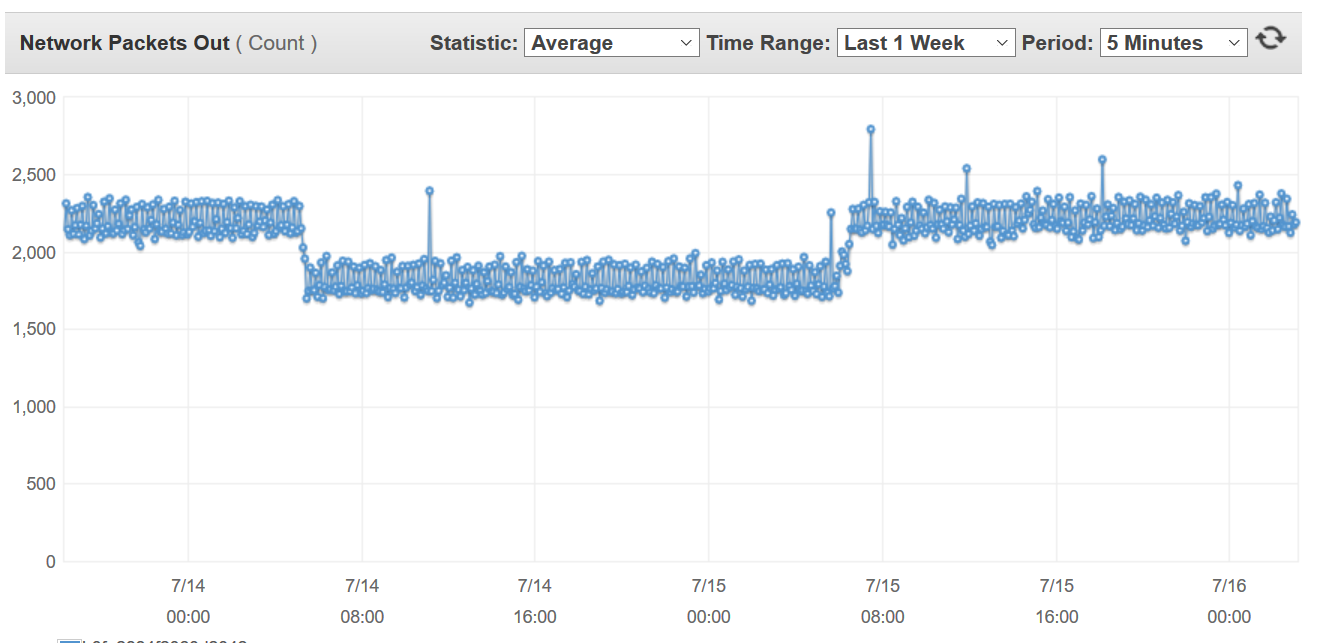
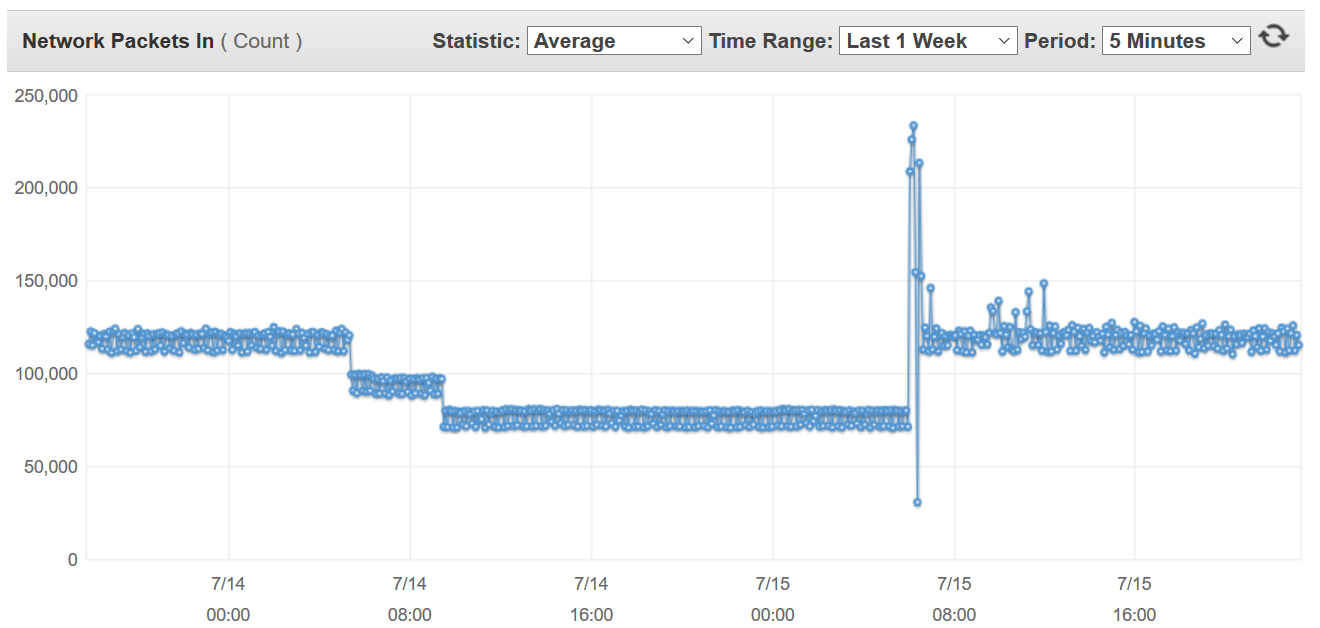
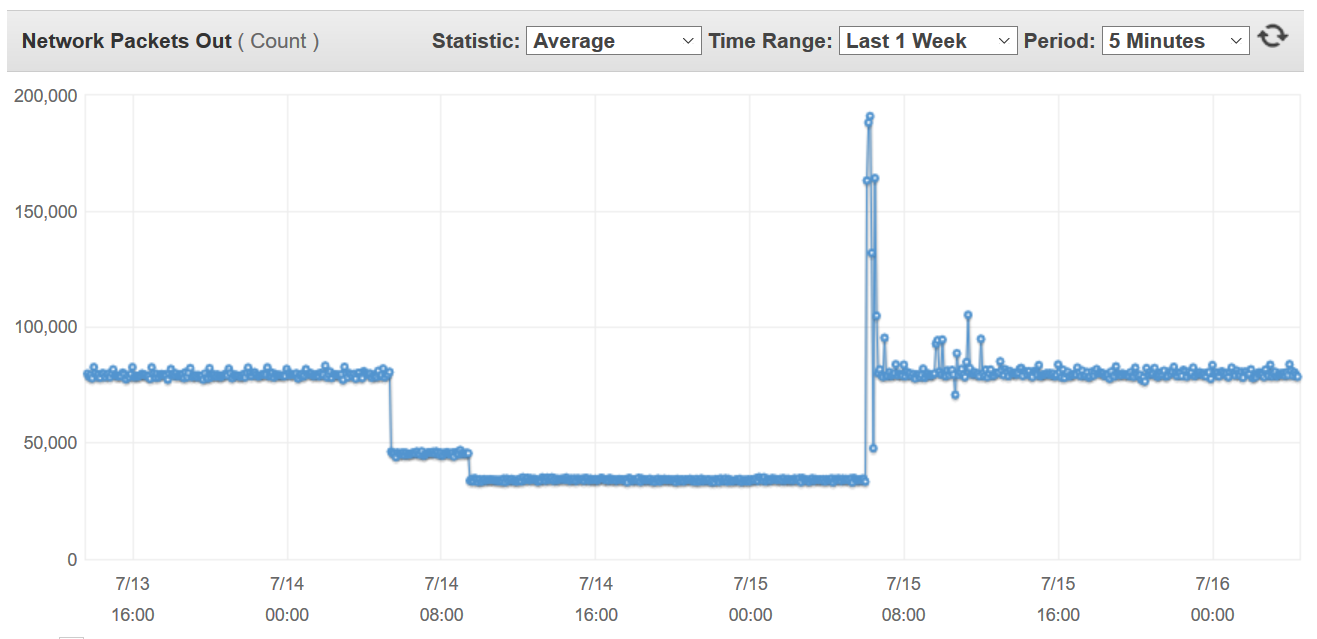
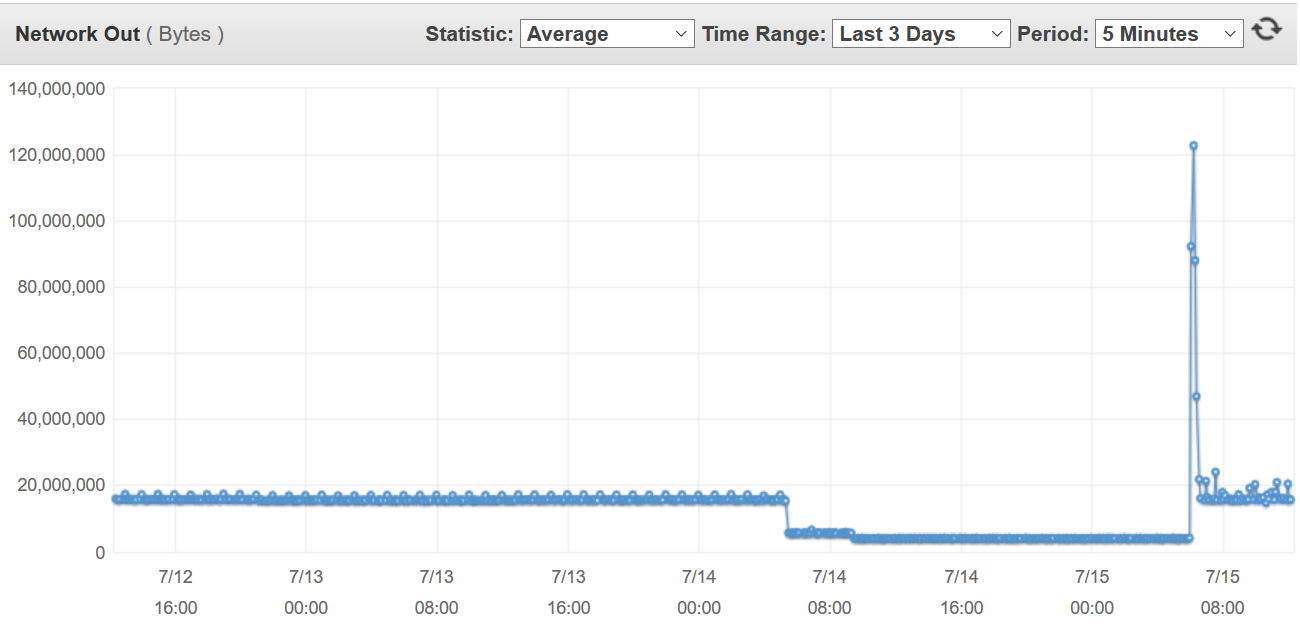
Network traffic on Zabbix server:
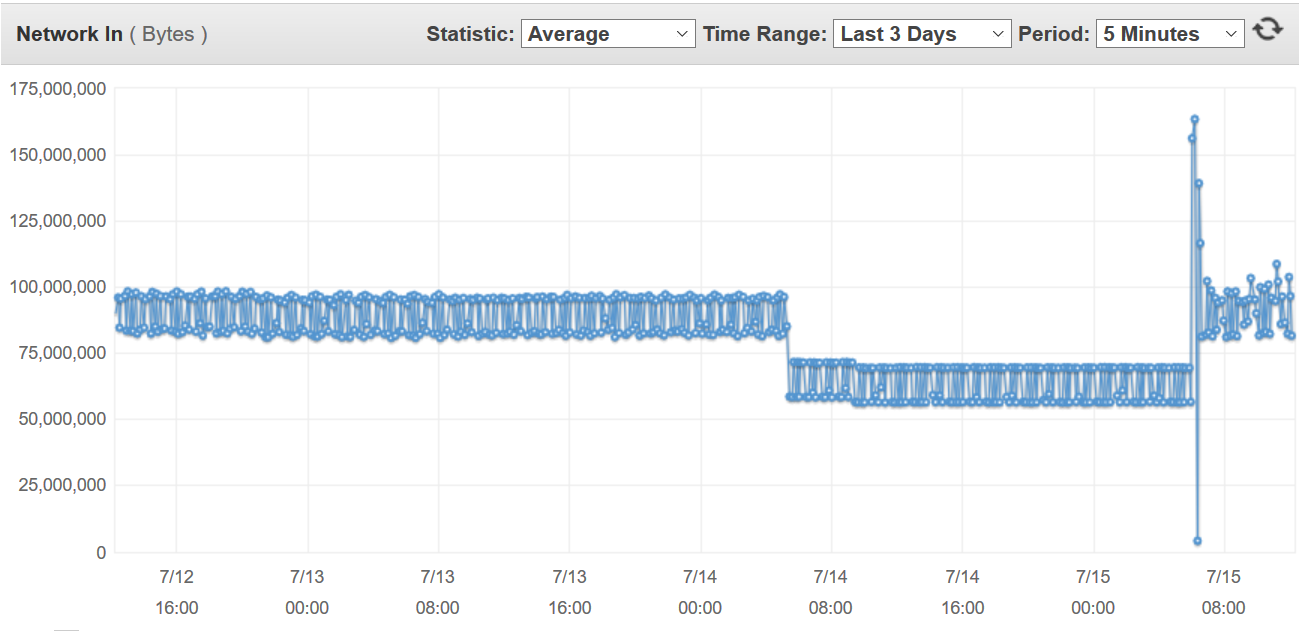
It's unclear for me why Zabbix trappers suddenly increased to 100% and stuck at that value because TrapperTimeout=15 should prevent trappers from hanging. Could you please tell me what do you think about this situation? I would like to prevent such situation in the future, so maybe you'll point me at where else should I look in order to investigate this incident properly.
Full config:
zabbix_server.conf![]()