SVG graph conditionaly looses min/max Y axis

XMLWordPrintable

    • Type: Incident report
    • Resolution: Unresolved
    • Priority: Trivial
    • None
    • Affects Version/s: 4.4.3
    • Component/s: Frontend (F)

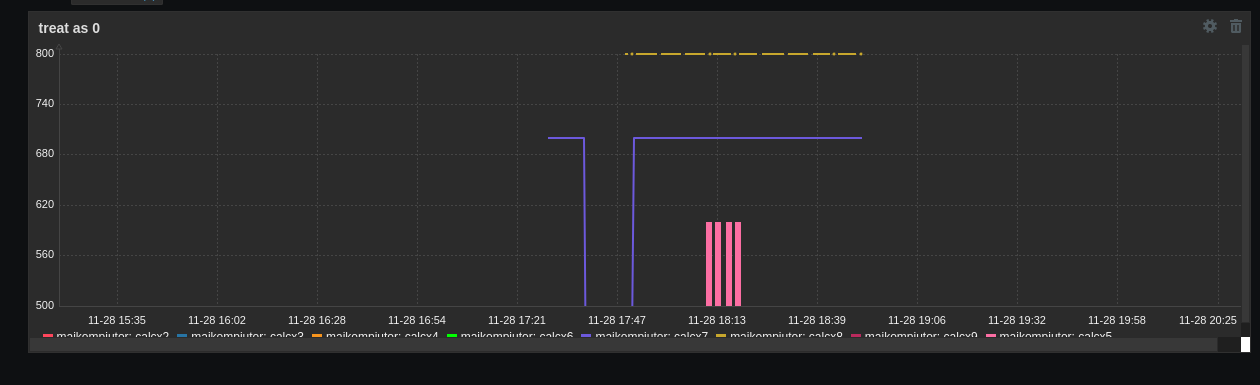
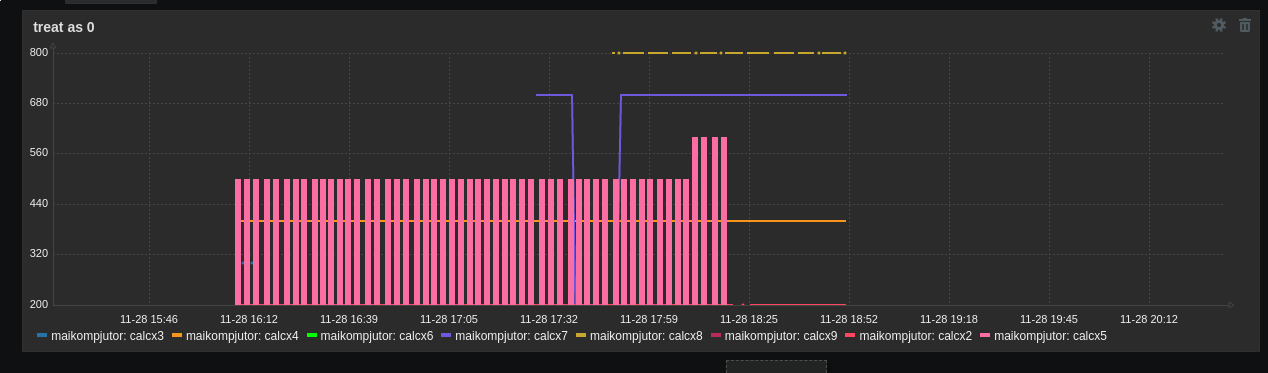
      If "Bar" type dataset is ordered first - no issues, then reorder it as last - Y axis got incorrect min/max.
      Issue seems to originate in addMetrics method for datasets that follows one empty dataset.

       ⇒ 

        1. 21_2.png
          21_2.png
          26 kB
        2. 21_1.png
          21_1.png
          26 kB

            Assignee:
            Zabbix Development Team
            Reporter:
            Mārtiņš Tālbergs (Inactive)
            Votes:
            0 Vote for this issue
            Watchers:
            0 Start watching this issue

              Created:
              Updated: