-
Type:
Problem report
-
Resolution: Unresolved
-
Priority:
Trivial
-
None
-
Affects Version/s: 4.0.15
-
Component/s: Frontend (F)
Preamble
The problem reported through this ticket is very similar to the ZBX-12821 problem which has been fixed more than a year ago.
Context
Zabbix version 4.0.15. Google Chrome version 79.0.3945.117. Firefox version 68.3.0.
A Zabbix server monitors around 40 hosts. Around 30 of these hosts are shut down which is producing around 30 "Unavailable by ICMP Ping" problems.
A dashboard is configured and composed of: a map widget, a map navigation tree widget, a problems widget and 2 graph widgets.
The frond-end Zabbix web interface can be reached from the hosts monitored by the Zabbix server.
Steps to reproduce:
- From a first host: open the Google Chrome web browser, access to the Zabbix web interface, let 1 tab over the dashboard and open 5 tabs over the Monitoring/Problems page.
- Let it go for couple of hours (in this case around 18 hours)
- From a second host: open the Firefox web browser, access to the Zabbix web interface, let 1 tab over the dashboard and open 5 tabs over the Monitoring/Problems page.
- Let it go for couple of hours (in this case around 18 hours)
Result:
For both hosts, the memory utilization increases till reaching very high values (see attached screenshot). The memory utilization is calculated for each host by the Zabbix server comparing UCD-SNMP-MIB:memAvailReal and UCD-SNMP-MIB:memTotalReal.
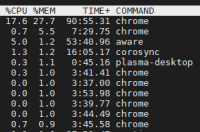
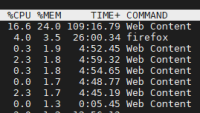
The memory utilization can also be checked using the top command on both hosts (see attached screenshots). We observe that chrome and firefox/Web Content processes generate most of the memory utilization.
The memory can be released by closing the web browsers on each host.
Expected:
No memory leak.


