-
Type:
Problem report
-
Resolution: Duplicate
-
Priority:
 Trivial
-
Affects Version/s: 4.4.4
-
Component/s: Frontend (F)
-
None
-
Environment:Firefox Browser
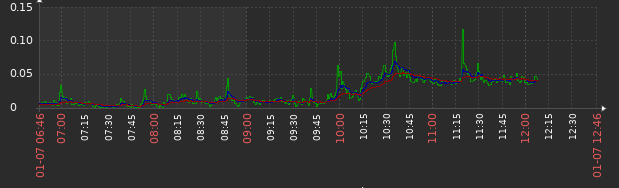
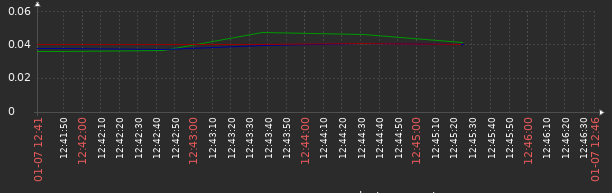
Since the update from version 3 to 4.4.4, the graphs are not shown correctly. The last part seems to be cut off, while the data is there. The cutted graph portion changes when the time scale is changed. If you zoom in, more of the latest data is shown.
See screenshots. They are both from the same graph at the same time but with different time scale.
- duplicates
-
-

- Closed
-