-
Type:
Problem report
-
Resolution: Fixed
-
Priority:
Trivial
-
Affects Version/s: 5.0.0
-
Component/s: Frontend (F)
-
None
-
Environment:centos 7
zabbix 5.0
-
Sprint 84 (Jan 2022), Sprint 85 (Feb 2022), Sprint 86 (Mar 2022), Sprint 87 (Apr 2022), Sprint 88 (May 2022), Sprint 89 (Jun 2022), Sprint 90 (Jul 2022), Sprint 91 (Aug 2022)
-
0.25
- Enter to the hosts /zabbix/zabbix.php?action=host.view
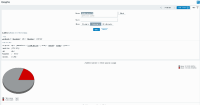
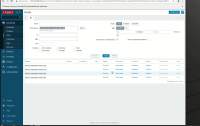
- click on graphs https://scr.pics/zabbix_Hosts_2020-05-15_11-02-51.png and showing only 20 graphs grep ZBX_MAX_GRAPHS_PER_PAGE include/defines.inc.php
define('ZBX_MAX_GRAPHS_PER_PAGE', 20); But no page navigation on graph page
- causes
-
ZBX-20501 "Data" subfilter is missing in Monitoring => Graphs view
-
- Closed
-
-
ZBX-20505 Subfilter counters are displaying incorrect values in Monitoring => Graphs view
-
- Closed
-
- duplicates
-
ZBX-18093 Hosts Graphs Page does not show all graphs and not indicate this
-
- Closed
-
- is duplicated by
-
ZBXNEXT-6531 Allow configuring of max graphs per page
-
- Closed
-
-
ZBXNEXT-6404 Max 20 graphs on Monitoring>Hosts>Graph
-
- Closed
-
-
ZBXNEXT-7435 Pagination in Monitoring -> Hosts -> Graphs
-
- Closed
-
-
ZBX-17808 Graphs in Monitoring->Hosts displayed partially
-
- Closed
-
-
ZBX-17867 max 20 graph view in monitoring hosts
-
- Closed
-
-
ZBX-18485 Max 20 graphs on Monitoring>Hosts>Graph
-
- Closed
-


