-
Type:
Incident report
-
Resolution: Duplicate
-
Priority:
 Trivial
-
Affects Version/s: 5.0.0
-
Component/s: Frontend (F)
-
None
What is the meaning/purpose of the dots on the classic graphs? I can't find any explanation on here: https://www.zabbix.com/documentation/current/manual/config/visualisation/graphs/custom
There does not appear to be any new config item to enable/disable them.
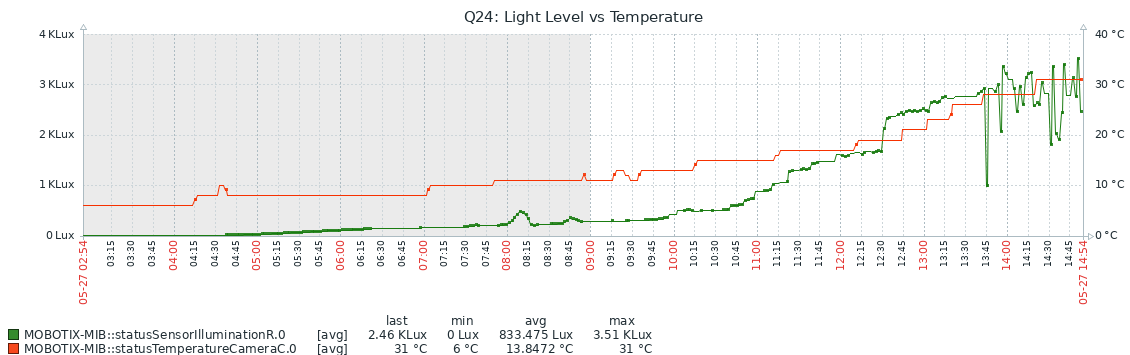
On this graph, for example, on the red line you can see that the polled value has changed around 1115 and no dot is drawn, yet on most other occasions when it changes, a dot is drawn:

A trivial related issue here is that the dot and the trend lines are not aligned perfectly. You can see this in the sharp spikes on the green line, the dot looks like the wind is blowing it to the right.
- duplicates
-
ZBX-17683 Strange points on classic graphs
-
- Closed
-