-
Type:
Problem report
-
Resolution: Duplicate
-
Priority:
 Trivial
-
None
-
Affects Version/s: 5.0.1
-
Component/s: Frontend (F)
-
Environment:Ubuntu Server 18.04.4, nginx 1.14.0-0ubuntu1.7, zabbix-frontend-php 5.0.1-1+bionic, zabbix-nginx-conf 5.0.1-1+bionic
Steps to reproduce:
- For example you need to configure 2 hosts with template "Template OS Linux by Zabbix agent". This hosts will have the "Network Interfaces" host screens.
- Open the page "Monitoring - Hosts".
- Click on "Screens" link of the first host. The host screen "Network Interfaces" of the first host will be opened.
- Now click on graph "Network traffic". The graphs page "Network traffic" of the first host will be opened.
- Go to the page "Monitoring - Hosts" again.
- Click on "Screens" link of the second host. The host screen "Network Interfaces" of the second host will be opened.
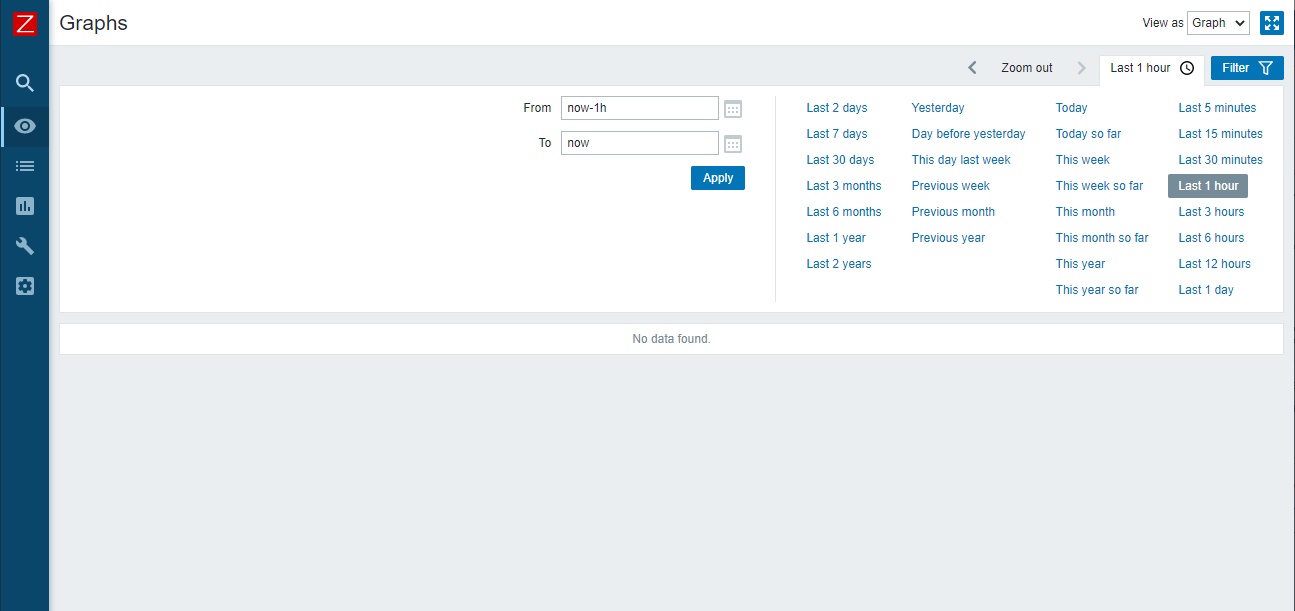
- Now click on the graph "Network traffic". You will see the graphs page with "No data found" message (see the screenshot)!
- To workaround this bug you need to go to "Monitoring - Hosts" page again and click the "Graphs" link of the second host. After that the graph page "Network Interfaces" of the second host will be opened correctly.
Result:
See screenshot...
- duplicates
-
-
- Closed
-