-
Type:
Problem report
-
Resolution: Fixed
-
Priority:
Major
-
Affects Version/s: 5.0.0
-
Component/s: Agent (G)
-
None
-
Sprint 65 (Jun 2020), Sprint 66 (Jul 2020)
-
2
On Solaris OS, key "vm.memory.size[available]" shows very different numbers (much less) if compare with "top" or "vmstat" command line tool.
:/opt/zabbix/sbin# ./zabbix_agentd -t 'vm.memory.size[available]'
vm.memory.size[available] [u|1418600448]

:/opt/zabbix/sbin# ./zabbix_agentd -t 'vm.memory.size[free]'
vm.memory.size[free] [u|1418600448]

:/opt/zabbix/sbin# ./zabbix_agentd -t 'vm.memory.size[used]'
vm.memory.size[used] [u|20056236032]


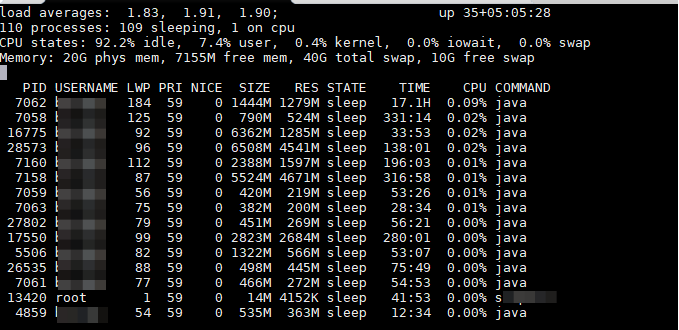
load averages: 3.46, 3.84, 3.98; up 35+02:34:54 11:46:05
110 processes: 109 sleeping, 1 on cpu
CPU states: 93.6% idle, 5.6% user, 0.9% kernel, 0.0% iowait, 0.0% swap
Memory: 20G phys mem, 7381M free mem, 40G total swap, 10G free swap
If I understand correctly, in code of zabbix agent, "free" and "available" actually should return identical values.
static int	VM_MEMORY_AVAILABLE(AGENT_RESULT *result)
{
	SET_UI64_RESULT(result, (zbx_uint64_t)sysconf(_SC_AVPHYS_PAGES) * sysconf(_SC_PAGESIZE));
So, we perform syscall to "sysconf" function, providing _SC_AVPHYS_PAGES as parameter.
It's described here
https://docs.oracle.com/cd/E26502_01/html/E29034/sysconf-3c.html
This is one more data collection on the same host:


Not sure who is wrong - zabbix agent or top, vmstat tools.
SunOS XXXXXXXXXX 5.10 Generic_150400-61 sun4v sparc sun4v
We tried agent version 5.0.1