-
Type:
Problem report
-
Resolution: Fixed
-
Priority:
Trivial
-
Affects Version/s: 4.0.23rc1, 5.0.3rc1, 5.2.0alpha1
-
Component/s: Frontend (F)
-
Sprint 67 (Aug 2020), Sprint 68 (Sep 2020), Sprint 69 (Oct 2020), Sprint 70 (Nov 2020), Sprint 71 (Dec 2020), Sprint 72 (Jan 2021), Sprint 73 (Feb 2021), Sprint 74 (Mar 2021), Sprint 75 (Apr 2021), S24-W14/15, S24-W16/17, S24-W20/21, S24-W22/23
-
1
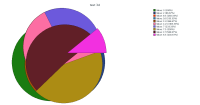
Problem description: If a Pie graph (or Explode graph) displays several items with approximately equal values, and if the type of the 1st item in the list is set to "Graph sum", then the graph shows that the value of last item is slightly lower than it actually is (the color of the previous item is visible on the pie).
Steps to reproduce:
- Create a host with 5 trapper items
- Send the same value (for example 30) to all trapper items
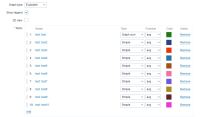
- Create a graph that displays all of the created trapper items
- Change type of items to "Graph sum" and check Preview tab, one at a time starting from the last item in the list.
Result: When the type of the 1st item in the list of items is set to "Graph sum", the Pie graph shows that the value of the last item in the list is smaller than of the 2nd to last item in the list (the color of the 2nd to last item is visible on the pie graph) even though the values are equal.
Expected: Same as for all other items, when the type of the 1st item in the list is set to "Graph sum", the prie graph should display only 1 color - the color of the last item in the list.
P.S. This behavior is still observer after the graph is saved.


