Uploaded image for project: 'ZABBIX BUGS AND ISSUES'
  1. ZABBIX BUGS AND ISSUES
  2. ZBX-18201

Latest Data 'Reset' Defaulting to All Hosts - PHP Memory Exhausted

    • Icon: Problem report Problem report
    • Resolution: Duplicate
    • Icon: Trivial Trivial
    • None
    • 5.0.2
    • Frontend (F), Server (S)
    • None
    • Ubuntu18.04 running frontend and server only, nginx web server
    • Sprint 67 (Aug 2020)

      Steps to reproduce:

      1. Upgrade from 4.4 to 5.0 only change in environment
      2. When Monitoring -> Hosts, then selected desired host 'Latest Data'
      3. Current Hosts Loads, when 'reset' is pressed initially HTTP 500 Error

      Result:
      nginx log showed PHP memory exhaustion, documented in other versions. Increased to 256M from 128, error persists. Then pushed to 1G and eventually 'Reset' worked but has loaded all configured hosts (disabled and enabled).

      Expected:
      in 4.4 'reset' presents with blank screen for host/host group selection

      Server Stats is attached

          [ZBX-18201] Latest Data 'Reset' Defaulting to All Hosts - PHP Memory Exhausted

          Can you also, please, note values for the following settings:
          1) Administration -> General -> GUI: Limit for search and filter results
          2) User settings -> Rows per page

          Normally resetting filter in host list should not overload the frontend.
          It could be useful if you could enable debug mode and show the summary data for page (top 5 rows of profiler) and list heaviest SQL's if any.

          Valdis Murzins added a comment - Can you also, please, note values for the following settings: 1) Administration -> General -> GUI : Limit for search and filter results 2) User settings -> Rows per page Normally resetting filter in host list should not overload the frontend. It could be useful if you could enable debug mode and show the summary data for page (top 5 rows of profiler) and list heaviest SQL's if any.

          Cory White added a comment -

          1) Was set to 5000 (verifying during host import), I did crank that down to match user settings....

          2) 500

          Those settings were persistent in the 4.4 configuration btw (5000, 500 respectively) without HTTP 500 error - I will need to work on a maintenance window to get debug (is there a level preference in server conf)? We had just moved the server into production.......

          Cory White added a comment - 1) Was set to 5000 (verifying during host import), I did crank that down to match user settings.... 2) 500 Those settings were persistent in the 4.4 configuration btw (5000, 500 respectively) without HTTP 500 error - I will need to work on a maintenance window to get debug (is there a level preference in server conf)? We had just moved the server into production.......

          Valdis Murzins added a comment - - edited

          Sorry, I misunderstood, which page you are talking about.

          This can be a problem from ZBX-18071. You can try to apply the patch from that task to check, if it will help.

          Valdis Murzins added a comment - - edited Sorry, I misunderstood, which page you are talking about. This can be a problem from ZBX-18071 . You can try to apply the patch from that task to check, if it will help.

          Cory White added a comment - - edited

          I attempted the patch - there is no change. Seems that issue relates to even getting latest data to load, mine relates to trying to clear/reset it to blank/no filters. I don't have any SQL queries hanging, nor do I get any debug messages in the UI. Just the memory error in nginx. Also we are using mariadb on the backend versus postresgl.

          My work around it to go to Monitoring->Hosts to load latest data ILO clearing and picking new filters.

          nginx error:

          2020/08/06 15:35:55 [error] 6261#6261: *213 FastCGI sent in stderr: "PHP message: PHP Fatal error:  Allowed memory size of 134217728 bytes exhausted (tried to allocate 20480 bytes) in /usr/share/zabbix/include/db.inc.php on line 397" while reading response header from upstream, client: 10.218.4.120, server: FQDN, request: "GET /zabbix.php?action=latest.view&filter_rst=1 HTTP/1.1", upstream: "fastcgi://unix:/run/php/php7.2-fpm.sock:", host: "FQDN", referrer: "https://FQDN/zabbix.php?action=latest.view&filter_hostids%5B%5D=9805&filter_hostids%5B%5D=9808&filter_hostids%5B%5D=9809&filter_hostids%5B%5D=9816&filter_hostids%5B%5D=9817&filter_hostids%5B%5D=9818&filter_application=Disk+Partitions&filter_select=&filter_set=1"


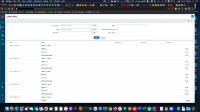
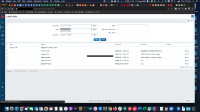
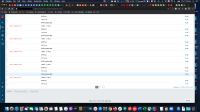
          latest view by filter or host does not seem to matter, same error even on lightly monitored hosts (less than 200 items). When I push memory to 1G the page will load but loads all hosts ILO clearing all hosts. Added screenshots of latest view, then after reload when memory pushed to 1G

          Debug:

          Total time: 0.022654
          Total SQL time: 0.047475
          SQL count: 39 (selects: 34 | executes: 14)
          Peak memory usage: 4M
          Memory limit: 1G

          Cory White added a comment - - edited I attempted the patch - there is no change. Seems that issue relates to even getting latest data to load, mine relates to trying to clear/reset it to blank/no filters. I don't have any SQL queries hanging, nor do I get any debug messages in the UI. Just the memory error in nginx. Also we are using mariadb on the backend versus postresgl. My work around it to go to Monitoring->Hosts to load latest data ILO clearing and picking new filters. nginx error: 2020/08/06 15:35:55 [error] 6261#6261: *213 FastCGI sent in stderr: "PHP message: PHP Fatal error:  Allowed memory size of 134217728 bytes exhausted (tried to allocate 20480 bytes) in /usr/share/zabbix/include/db.inc.php on line 397" while reading response header from upstream, client: 10.218.4.120, server: FQDN, request: "GET /zabbix.php?action=latest.view&filter_rst=1 HTTP/1.1", upstream: "fastcgi://unix:/run/php/php7.2-fpm.sock:", host: "FQDN", referrer: "https://FQDN/zabbix.php?action=latest.view&filter_hostids%5B%5D=9805&filter_hostids%5B%5D=9808&filter_hostids%5B%5D=9809&filter_hostids%5B%5D=9816&filter_hostids%5B%5D=9817&filter_hostids%5B%5D=9818&filter_application=Disk+Partitions&filter_select=&filter_set=1"   latest view by filter or host does not seem to matter, same error even on lightly monitored hosts (less than 200 items). When I push memory to 1G the page will load but loads all hosts ILO clearing all hosts. Added screenshots of latest view, then after reload when memory pushed to 1G Debug: Total time: 0.022654 Total SQL time: 0.047475 SQL count: 39 (selects: 34 | executes: 14) Peak memory usage: 4M Memory limit: 1G

          Thank you for your help. We will be looking into it.

          Valdis Murzins added a comment - Thank you for your help. We will be looking into it.

          Closing as duplicate of ZBX-18071.

          Andrejs Verza added a comment - Closing as duplicate of ZBX-18071 .

            averza Andrejs Verza
            Xponet Cory White
            Votes:
            0 Vote for this issue
            Watchers:
            4 Start watching this issue

              Created:
              Updated:
              Resolved: