-
Type:
Problem report
-
Resolution: Unresolved
-
Priority:
 Major
Major
-
None
-
Affects Version/s: 5.2.3
-
Component/s: Frontend (F), Templates (T)
Steps to reproduce:
The following procedure represents the "Custom - OS - Linux - Filesystems" dashboard configured in the following template:
https://github.com/scoopex/zabbix-agent-extensions/blob/master/zabbix_templates/5.2/custom-os-linux.xml
Procedure:
- Create a template
- Create a autodiscovery
- Create three types of graph prototypes for the same "thing" but different measures
- Create a host dashboard
- Add every of the three graph prototypes as columns and define them with Columns=1 and Rows=1
- Assign the template to a host
- Auto discover at least 2 "things"
- View the dashboard
- Unless previous zabbix releases you do not get a graph matrix with 3 columns and the number of rows of the discovered "things", you now have to page separately every graph through the graphs created by the graph prototypes
Result:
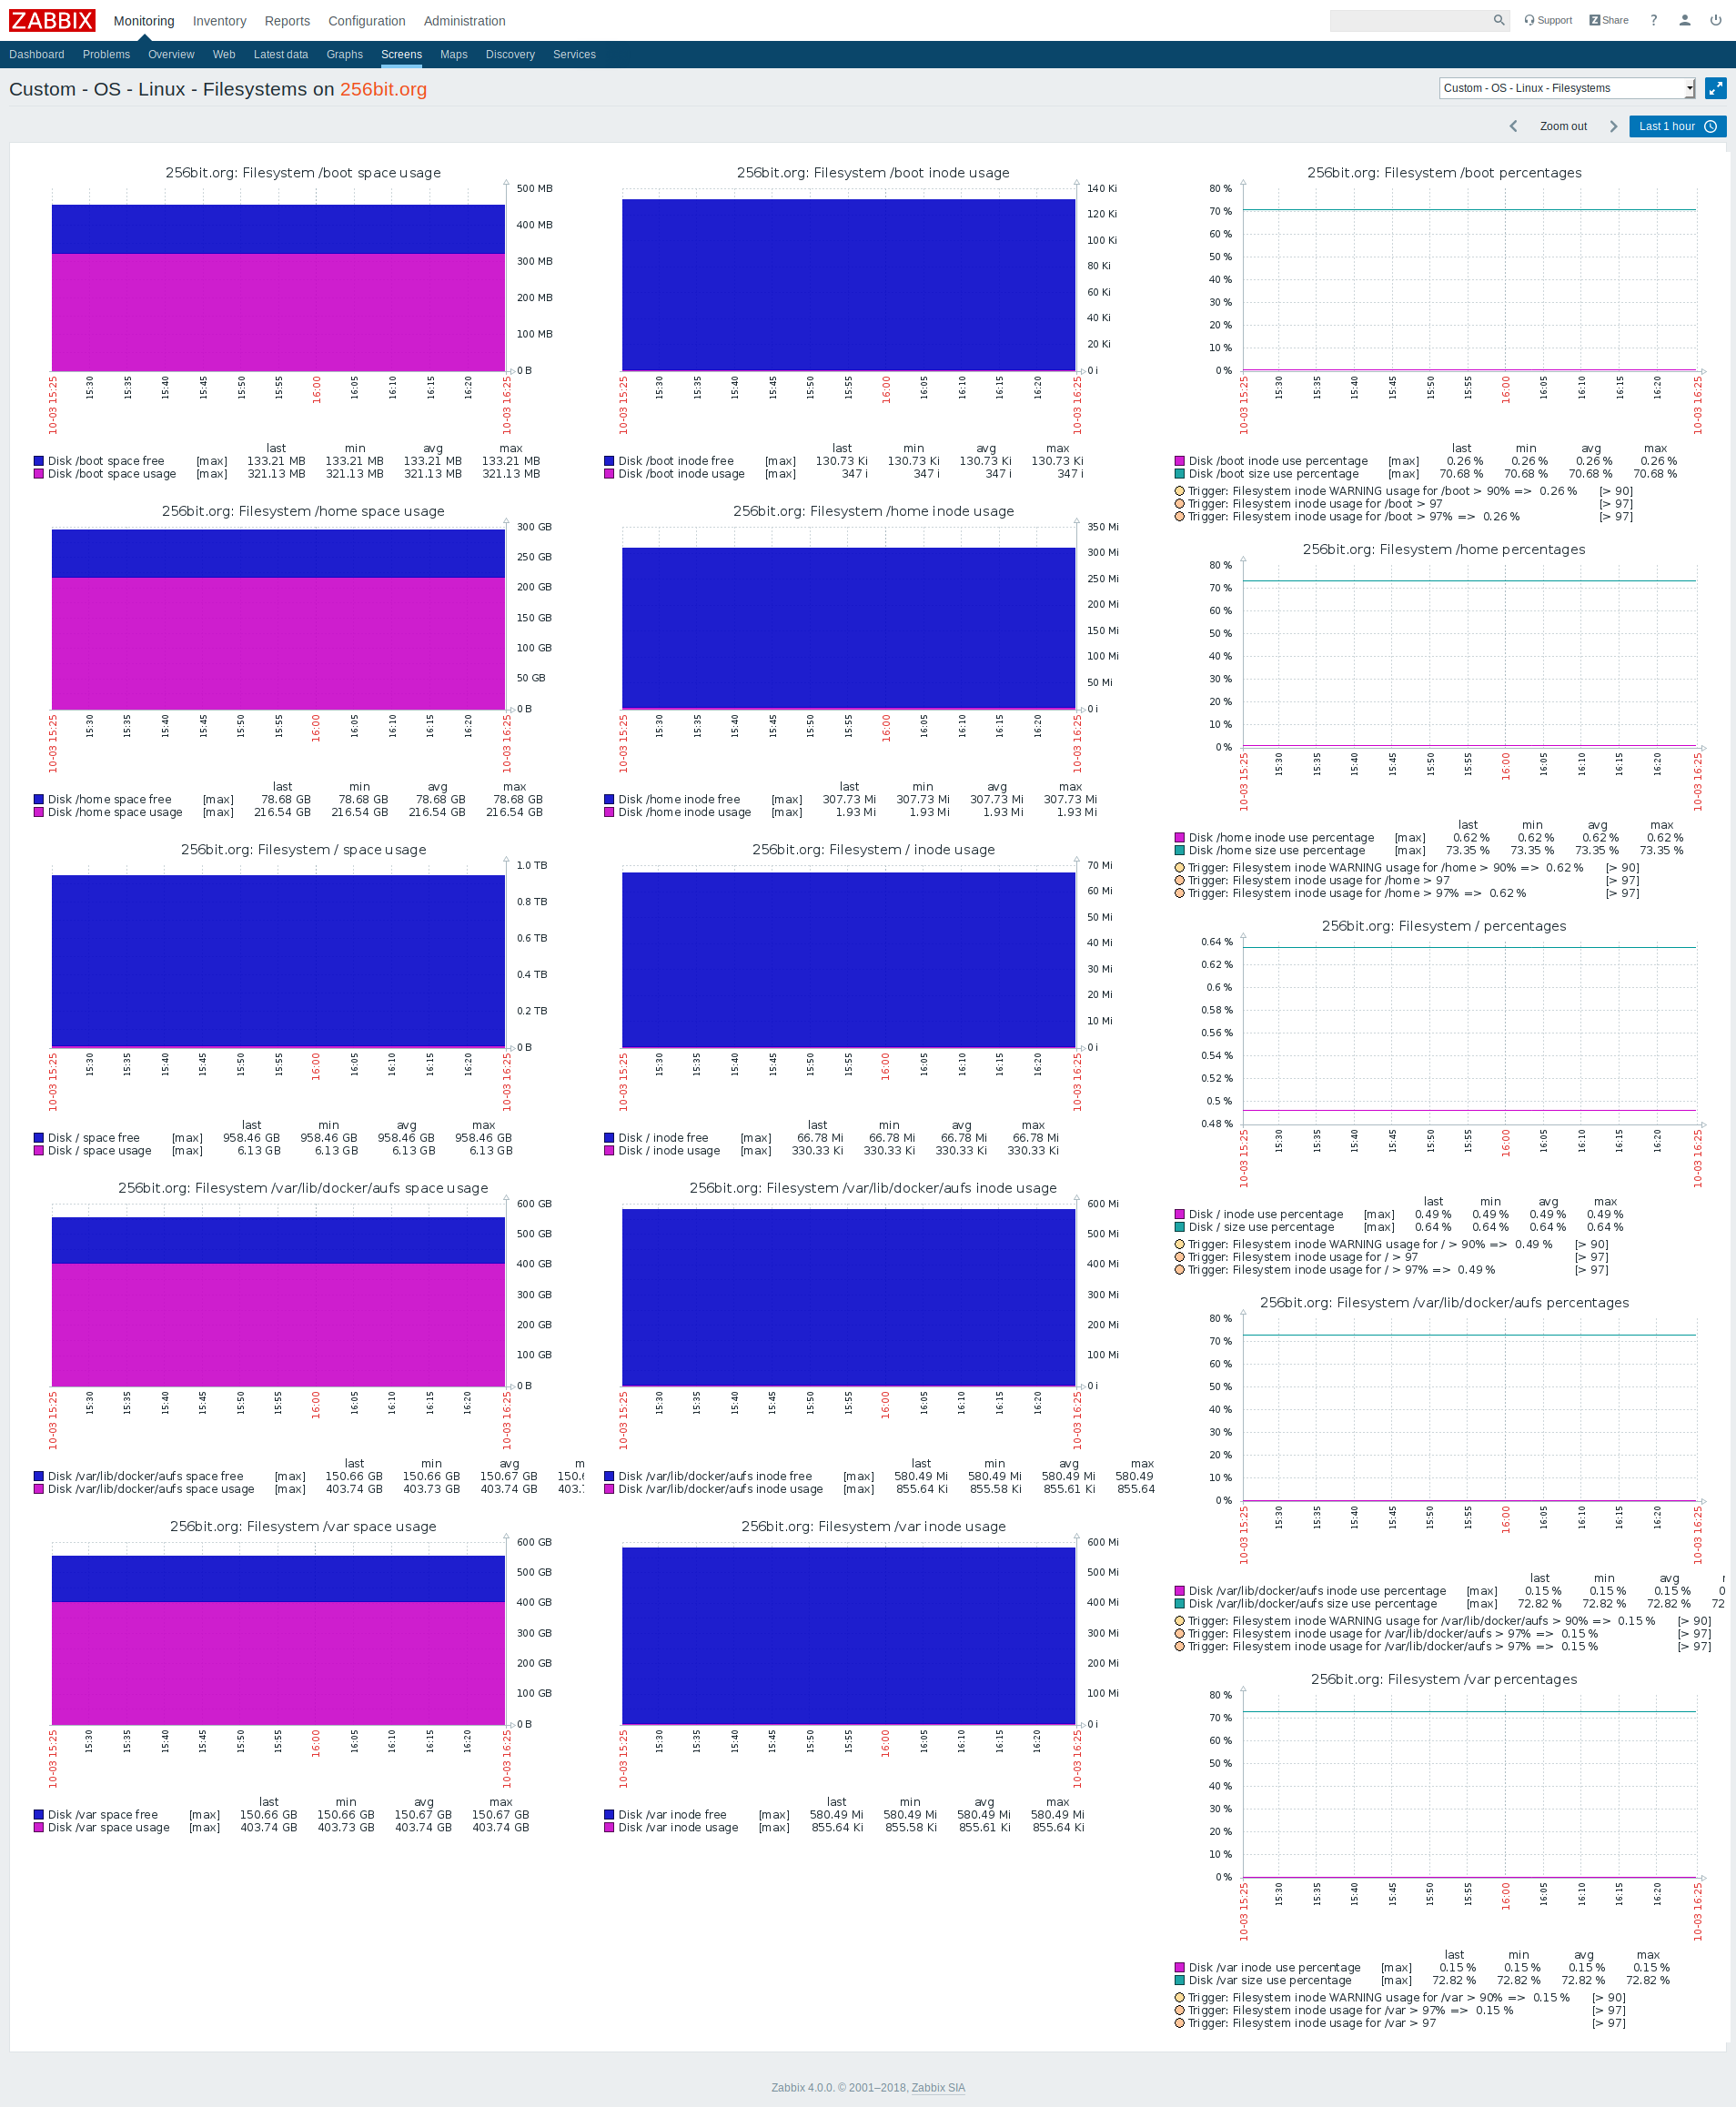
Screenshot of the described template with zabbix 4:
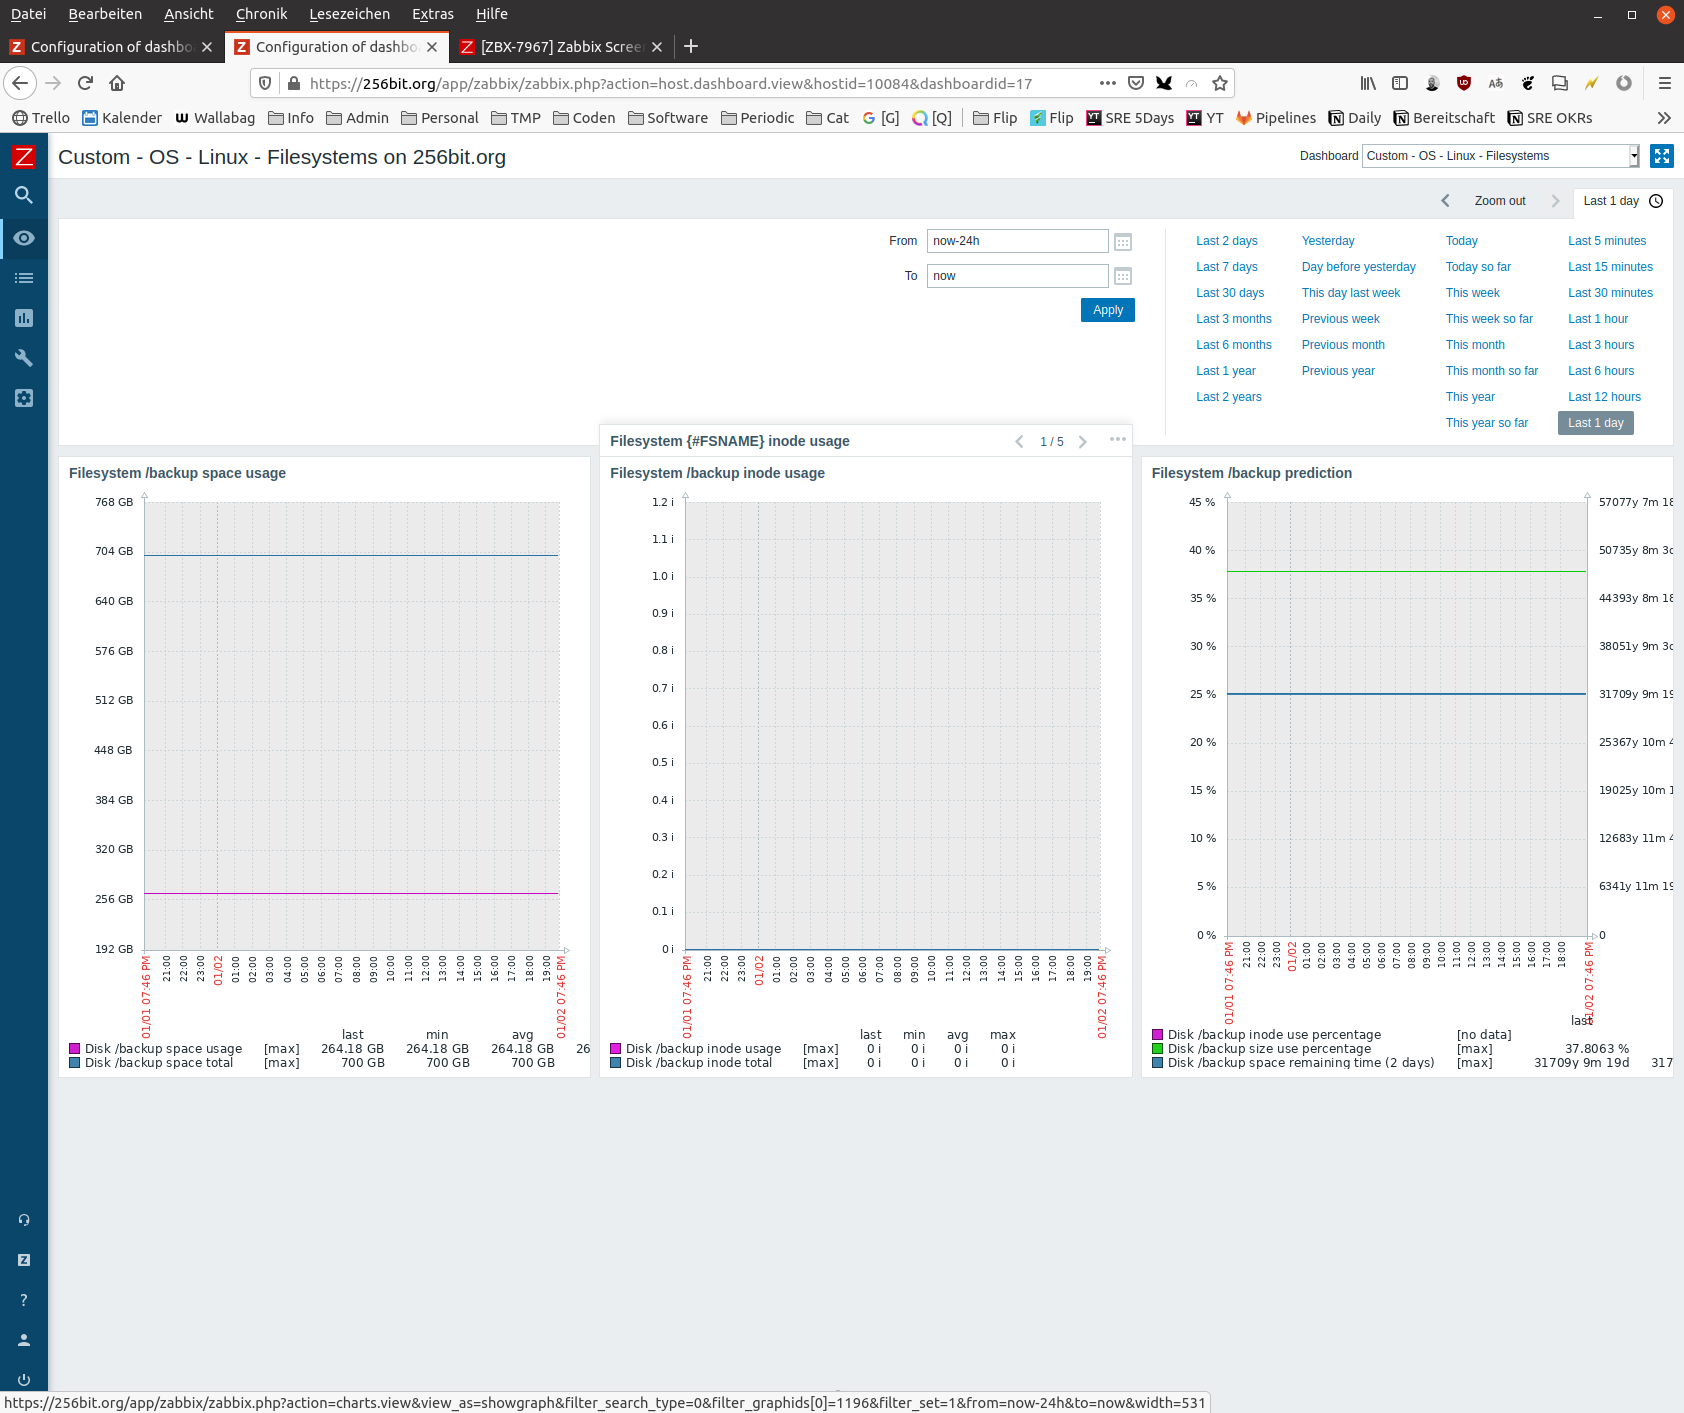
Screenshot of the described template with zabbix 5.2:

Expected:
- The graphs in the same line should reference the same "thing" (in my case the file system) but present the different aspects of the "thing"
- The discovered "things" (in my case the file systems) should be enumerated by the rows
- All graphs in the same row should be aligned (see
ZBX-7967)
![Host_screens_[refreshed_every_30_sec.]_-_2018-10-03_16.25.25.png](/secure/attachment/122527/Host_screens_%5Brefreshed_every_30_sec.%5D_-_2018-10-03_16.25.25.png)
- depends on
-
-

- Closed
-